. 2024 Oct 28;14(1):25742.
doi: 10.1038/s41598-024-76919-4.

A novel risk score model of lactate metabolism for predicting outcomes and immune signatures in acute myeloid leukemia

Affiliations

A novel risk score model of lactate metabolism for predicting outcomes and immune signatures in acute myeloid leukemia

Ze-Min Huang et al. Sci Rep. .

Abstract

Acute myeloid leukemia (AML) is a malignant tumor with high recurrence and refractory rates and low survival rates. Increased glycolysis is characteristic of metabolism in AML blast cells and is also associated with chemotherapy resistance. The purpose of this study was to use gene expression and clinical information from The Cancer Genome Atlas (TCGA) database to identify subtypes of AML associated with lactate metabolism. Two different subtypes linked to lactate metabolism, each with specific immunological features and consequences for prognosis, were identified in this study. Using the TCGA and International Cancer Genome Consortium (GEO) cohorts, a prognostic model composed of genes (LMNA, RETN and HK1) for the prognostic value of the lactate metabolism-related risk score prognostic model was created and validated, suggesting possible therapeutic uses. Additionally, the diagnostic value of the prognostic model genes was explored. LMNA and HK1 were ultimately identified as hub genes, and their roles in AML were determined through immune infiltration, GeneMANIA, GSEA, methylation analysis and single-cell analysis. LMNA was upregulated in AML associating with a poor prognosis while HK1 was downregulated in AML associating with a favorable prognosis. The findings underscore the noteworthy impact of genes linked to lactate metabolism in AML and illustrate the possible therapeutic usefulness of the lactate metabolism-related risk score and the hub lactate metabolism-related genes in guiding AML patients' treatment choices.

Keywords: Acute myeloid leukemia; Immune signature; Lactate metabolism-associated gene; OS; Risk model.


Conflict of interest statement

The authors declare no competing interests.

Figures

Fig. 1
Fig. 1
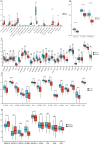
Differentially expressed genes in AML and analysis of gene mutations related to lactic acid metabolism. (A) Volcano map showing the differentially expressed genes between AML bone marrow samples and control samples. (B) Heatmap of the top 44 differentially expressed genes in the GSE9476 dataset. (C) Lactate metabolism-associated genes alteration frequency in AML patients in TCGA. (D,E) The top ten genes with CNA type as amplification. (F) Overall survival of AML patients in the high-TMB and low-TMB groups. CNA copy number alteration, SCNAs somatic copy number alterations, CNV copy number variations, TMB tumor mutation burden.
Fig. 2
Fig. 2
Consensus clustering of lactate metabolism-associated genes in AML and related functional enrichment analysis. (A) Unsupervised consensus clustering (K-means) was applied to the LAML cohort in TCGA using 1000 iterations for k = 2, resulting in consensus matrices of patient clusters. (B) Principal component analysis of subtypes in the TCGA cohort. (C) Overall survival of AML patients in group 1 and group 2. (D) Tumor mutation burden frequency between group 1 and group 2. (E) Enriched entries of group 1 obtained from GO and KEGG analyses. (F) Enriched GSEA results for group 1. (G) Enriched entries of group 2 obtained from GO and KEGG analysis. (H) Enriched GSEA results for group 2.
Fig. 3
Fig. 3
Immunocorrelation analysis of subtypes. (A) The landscape of immune cell infiltration between the two subtypes. (B) Stromal score, immune score and ESTIMATE score between the two subtypes. (C,D,F) Gene expression of HLA, MHC and immune checkpoint genes in the two clusters.
Fig. 4
Fig. 4
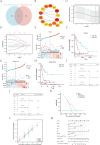
Development and validation of the lactic acid metabolism-related prognostic models. (A) Intersection of DEGs of AML and lactate metabolism-associated genes. (B) Protein and protein interaction network of the 15 genes with the highest degrees. (C,D) The coefficient distribution of LASSO Cox regression analysis and adjustment parameters were calculated based on partial likelihood deviation and tenfold cross-validation. (E) The risk curve, survival status, and model gene expression levels of AML patients in different risk groups in the TCGA cohort. (F) Survival analysis between risk groups in the TCGA cohort. (G) The risk curve, survival status, and model gene expression levels of AML patients in different risk groups in GSE71014. (H) Survival analysis between risk groups in the GSE71014 dataset. (I,J) Univariate and multivariate analyses of the prognostic model genes. (K) Result of the decision curve analysis. (LM) Prognostic correction curves and nomogram incorporating age, sex, and WBC count as variables.
Fig. 5
Fig. 5
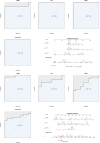
Development of lactic acid metabolism-related diagnostic models. (A) The ROC curve of LMNA in bone marrow samples in the GSE9476 dataset. (B) The ROC curve of HK1 in bone marrow samples from the GSE9476 dataset. (C) The ROC curve of RETN in bone marrow samples in the GSE9476 dataset. (D) The ROC curve of the model constructed with the three genes in bone marrow samples from the GSE9476 dataset. (E) Diagnostic line chart of bone marrow samples in the GSE9476 dataset. (F) The ROC curve of LMNA in blood samples in the GSE9476 dataset. (G) The ROC curve of HK1 in blood samples in the GSE9476 dataset. (H) The ROC curve of RETN in blood samples in the GSE9476 dataset. (I) The ROC curve of the model constructed with the three genes in blood samples in the GSE9476 dataset. (J) Diagnostic line chart of blood samples in the GSE9476 dataset.
Fig. 6
Fig. 6
Hub genes determination and analysis of relevant mechanisms. (A) Lactate metabolism-associated genes that were differentially expressed in both the AML- and LMAG-based subtypes were considered hub genes. (B,C) Validation of the hub genes in GSE90062. (D) Correlation between infiltrating immune cells and the expression of LMNA. (E) Infiltration of macrophages in the high and low LMNA expression groups. (F) Correlation between infiltrating immune cells and the expression of HK1. (G) Infiltration of macrophages, neutrophils and pDCs in the high and low HK1 expression groups. (H,I) Biological processes associated with LMNA, HK1 and their related genes. (J) GSEA results for the AML patients in the high LMNA expression group. (K) GSEA results for the low HK1 expression group in AML. (L) Copy number variation results for LMNA and HK1. (M) Methylation analysis of LMNA and HK1.
Fig. 7
Fig. 7
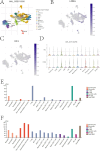
Single-cell analysis and verification of the hub genes in the Human Protein Atlas (THPA) (A). The identified cell clusters in the AML dataset GSE116256. (BD) Expression of LMNA and HK1 in various cells. (E) The expression levels of LMNA in immune cell types in the THPA dataset. (F) The expression levels of HK1 in immune cell types in the THPA dataset.

References

    1. Pollyea, D. A. et al. Acute myeloid leukemia, Version 3.2023, NCCN Clinical Practice guidelines in Oncology. J. Natl. Compr. Cancer Netw. JNCCN 21, 503–513. 10.6004/jnccn.2023.0025 (2023). - PubMed
    1. DeWolf, S. & Tallman, M. S. How I treat relapsed or refractory AML. Blood 136, 1023–1032. 10.1182/blood.2019001982 (2020). - PMC - PubMed
    1. Mougiakakos, D. The induction of a permissive environment to promote T cell immune evasion in acute myeloid leukemia: the metabolic perspective. Front. Oncol. 9, 1166. 10.3389/fonc.2019.01166 (2019). - PMC - PubMed
    1. Chen, W. L. et al. A distinct glucose metabolism signature of acute myeloid leukemia with prognostic value. Blood 124, 1645–1654. 10.1182/blood-2014-02-554204 (2014). - PMC - PubMed
    1. Herst, P. M., Howman, R. A., Neeson, P. J., Berridge, M. V. & Ritchie, D. S. The level of glycolytic metabolism in acute myeloid leukemia blasts at diagnosis is prognostic for clinical outcome. J. Leukoc. Biol. 89, 51–55. 10.1189/jlb.0710417 (2011). - PubMed