. 2024 Nov;9(11):2997-3012.
doi: 10.1038/s41564-024-01821-8. Epub 2024 Oct 28.

PcdA promotes orthogonal division plane selection in Staphylococcus aureus

Affiliations

PcdA promotes orthogonal division plane selection in Staphylococcus aureus

Félix Ramos-León et al. Nat Microbiol. 2024 Nov.

Abstract

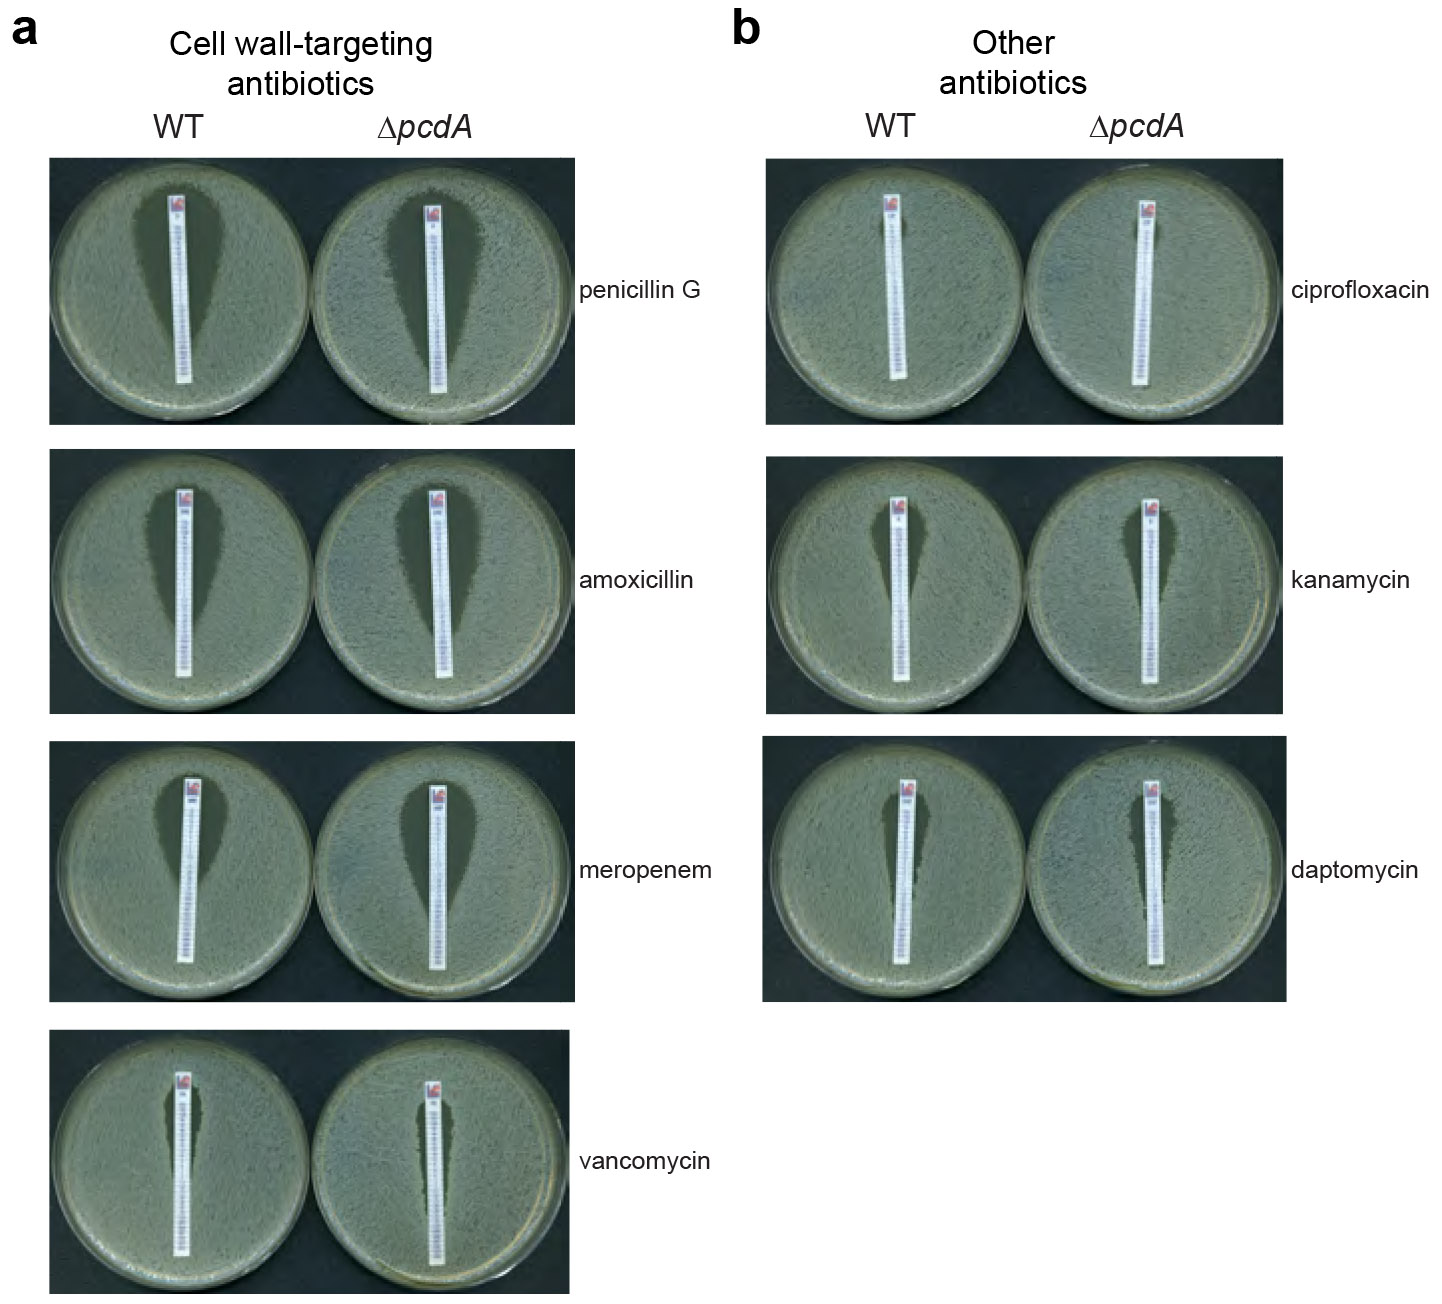
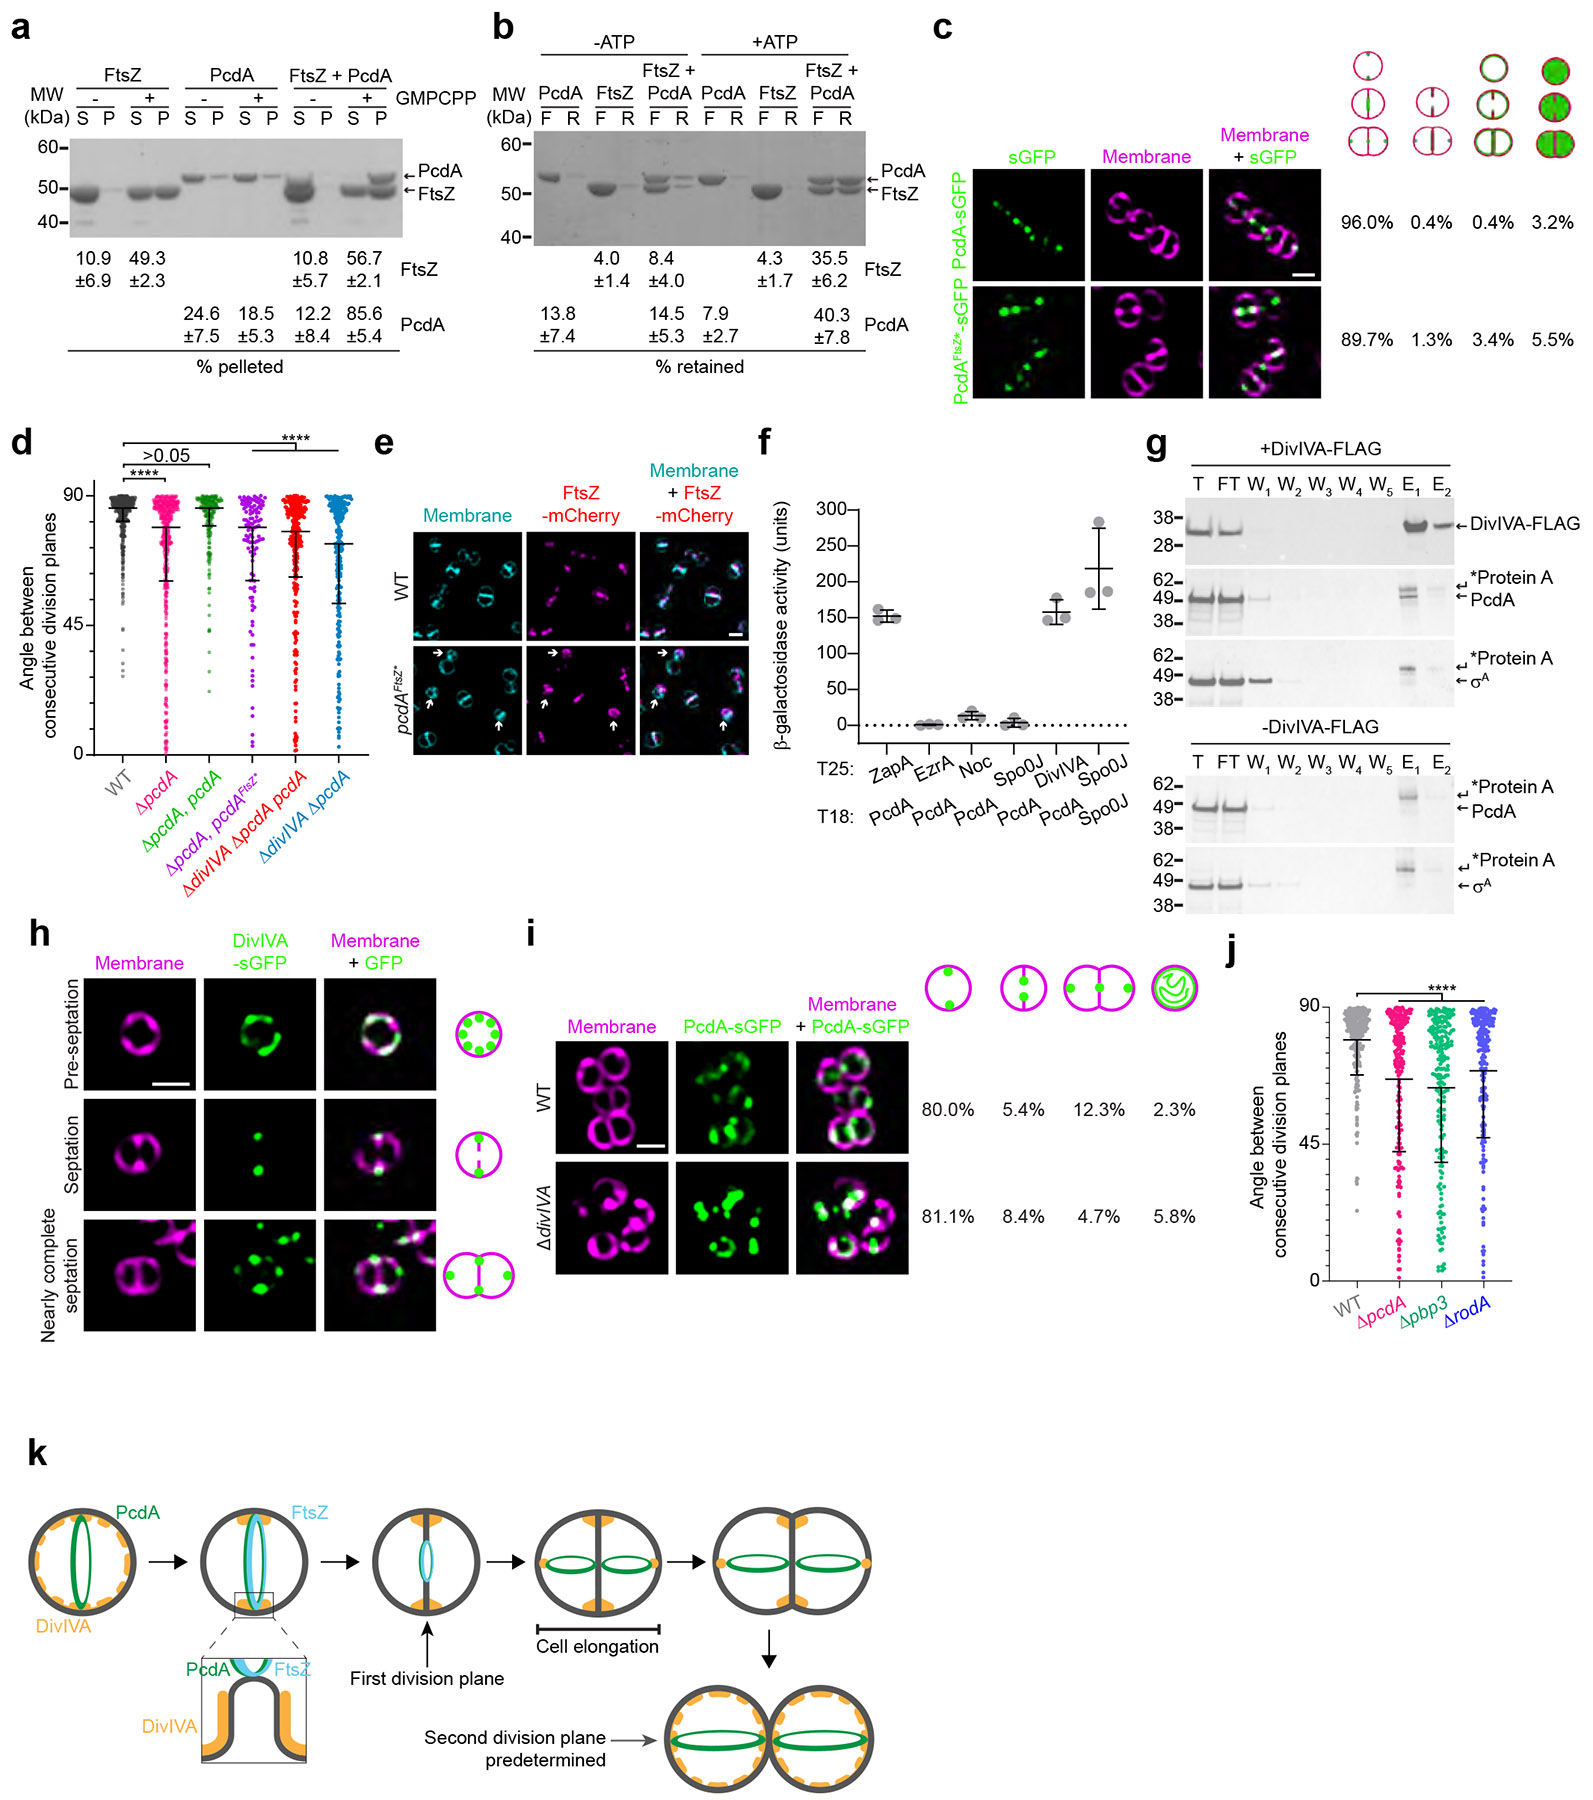
The bacterial pathogen, Staphylococcus aureus, grows by dividing in two alternating orthogonal planes. How these cell division planes are positioned correctly is not known. Here we used chemical genetic screening to identify PcdA as a division plane placement factor. Molecular biology and imaging approaches revealed non-orthogonal division plane selection for pcdA mutant bacteria. PcdA is a structurally and functionally altered member of the McrB AAA+ NTPase family, which are often found as restriction enzyme subunits. PcdA interacts with the tubulin-like divisome component, FtsZ, and the structural protein, DivIVA; it also localizes to future cell division sites. PcdA multimerization, localization and function are NTPase activity-dependent. We propose that the DivIVA/PcdA complex recruits unpolymerized FtsZ to assemble along the proper cell division plane. Although pcdA deletion did not affect S. aureus growth in several laboratory conditions, its clustered growth pattern was disrupted, sensitivity to cell-wall-targeting antibiotics increased and virulence in mice decreased. We propose that the characteristic clustered growth pattern of S. aureus, which emerges from dividing in alternating orthogonal division planes, might protect the bacterium from host defences.


Figures

Extended Data Figure 1.
Extended Data Figure 1.. Comparison of S. aureus growth in TSB and modified M63 media.
(a) Growth curves of WT cells grown in (olive) tryptic soy broth (TSB) or (gray) modified M63 media. Data points represent mean (n = 3 independent cultures); errors: S.D. (b) WT cells were grown in (olive) TSB or (gray) modified M63 media and (first lane) the fraction of cells at the indicated cell cycle stages (not dividing; actively dividing; near completion of cell division) were quantified by fluorescence microscopy and staining cells with membrane dye FM4-64. Data points represent mean; errors: S.D. (c) Growth curves of WT, ΔpcdA (pink), ΔpcdA complemented with pcdA (green) strains grown in TSB medium. Data points represent mean (n = 3 independent cultures); errors: S.D. (d) Angle between consecutive division planes in WT (gray), ΔpcdA (pink), ΔpcdA complemented with pcdA (green) strains grown in TSB medium. Bars indicate median; interquartile range indicated with whiskers. Strains: JE2, FRL60, FRL62. Statistical analysis: Kruskal-Wallis; **** indicates < 0.0001. (e) Representative static fluorescence micrographs of WT and ΔpcdA grown in TSB stained with WGA-488 and membrane dye FM4-64. WGA-488 was washed away and cells were allowed to divide for one round of cell division resulting in half cell staining. Left column: membranes stained with FM4-64 (pink); middle column: fluorescence from WGA-488 (green); right column: overlay of WGA-488 and membranes; Division planes are indicated with dashed lines. Asterisk indicates a ΔpcdA cell with misplacement of the second division plane. Strains: JE2 and FRL60.
Extended Data Figure 2.
Extended Data Figure 2.. Morphological characterization of various S. aureus strains.
(a-f”) Cell morphologies of (a-b”) WT, (c-d”) ΔpcdA, or (e-f”) ΔpcdA complemented with pcdA in the (a-a”, c-c”, e-e”) absence or (b-b”, d-d”, f-f”) presence of PC190723 examined using fluorescence microscopy. a-f: membranes visualized with FM4-64 (pink); b’-g’: nucleoid visualized using DAPI (cyan); b”-g”: overlay, membrane and nucleoid. Scale bar: 1 μm. (g) Immunoblot using polyclonal antibodies against PcdA using extracts from WT, ΔpcdA, and ΔpcdA complemented at an ectopic chromosomal locus with pcdA strains. Predicted molecular weight for PcdA is ~53 kDa. Strains: JE2, FRL60, and FRL62. (h) Larger field of view showing subcellular localization of PcdA-sGFP in WT strain. First row: PcdA-sGFP (green); second row: membrane stained with FM4-64 (pink); third row: overlay of PcdA-sGFP and membrane. Scale bar: 1 μm. Strain FRL28. (i) Cell sizes (calculated as area) of WT (gray), ΔpcdA (pink), Δnoc (green), or ΔpcdA Δnoc (purple) strains. Statistical analysis: one-way ANOVA; **** indicates p value < 0.0001. Strains: JE2, FRL60, NE486, FRL67. Bars indicate the mean; errors: S.D. (j) Cell sizes (calculated as area) of WT (gray), or cells producing FtsZ-sGFP (green) or FtsZ-mCherry (pink). Bars indicate mean; errors: S.D. Strains: JE2, FRL126, FRL115.
Extended Data Figure 3.
Extended Data Figure 3.. Phylogenetic tree of McrB AAA+ ATPase from a Multiple Sequence Alignment with a curated set of proteins.
(a) The clades are colored by taxonomy as shown in the legend. Organism names are shown for the PcdA branch. Representative architectures and operon are shown with the accession and organism name below them. The arrows denote the genes in the operon with the “*” denoting the accession shown below it. The architectures are numbered, and the numbers are placed in the branches where they are found. Domains with variability in the number of tandem repeats are shown with a 1..2 or 1..3 above them. Abbreviations: FokIN, FokI-N-terminal-domain-like; MAD-NTDL, MAD-NTD-like; DH, DpnI-HTH; DPUA, DCD-PUA; Pre7, Prereader7; and MADN, MAD-NTD. The tree was generated using IQtree with the Dayhoff amino-acid exchange rate matrix which is empirically determined as one of the best fits. Key branches with boot strap support greater than 90% are shown with a green dot. (b-e) The predicted structure of a PcdA hexamer showing views along (b-c) the hexamer axis, (d) a side view perpendicular the axis, and (e) a surface view revealing a potential binding cavity. PcdA structures were generated using AF2.
Extended Data Figure 4.
Extended Data Figure 4.. In vivo and in vitro characterization of various PcdA variants.
(a) Immunoblot using polyclonal antibodies against PcdA against cell extracts of WT, ΔpcdA, complemented ΔpcdA, or ΔpcdA complemented with indicated allele of pcdA. Strains: JE2, FRL60, FRL14, FRL34 – 41. (b) Purified (left) PcdA and (right) PcdAT* protein separated by PAGE and detected by Coomassie-stain. Molecular weight markers (MW) indicated to the left. (c) Circular dichroism spectra of purified (black trace) PcdA and (pink trace) PcdAT*.
Extended Data Figure 5.
Extended Data Figure 5.. Characterization of the PcdA-FtsZ interaction.
(a-b) Co-sedimentation of (a) PcdA or (b) PcdAT* with polymerized FtsZ in vitro in the presence of ATP. 30 μM FtsZ was incubated in the presence of 2 mM GMPCPP and 5 μM PcdA variant as indicated in the presence or absence of 4 μM ATP as indicated. FtsZ polymers were collected by high-speed ultracentrifugation. Presence of proteins in the supernatant (S) or pellet (P) was analyzed by SDS-PAGE and Coomassie staining. A representative image of three independent experiments is shown. The mean and standard deviation of the percentage of total FtsZ and PcdA in the pellet fraction is indicated below. (c) Protein complex model of a monomeric FtsZ (cyan) and PcdA (gold) predicted by AlphaFold-Multimer. A close-up section of the predicted interphase indicating residues R16, E31, and Q60 on PcdA may mediate the interaction with FtsZ.
Extended Data Figure 6.
Extended Data Figure 6.. Morphology of ΔdivIVA cells and subcellular localization of DivIVA-sGFP.
(a) Cellular area (μm2) of the indicated strains (n > 300 cells). Bars indicate mean; errors: S.D. Strains: JE2, FRL60, FRL98, and FRL96. (b) Subcellular localization of DivIVA-sGFP in the WT and ΔpcdA strains. First column: membranes stained with FM4-64 (pink); second column: DivIVA-sGFP (green); third column: overlay, membrane and DivIVA-sGFP. Scale bar: 1 μm. Strains: FRL113 and FRL114. (c) Individual cell eccentricities calculated for indicated strains of S. aureus at different stages of cell cycle (non-dividing, nascently dividing, nearly finished dividing). Bars indicate median; whiskers indicate interquartile range. Strains: JE2, FRL60, NE420, NE1598.
Extended Data Figure 7.
Extended Data Figure 7.. Minimum inhibitory concentration determination.
(a) Representative images of plates for MIC determination of cell wall-targeting antibiotics for the indicated strains. MIC was indicated by the intersection of the inhibition ellipse with the MIC strip. (b) Representative images of plates for MIC determination of antibiotics targeting other cellular process such as DNA metabolism (ciprofloxacin), protein synthesis (kanamycin), or cytoplasmic membrane (daptomycin).
Figure 1.
Figure 1.. Deletion of pcdA results in a cell division defect.
(a) Growth curves of WT (black), ΔpcdA (pink), and ΔpcdA complemented at an ectopic chromosomal locus with pcdA (green) in rich media in the absence (solid lines) or presence (dashed lines) of 200 ng ml−1 FtsZ inhibitor PC190723. Data points represent mean (n = 3); errors: S.D. OD600nm: optical density measured at 600 nm wavelength. (b) Cell sizes (calculated as area) of WT (gray), ΔpcdA (pink), or ΔpcdA complemented with pcdA (green) strains in the presence or absence of PC190723 (n > 700 cells from at least 3 independent cultures). Bars indicate mean; errors: S.D. Statistical analysis: Tukey’s multiple comparisons test; **** indicates p value < 0.001. (c-j”) Timelapse images of individual (c-f”) WT or (g-j”) ΔpcdA S. aureus cells stained with (c’-j’) membrane dye FM4-64, (c”-j”) fluorescently labeled wheat germ agglutinin (WGA-488) to visualize cell wall; (c-j) overlay, FM4-64 and WGA-488. Timepoint of imaging (min) indicated above each column. (k-l”) Representative static fluorescence micrographs of (k) WT and (l) ΔpcdA stained with WGA-488 and membrane dye FM4-64. WGA-488 was washed away and cells were allowed to divide for one round of cell division resulting in half cell staining. (k-l): overlay of WGA-488 and membranes; (k’-l’): membranes stained with FM4-64 (pink); (k”-l”): fluorescence from WGA-488 (green); Division planes are indicated with dashed lines. Asterisk indicates a ΔpcdA cell with misplacement of the second division plane. Scale bar: 1 μm. Strains: JE2 and FRL60 (strain genotypes listed in Extended Data Table 1). (m) Angle between consecutive division planes in WT (gray), ΔpcdA (pink), ΔpcdA complemented with pcdA (green), Δnoc (blue), or ΔpcdA Δnoc (red) strains. Bars indicate mean; errors: S.D. Strains: JE2, FRL60, FRL62, NE486, FRL67. Statistical analysis: Dunnett’s multiple comparisons test; **** indicates p < 0.0001. (n-o) Representative differential interference contrast (DIC) microscopy images of (n) WT or (o) ΔpcdA cells imaged after overnight growth in modified M63 medium on a coverslip. Size bar: 5 μm. Select representative clusters are outlined in red. (p) Quantification of aspect ratios of S. aureus clusters containing more than 3 cells imaged in (n-o) (n=214). Bars indicate median; errors: I.Q.R.; Statistical analysis: Unpaired t test, *** indicates p < .001.
Figure 2.
Figure 2.. PcdA belongs to the AAA+ family of NTPases.
(a-d) Cartoon representations of the (a-c) predicted AF2-generated structures of (a) full length PcdA, (b) EVE domain 1 of PcdA, and (c) McrB AAA+ domain of PcdA; and (d) crystal structure of Thermococcus gammatolerans McrB (PDB: 6UT3). Select residues mentioned in the text are marked. (e) Sequence logo displaying conservation of amino residues in indicated motifs of the AAA+ domains of PcdA and McrB orthologs. The height of each residue is scaled as per the bitscore of conservation in the MSA, measured using Shannon entropy. Red dots: key active site residues; green dots: other conserved sites.
Figure 3.
Figure 3.. PcdA is an early cell division protein that positively dictates FtsZ placement.
(a-b) Subcellular localization of PcdA-sGFP in (a) pre-divisional, (a’) nascently dividing, (a”) nearly divided, or (a”’) completely divided S. aureus cell, or (b) in anucleate ΔscpB mutant S. aureus cell (indicated with arrow). Columns (left to right): membranes visualized using FM4-64 (pink); PcdA-sGFP (green); nucleoid visualized using DAPI (cyan); overlay of membrane, nucleoid, and PcdA-sGFP. Schematic representation of PcdA localization (green: PcdA; pink: membrane) shown to the right. Strains: FRL28, FRL68. (c-g) Presence of anucleate cells in (c) WT, (d) ΔpcdA, (e) complemented ΔpcdA, (f) ΔscpB, and (g) complemented ΔscpB cells. Columns (left to right): membranes; nucleoid; overlay, membrane and nucleoid. Percentage of anucleate cells indicated to the right (n > 1000 cells). Strains: JE2, FRL60, FRL62, NE1085, FRL12. (h-l) Co-localization of FtsZ-mCherry and PcdA-sGFP in (h-i) nascently dividing, (j-k) nearly divided, or (l) completely divided S. aureus cells. Columns (left to right): membranes dyed with Mitotracker Deep Red (cyan); fluorescence from FtsZ-mCherry (pink); fluorescence from PcdA-sGFP (green); overlay, membrane, mCherry, and sGFP. Fluorescence from FtsZ-mCherry and PcdA-sGFP along the line scan in the fourth column is quantified on the right. Strain: FRL117. (m-q) Co-localization of FtsZ-sGFP and PcdA-mScarlet3 in (m-n) nascently dividing, (o-p) nearly divided, or (q) completely divided S. aureus cells. Columns (left to right): membranes dyed with Mitotracker Deep Red (cyan); fluorescence from FtsZ-sGFP (green); fluorescence from PcdA-mScarlet3 (pink); overlay, membrane, sGFP, and mScarlet3. In (h-q), redeployment of PcdA to the new cell division plane before FtsZ (arrows) or PcdA migration ahead of FtsZ during membrane constriction (arrowheads) indicated; fluorescence from FtsZ and PcdA fusions along the indicated line scan in the fourth column is quantified and displayed on the right. R.F.I.: relative fluorescence intensity. Scale bars: 1 μm. Strain: FRL134. (r-s) Localization of FtsZ-mCherry in (r) WT and (s) ΔpcdA strains. Columns (left to right): membranes visualized with TMA-DPH (cyan); FtsZ-mCherry (pink); overlay of membrane and FtsZ-mCherry. Scale bars: 1 μm. Arrows indicate cells where FtsZ-mCherry signal is soluble and not forming rings. Strains: FRL115 and FRL116.
Figure 4.
Figure 4.. PcdA ATPase activity is necessary for its function and localization.
(a) Cellular area (μm2) of the indicated strains (n > 300). Bars indicate mean; errors: S.D. Strains: JE2, FRL60, FRL14, FRL34 – 41. Statistical analysis: Dunnett’s multiple comparisons tests; **** indicates p < 0.0001. (b) Localization of PcdA-sGFP and variants. First row: membranes (pink) stained with FM4-64; second row: PcdA-sGFP (green); third row: overlay, membrane and sGFP. Below, localization of PcdA was quantified as correct localization (constricting ring as septation occurs; fourth row), non-constricting ring (fifth row), mis-localized in all membranes (sixth row), or cytosolic localization (seventh row). Percentage of each type of localization are indicated for each protein variant (n > 300). Strains: FRL28, FRL44 – 51. (c) Nucleotide hydrolysis rate of PcdA. 2.5 μM PcdA was incubated with increasing concentration of ATP, GTP, CTP, or UTP (0, 0.25, 0.5, 1, 2, and 4 mM). NTP hydrolysis was quantified by the release of inorganic phosphate. Errors: S.E.M. (n = 5 independent experiments). (d) ATP hydrolysis rate for wild type PcdA and PcdAT*. 2.5 μM of each variant was incubated with increasing concentrations of ATP (0, 0.25, 0.5, 1, 2, and 4 mM). Errors: S.E.M. (n = 3 independent experiments). (e) Multimerization of PcdA and mutated variants measured by bacterial two-hybrid assay. The interaction of the proteins produced by the T18 and T25 plasmids cloned in a cyaA deficient E. coli was measured as β-galactosidase activity in liquid cultures. The protein variant fused to the N-terminus of T18 and T25 is indicated. A pair of non-fused T18 or T25 together with their corresponding fusion protein was used as a control and the resulting activity from the control was used to subtract to the tested interaction. Bars represent mean; whiskers represent S.D. (n = 3 independent experiments).
Figure 5.
Figure 5.. PcdA interacts with FtsZ and DivIVA.
(a-b) Coomassie-stained SDS-PAGE of (a) FtsZ and/or PcdA incubated ±GMPCPP or (b) ±ATP. (a) Supernatant (S) or pellet (P) after ultracentrifugation. (b) Flowthrough (F) or retentate (R) after filter centrifugation. Mean percentages of FtsZ and PcdA (a) in pellet or (b) retained is indicated below (n=3 independent experiments; error: S.D.). (c) Localization of PcdA and PcdAFtsZ*. Fluorescence from sGFP (green); membranes (pink); overlay, sGFP and membrane. Right: PcdA localization quantified (percentage of total, n > 400) as (left to right): correct localization, non-constricting ring, membrane mis-localized, or cytosolic localization. Strains: FRL103, FRL84. (d) Angle between consecutive division planes. Bars: mean; errors: S.D. (n > 100 cells). Statistical analysis: Dunnett’s multiple comparisons test; **** indicates p < 0.0001. Strains: JE2, FRL60, FRL62, FRL83, FRL96, FRL98. Statistical analysis: Kruskal-Wallis; **** indicates p < 0.0001. (e) Localization of FtsZ-mCherry in the presence of pcdA or pcdAFtsZ*. Membranes (cyan); FtsZ-mCherry (pink); overlay, membrane and mCherry. Arrows indicate cytosolic FtsZ-mCherry. Scale bar: 2 μm. Strains: FRL115, FRL135. (f) PcdA interaction with cell division proteins by bacterial two-hybrid. Bars: mean; errors: S.D (n = 3 independent replicates). (g) Co-immunoprecipitation of (top) DivIVA-FLAG, or (bottom) DivIVA with PcdA using anti-FLAG antibodies detected by immunoblotting. T: Total extract; FT: flow through; W1-W5: washes; E1-E2: elution. Strains: FRL137, JE2. Unspecific adsorption of S. aureus Protein A is indicated. (h) Localization of DivIVA-sGFP in pre-divisional, dividing, or nearly divided S. aureus cells. Scale bar: 1 μm. Strain: FRL113. (i) Localization of PcdA-sGFP in WT and ΔdivIVA. Membranes (pink); DivIVA-sGFP or PcdA-sGFP (green); overlay, membrane and sGFP. Right: Percentage of each type of indicated localization pattern (n > 300). Scale bars: 1 μm. Strains: FRL103, FRL97. (j) Angle between consecutive division planes. Bars: mean; errors: S.D. (n > 200 cells). Statistical analysis: Dunnett’s multiple comparisons tests; **** indicates p < 0.0001. Strains: JE2, FRL60, NE420, NE1598. (k) Model for cell division plane selection. DivIVA (yellow) initially localizes indiscriminately in the membrane; PcdA (green) localizes to the future cell division plane and recruits FtsZ (blue). During septation, DivIVA localizes to the base of the septum; PcdA follows the leading edge of the septum. As cytokinesis completes, a population of DivIVA deploys to the poles of the elongated cell and recruits PcdA, which defines the next division plane.
Figure 6.
Figure 6.. Deletion of pcdA impairs virulence and leads to increased sensitivity to cell wall-targeting antibiotics.
(a) Quantification of abscesses 5- and 15- days post infection. Mice were inoculated with WT or ΔpcdA strain. Mice were sacrificed after 5 or 15 days, and the number of abscesses present in the kidneys was determined. Number is plotted as the mean from 5 animals per group. (b-c) Histopathology of kidneys of mice inoculated with (b) JE2 wild type and (c) ΔpcdA. Pathological section was stained with hematoxylin and eosin (H&E). Scale bar: 1 mm. (b’-c’) Close-up lesions resulting from infection with (b’) WT and (c’) ΔpcdA cells. Lesions are traced by yellow dotted line; arrows point to S. aureus cells growing inside the lesion. Scale bar: 500 μm. (d) Percentage of lesions with or without bacteria in kidneys of mice inoculated with WT or ΔpcdA cells. Data points represent a single kidney from a single mouse; bars indicate mean; statistical analysis: two-way Anova; ** indicates p < 0.01. (e-f) Growth curves of WT and ΔpcdA cells (black and pink traces, respectively) in (e) RPMI or (f) modified M63 medium buffered at indicated pH. Bars: mean; errors: S.E.M. (n=3 independent cultures). Strains: JE2 and FRL60. (g) Indicated serial dilutions of E. coli, or WT and ΔpcdA S. aureus cultures incubated in 40% pooled human complement serum (rows 2, 4, 6) or heat-inactivated serum (rows 1, 3, 5) for 1 h at 37 ºC. Strains: E. coli MG1655, S. aureus JE2 and FRL60. (h) Percent survival of strains indicated (g) after exposure to pooled human complement serum. Data points represent independent cultures; bars indicate mean; errors: S.D. (i-j) Minimal inhibitory concentrations (MIC) for WT and ΔpcdA strains for indicated antibiotics that (i) target the cell wall or (j) do not target the cell wall. MIC was determined in lawns of bacteria using MIC strips for the indicated antibiotic. Data points represent independent measurements; bars indicate mean; errors: S.E.M. Strains: JE2 and FRL60. **** indicates p < 0.0001; ** indicates p < 0.01; * indicates p < 0.1.

Update of

References

    1. Barrows JM & Goley ED FtsZ dynamics in bacterial division: What, how, and why? Curr Opin Cell Biol 68, 163–172, doi: 10.1016/j.ceb.2020.10.013 (2021). - DOI - PMC - PubMed
    1. Ramos-Leon F & Ramamurthi KS Cytoskeletal proteins: lessons learned from bacteria. Phys Biol 19, doi: 10.1088/1478-3975/ac4ef0 (2022). - DOI - PubMed
    1. Mahone CR & Goley ED Bacterial cell division at a glance. J Cell Sci 133, doi: 10.1242/jcs.237057 (2020). - DOI - PMC - PubMed
    1. Lutkenhaus J & Du SE coli Cell Cycle Machinery. Subcell Biochem 84, 27–65, doi: 10.1007/978-3-319-53047-5_2 (2017). - DOI - PubMed
    1. Errington J & Wu LJ Cell Cycle Machinery in Bacillus subtilis. Subcell Biochem 84, 67–101, doi: 10.1007/978-3-319-53047-5_3 (2017). - DOI - PMC - PubMed

LinkOut - more resources