. 2024 Dec;21(12):1474-1490.
doi: 10.1038/s41423-024-01229-8. Epub 2024 Oct 28.

Glut3 promotes cellular O-GlcNAcylation as a distinctive tumor-supportive feature in Treg cells

Affiliations

Glut3 promotes cellular O-GlcNAcylation as a distinctive tumor-supportive feature in Treg cells

Amit Sharma et al. Cell Mol Immunol. 2024 Dec.

Abstract

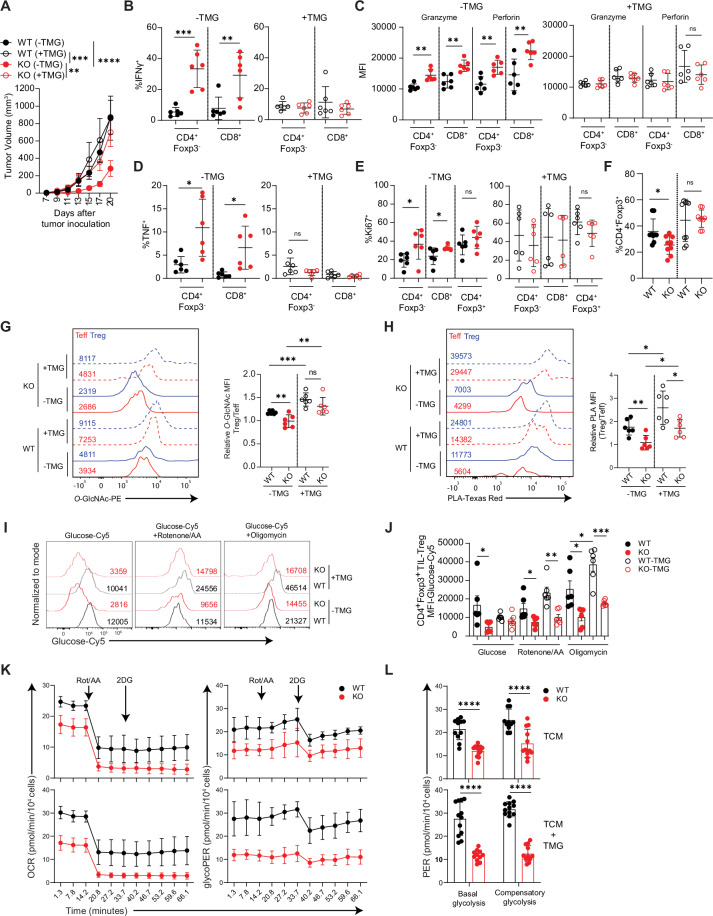
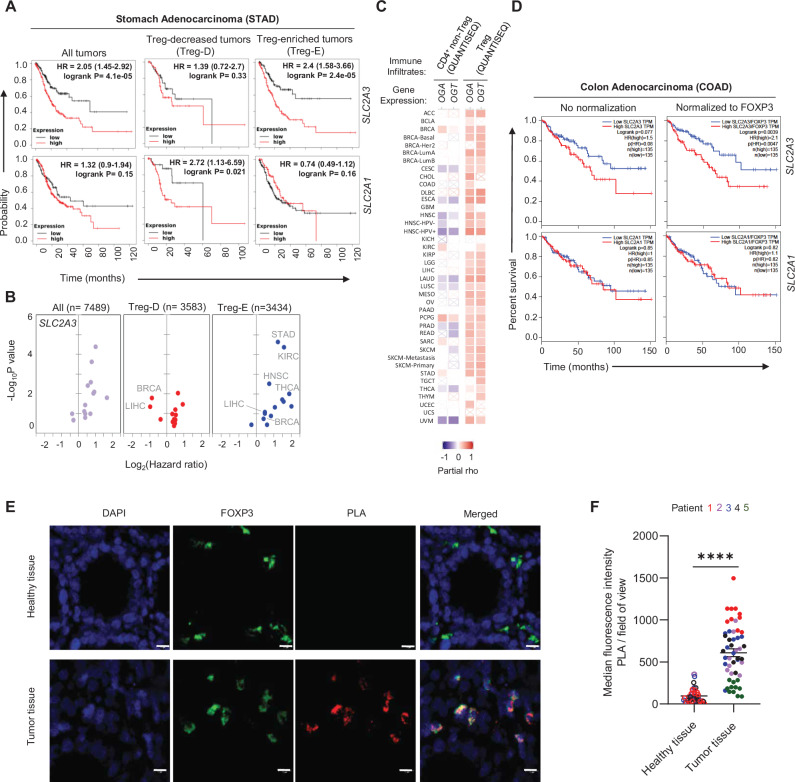
Regulatory T cells (Tregs) establish dominant immune tolerance but obstruct tumor immune surveillance, warranting context-specific mechanistic insights into the functions of tumor-infiltrating Tregs (TIL-Tregs). We show that enhanced posttranslational O-linked N-acetylglucosamine modification (O-GlcNAcylation) of cellular factors is a molecular feature that promotes a tumor-specific gene expression signature and distinguishes TIL-Tregs from their systemic counterparts. We found that altered glucose utilization through the glucose transporter Glut3 is a major facilitator of this process. Treg-specific deletion of Glut3 abrogates tumor immune tolerance, while steady-state immune homeostasis remains largely unaffected in mice. Furthermore, by employing mouse tumor models and human clinical data, we identified the NF-κB subunit c-Rel as one such factor that, through Glut3-dependent O-GlcNAcylation, functionally orchestrates gene expression in Tregs at tumor sites. Together, these results not only identify immunometabolic alterations and molecular events contributing to fundamental aspects of Treg biology, specifically at tumor sites but also reveal tumor-specific cellular properties that can aid in the development of Treg-targeted cancer immunotherapies.

Keywords: Glut3; O-GlcNAcylation; Regulatory T cells; Treg; Treg metabolism.


Conflict of interest statement

Competing interests: Garima Sharma is an employee of ImmunoBiome Inc, South Korea. SHI is the founder and major shareholder of ImmunoBiome Inc, South Korea. SML is an employee of Lipidall Technologies Company Limited, China. The authors have no conflicting financial interests.

Figures

Fig. 1
Fig. 1
Slc2a3 deletion does not affect the function or homeostasis of Treg cells at steady state or under inflammatory conditions. A Scheme for the generation of the conditional allele of mouse Slc2a3. B IGV tracks showing the expression of loxP flanking exon 2 and exon 3 transcripts in Tregs from Slc2a3+/+Foxp3IRES-Cre (WT) and Slc2a3f/fFoxp3IRES-Cre (KO) mice as analyzed by RNA sequencing. C Cellularity of peripheral lymphoid organs in young (8-week-old) and aged (36-week-old) WT and KO mice. D Tabulation of activated (top) and proliferating (middle) CD4+Foxp3- T cells and proliferating CD8+ T cells (bottom) in the peripheral lymphoid organs of young and aged WT and KO mice. E Frequencies of respective cytokine-producing non-Treg T cells from the peripheral lymphoid organs of young and aged WT and KO animals. F Representative histogram and frequency of Tregs in the peripheral lymphoid organs of young and aged WT and KO animals. G Activation (top) and proliferation (bottom) of Tregs in the peripheral lymphoid organs of young and aged WT and KO mice. H Representative flow cytometry histograms depicting the frequency of Tregs expressing Treg functional markers among KO and WT Tregs. I, J 72 hr in vitro suppression assay with KO and WT Tregs. Representative histograms depicting the proliferation of responder cells (dilution of CTV) (I) and a chart showing the dilution of the CTV MFI in responder cells (J) at different ratios of Treg and responder cells. K Progression of experimental autoimmune encephalomyelitis (EAE), as assessed by disease score, in WT and KO mice. L Body weight changes in mice adoptively transferred with Treg cells in a model of T-cell transfer-induced colitis. Rag1-/- recipient mice were subjected to adoptive transfer of CD45RBhi T cells. “WT Tregs” and “KO Tregs” indicate that CD45RBhi T cells were cotransferred with sorted CD4+YFP+ Tregs sorted from WT and KO mice, respectively. “No Tregs” indicates that the recipient mice were adoptively transferred with CD45RBhi T cells alone. The results are pooled from two to three (CM) independent experiments. The data are presented as the means ± SDs (C–G and J) and means ± SEMs (K, L). The values on the flow cytometry histograms represent the respective frequencies of the cells (F, H, and I). ns, nonsignificant; P values are derived by unpaired Student’s t test, two-tailed (BE, I)
Fig. 2
Fig. 2
Glut3 specifically enhances the protumor response of tumor-infiltrating Tregs and modulates their transcriptomic landscape. A B16F10 melanoma growth in Slc2a3+/+Foxp3IRES-Cre (WT) and Slc2a3f/fFoxp3IRES-Cre (KO) mice. B CD8+/CD4+ T-cell ratios in the spleen (Sp) and tumors (TIL) on day 23 postinoculation in the mice described in (A). C, D Percentages of proliferating (Ki67+) non-Treg CD4+ (C) and CD8+ (D) T cells in the spleens and tumors of the mice described in (A). E Frequency of IFNγ-producing splenic and tumor-infiltrating (TIL) CD8+ T cells in the mice described in (A). F, G Gene ontology analysis of B16F10 melanoma TIL CD8+ T cells and CD4+Foxp3- cells in KO mice. H Differential gene expression (DGE) of select immune response genes in KO TIL CD8+ and CD4+Foxp3- T cells. I Representative FACS plot (top) and frequency (bottom) of splenic and B16F10 melanoma TIL-Tregs in WT and KO mice. J Overall change in gene expression in control and tumor-bearing (TBM) splenic and TIL-Tregs upon Slc2a3 deletion. The numbers within the bar graphs represent the total number of genes affected. K Changes in the expression of representative tumor-infiltrating Treg (TITR) signature gene set genes in the spleen and TIL-Tregs of the KO mice compared with the WT mice. L CDF analysis of TITR signature gene set expression in the spleen and TIL-Tregs of the KO mice. M Heatmap depicting the expression of select NF-κB target genes in TIL-Tregs from WT and KO mice. N KEGG pathway analysis of genes downregulated in KO TIL-Tregs. O CDF analysis of NF-κB target gene set expression in splenic and TIL-Tregs from KO mice compared with WT mice. Changes in the expression of select NF-κB target genes specifically downregulated in KO TBM splenic Tregs. The results are pooled from three (A) or two (BE, I) independent experiments or are from three pooled samples (JP). The data are presented as the means ± SEMs (A) and means ± SDs (BE, I). NE, not expressed. ns, nonsignificant, *P < 0.05, **P < 0.01, ***P < 0.001, and ****P < 0.0001; P values are derived from two-way ANOVA (A), unpaired two-tailed Student’s t-test (BE, I), the Wald test (DESeq2) (H, K, P), and the Kolmogorov‒Smirnov test (L, O)
Fig. 3
Fig. 3
Glut3 expression enhances global protein O-GlcNAcylation in activated Tregs. A Representative flow cytometry histogram (top) and statistical analysis (bottom) of the global O-GlcNAcylation of DT-aTr in Foxp3IRES-GFP-DTR mice. B Scheme for in vivo activation of Tregs from Slc2a3f/fFoxp3IRES-Cre and littermate control mice (top), gating strategy (middle) and global O-GlcNAcylation in activated Tregs (bottom). C Scheme of O-GlcNAcase inhibitor Thiamet-G (TMG) treatment (top) and kinetics of tumor growth (bottom) in B16F10 melanoma-implanted wild-type mice treated with (+TMG) or without TMG (-TMG). D Representative plots and tabulation of global O-GlcNAcylation in splenic and TIL-Tregs and CD4+Foxp3- effector T cells (Teff) from melanoma-bearing WT mice. EJ Relative amounts of pyruvate (E), lactate (F), malate (G), citrate (H), sedoheptulose 7 phosphate (I), and UDP-GlcNAc (J) derived from 13C6-glucose in WT or KO iTregs as assessed via 13C6 isotope tracing. The results are pooled from two independent experiments (A, C-J) or are representative of two independent experiments (B). The data are presented as the means ± SEMs (B) Mean ± SD (EJ). The values on the flow cytometry histograms represent the respective MFIs (A, B, D). ns, not significant, *P < 0.05, **P < 0.01. P values were derived via paired two-tailed t-tests (A, D), unpaired two-tailed t-tests (B), two-sided Dunn’s tests (E-J), or two-way ANOVA (C)
Fig. 4
Fig. 4
Glut3-dependent O-GlcNAcylation in TIL-Tregs supports tumor growth. A B16F10 melanoma growth in KO and WT mice treated with TMG (+ TMG) or PBS (-TMG). BD Production of the effector cytokines IFNγ (B), Granzyme B and perforin (C), and TNF (D) by in vitro restimulated TIL CD4+Foxp3- and CD8+ T cells with or without TMG treatment in KO and WT mice. E Ki67 expression in TIL T cells, as a measure of proliferation, upon TMG treatment in KO and WT mice. F Frequency of TIL-Tregs in melanoma-bearing mice treated as described in (A). G Representative flow cytometry histograms (left) and relative changes in the O-GlcNAc MFI of TIL Tregs compared with Teff cells (right). H Representative flow cytometry histograms (Left) and relative change in the c-Rel–O-GlcNAc PLA MFI of TIL Tregs compared with that of Teff cells (Right). I, J Representative flow cytometry histogram and quantification of glucose-Cy5 uptake in WT and KO TIL-Tregs, with or without TMG treatment, and upon blockade of mitochondrial respiration (rotenone/antimycin A) or oxidative phosphorylation (oligomycin). BJ Experiments were performed on cells isolated from similar-sized tumors by advancing tumor inoculation by one week in untreated KO animals. Oxygen consumption rate (K, left panel), glycolytic proton efflux rate (K, right panel) and quantification (L) upon metabolic flux analysis of iTregs generated in 80% TCM with or without TMG treatment. The results are pooled from two to four (AL) independent experiments. The data are presented as the means ± SEMs (A, J) or means ± SDs (BH, L). The values on the chart represent the MFI (GI). ns, nonsignificant, *P < 0.05, **P < 0.01, ***P < 0.001, and ****P < 0.0001. P values were obtained with two-way ANOVA (A) and unpaired two-tailed Student’s t-test (B-J, L)
Fig. 5
Fig. 5
Slc2a3 deficiency alters the NF-κB transcriptional landscape in tumor-infiltrating Tregs. A Heatmap showing the expression of genes encoding NF-κB target genes and TITR gene sets upregulated in KO TIL-Tregs upon TMG treatment. B TMG-mediated changes in the expression of 51 NF-κB target genes whose expression was significantly altered in both the KO and WT TIL-Tregs. C CDF analysis of the expression of the ‘expressed’ subset of NF-κB target genes in TIL-Tregs sorted from B16F10 tumors with or without TMG treatment, as assessed by RNA-seq. DG Venn diagrams depicting the overlap of DGE gene sets from the indicated sample groups. The results are from two pooled samples (AG). ns, nonsignificant, *P < 0.05, **P < 0.01, ***P < 0.001, and ****P < 0.0001. P values were obtained with an unpaired two-tailed Student’s t-test (B) or the Kolmogorov‒Smirnov test (C)
Fig. 6
Fig. 6
Human colon adenocarcinoma-infiltrating Tregs enhance c-REL O-GlcNAcylation. A Kaplan–Meier (KM) plot of human stomach adenocarcinoma (STAD) patients depicting the probability of survival in tumors (all tumors, all available data analyzed; Treg-decreased tumors (Treg-D), Treg-enriched (Treg-E), exhibiting high or low expression of SLC2A3 (top) or SLC2A1 (bottom)). B Volcano plots depicting the associations of SLC2A3 expression and Treg enrichment with the hazard ratio in multiple human cancers. Each dot represents the individual cancer type for which data are available. C Heatmap showing the gene expression of the O-GlcNAc transferase (OGT) and O-GlcNAcase (OGA) enzyme pairs in human tumors analyzed via the TIMER 2.0 QUANTISEQ algorithm. D KM plots showing survival time in human colon adenocarcinoma patients expressing SLC2A3 or SLC2A1. SLC2A3 and SLC2A1 expression was normalized to that of FOXP3 (right panels). Representative confocal micrograph (E) and MFI analysis (F) of c- REL and O-GlcNAc PLA in human colon adenocarcinoma and healthy tissue sections. The average PLA MFI of Tregs per field of view (total 10–11 views per section) is shown (F). Plots were generated via KM plotter (https://kmplot.com/analysis/) (A), TIMER2.0 (http://timer.cistrome.org/) (C) or GEPIA2 (http://gepia2.cancer- pku.cn/#index) (D). The results are from five patients (F). The data are presented as the means ± SEMs (F). The log rank P values are presented in the charts (A, D). ****P < 0.0001; P values are derived with the Mantel‒Cox log rank test (A, D) or Mann‒Whitney two-tailed t-test (F). Scale bars: 10 µm

References

    1. Josefowicz SZ, Lu LF, Rudensky AY. Regulatory T cells: mechanisms of differentiation and function. Annu Rev Immunol. 2012;30:531–64. - PMC - PubMed
    1. Tanaka A, Sakaguchi S. Targeting Treg cells in cancer immunotherapy. Eur J Immunol. 2019;49:1140–6. - PubMed
    1. Liu C, Chikina M, Deshpande R, Menk AV, Wang T, Tabib T, et al. Treg Cells Promote the SREBP1-Dependent Metabolic Fitness of Tumor-Promoting Macrophages via Repression of CD8(+) T-Cell-Derived Interferon-gamma. Immunity. 2019;51:381–97.e6. - PMC - PubMed
    1. Bos P, Rudensky A. Transient regulatory T-cell ablation deters oncogene driven breast cancer and enhances radiotherapy. J Exp Med. 2013;210:2435–46. - PMC - PubMed
    1. Klages K, Mayer CT, Lahl K, Loddenkemper C, Teng MW, Ngiow SF, et al. Selective depletion of Foxp3+ regulatory T cells improves effective therapeutic vaccination against established melanoma. Cancer Res. 2010;70:7788–99. - PubMed

LinkOut - more resources