. 2024 Dec;25(12):5478-5506.
doi: 10.1038/s44319-024-00297-1. Epub 2024 Oct 28.

Phosphorylation of P-stalk proteins defines the ribosomal state for interaction with auxiliary protein factors

Affiliations

Phosphorylation of P-stalk proteins defines the ribosomal state for interaction with auxiliary protein factors

Kamil Filipek et al. EMBO Rep. 2024 Dec.

Abstract

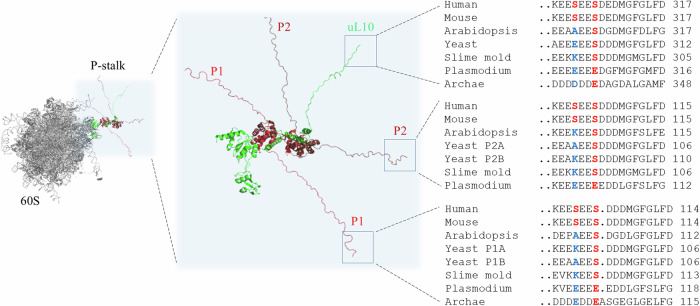
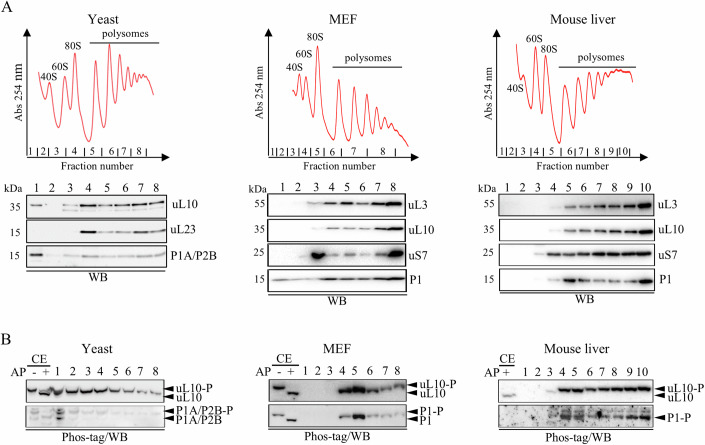
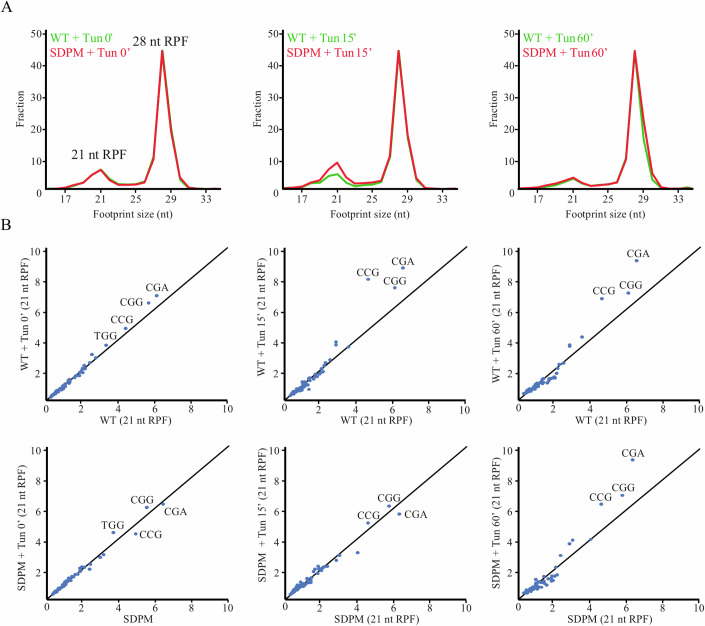
Ribosomal action is facilitated by the orchestrated work of trans-acting factors and ribosomal elements, which are subject to regulatory events, often involving phosphorylation. One such element is the ribosomal P-stalk, which plays a dual function: it activates translational GTPases, which support basic ribosomal functions, and interacts with the Gcn2 kinase, linking the ribosomes to the ISR pathway. We show that P-stalk proteins, which form a pentamer, exist in the cell exclusively in a phosphorylated state at five C-terminal domains (CTDs), ensuring optimal translation (speed and accuracy) and may play a role in the timely regulation of the Gcn2-dependent stress response. Phosphorylation of the CTD induces a structural transition from a collapsed to a coil-like structure, and the CTD gains conformational freedom, allowing specific but transient binding to various protein partners, optimizing the ribosome action. The report reveals a unique feature of the P-stalk proteins, indicating that, unlike most ribosomal proteins, which are regulated by phosphorylation in an on/off manner, the P-stalk proteins exist in a constantly phosphorylated state, which optimizes their interaction with auxiliary factors.

Keywords: Gcn2 Kinase; Phosphorylation; Ribosomal Proteins; Ribosomal Stalk; Ribosome.


Conflict of interest statement

Disclosure and competing interests statement. The authors declare no competing interests.

Figures

Figure 1
Figure 1. Structural representation of the ribosomal P-stalk with the C-terminal amino acid alignment.
The left panel shows the structural model of the 60S ribosomal subunit from H. sapiens (PDB: 4V6X) with the ribosomal P-stalk proteins complex (boxed). The P-stalk proteins are indicated as follows: uL10—green, P1—red, P2—brown, shown as a cartoon representation. Middle panel, zoom-in on the P-stalk pentameric structure; the structure represents compilation of the data for the 60S subunit (PDB: 4V6X for uL10) and P1/P2 dimer (PDB: 4BEH) with the C-terminal motif involved in ligand binding indicated in boxes. The right panel shows amino acid alignments of the C-terminal motifs of the uL10 protein (top), P2 (middle) and P1 (bottom); human - Homo sapiens (uL10—accession number #P05388, P1—#P05386, P2—#P05387), mouse - Mus musculus (uL10—#P14869, P1—#P47955, P2—#P99027), Arabidopsis, Arabidopsis thaliana (uL10—#O04204, P1—#Q8LCW9, P2—#P51407), Yeast, Saccharomyces cerevisiae (uL10—#P05317, P1A—#P05318, P1B—#P10622, P2A—#P05319, P2B—#P02400), Slime mold, Dictyostelium discoideum (uL10—#P22685, P1—#P22684, P2—#P22683), Plasmodium, Plasmodium falciparum (uL10—#Q94660, P1—#Q8IIX0, P2—#O00806), Archaea - Haloarcula marismortui (uL10—#P15825, P1—#P15772). The sequences of the P-stalk proteins were retrieved from the UniProt database. The numbers on the right side of the alignment represent total numbers of amino acid residues in the proteins. The amino acid residues marked in red show the position of serine residues that are phosphorylated by the CK2 kinase; in other species one serine can be substituted with alanine, glutamic acid, or lysine, shown in blue.
Figure 2
Figure 2. Quantification of P-stalk phosphorylation in yeast and MEF cell line.
Immunoblot analyses of the total cell extracts (A) or total ribosome fractions (B). The electrophoretic mobility of phosphorylated proteins is changed upon treatments by phos-tag. In addition to the yeast WT strain, the SDPM mutant was used that lacks phosphorylation sites. (A) left panel: line 1, yeast cell extract treated with CK2 kinase (CK2+) lane 2, yeast cell extract treated with phosphatase (AP+); lane 3, untreated cell extract from the WT strain; lane 4, extract from SDPM strain. Right panel: lanes 1, 2, and 3, MEF cell extracts treated with: AP, CK2 and untreated, respectively. (B) Total ribosomal fraction from yeast cells. Lanes 1, 2, 3: ribosomes treated with AP, CK2 and untreated, respectively; line 4, ribosomes from SDPM strain. Right panel: total ribosomes from MEF cell line. Lanes 1, 2 and 3, AP- or CK2-treated and untreated, respectively. The P-stalk proteins were detected using specific antibodies recognizing yeast uL10 and P1A/P2B proteins or human uL10 and P1 proteins. Black arrows show the position of dephospho- and phospho-forms of the P-stalk proteins unmarked and marked with (P), respectively. Source data are available online for this figure.
Figure 3
Figure 3. Phosphorylation of P-stalk proteins in 60S subunits, 80S monosomes and polysomes.
(A) Polysome profiles obtained from yeast, MEF cells and mouse liver cells (upper panel). The position of 40S, 60S, 80S and polysomes is indicated. The P-proteins and marker ribosomal proteins were visualized by immunoblotting (lower panel). (B) Phos-tag analysis of protein phosphorylation. Alkaline phosphatase treated (+AP) cell extracts (CE) were used to determine position of phosphorylated (−AP, upper band) and dephosphorylated (+AP, lower band) forms of P-proteins. Bands corresponding to both forms are marked with arrows. Source data are available online for this figure.
Figure 4
Figure 4. Analysis of the phosphorylation state of P-stalk proteins bound to ribosomes in yeast and MEF fractions.
(A) Polysome profiles obtained from yeast and MEF cells upon alkaline phosphatase (AP) treatment. The position of 40S, 60S, 80S and polysomes is indicated. (B) Phos-tag analysis of the P-proteins within each fraction. Corresponding fractions from non-treated (−AP) and treated (+AP) samples were loaded back-to-back for better comparison. The positions of P-proteins are indicated by arrows. Alkaline phosphatase-treated cell extracts (CE; +AP) were used as control to determine the electrophoretic mobility of dephosphorylated proteins. Source data are available online for this figure.
Figure 5
Figure 5. Effect of phosphorylation on the interaction of P-stalk proteins with trGTPases.
(A) Binding affinity of eIF5B to phospho P-stalk (green) or dephospho P-stalk (blue) estimated by MST. The P-stalk complex was titrated with the excess of eIF5B. Data presented as mean ± SEM of n = 3, technical replicates. Inset, equilibrium dissociation constants (Kd): 4.5 ± 0.8 μM, 11 ± 2 μM, respectively. (BD) GTPase activity of eIF5B (B), eEF1A (C), and eEF2 (D) in the presence of 80S ribosomes from WT (red) or SDPM (blue) strains or in the absence of the ribosomes (gray). Data are presented as mean ± SEM of n = 3, biological replicates. The average GTPase rates were 0.008 ± 0.001 min−1 with WT and 0.020 ± 0.002 min−1 with SDPM ribosomes for eIF5B (B); 0.008 ± 0.001 min−1 with WT and 0.019 ± 0.003 min−1 with SDPM ribosomes for eEF1A (C); and 0.019 ± 0.003 min−1 with WT and 0.044 ± 0.004 min−1 with SDPM ribosomes for eEF2 (D). Source data are available online for this figure.
Figure 6
Figure 6. Translation elongation on ribosomes from the WT and SPDM strains.
(A) Dipeptide (Met-Phe) formation monitored upon rapidly mixing initiation complexes (80S IC) using ribosomes from the WT (red line) and SDPM (blue line) yeast cells, with ternary complexes eEF1A–GTP–[14C]Phe-tRNAPhe in a quench-flow apparatus. The extent of peptide formation was analyzed by HPLC and radioactivity counting. Data are normalized to Met-Phe formation with the maximum value in the dataset set to 1 and presented as mean ± SEM of n = 3 biological replicates; the average rate is 0.23 ± 0.14 s−1 and 0.19 ± 0.10 s−1 for WT and SDPM, respectively. (B) Tripeptides (Met-Phe-Val) formation monitored upon rapidly mixing 80S ribosomes from WT and SDPM cells carrying MetPhe-tRNAPhe (80S 2 C) with ternary complexes eEF1A–GTP–[14C]Phe-tRNAPhe. Data are presented as mean ± SEM of n = 3, biological replicates; the average rate is 0.34 ± 0.13 s−1 and 0.22 ± 0.05 s−1 for WT and SDPM, respectively. Source data are available online for this figure.
Figure 7
Figure 7. Translational fitness of WT and SDPM yeast strains in vivo.
(A) Kinetics of [35S]methionine incorporation into newly synthesized polypeptides for wild type (♦) and SDPM (◯) cells. Error bars represent ±SD, n = 3, technical replicates. (B) Ribosome half-transit times, t½. The incorporation of [35S]methionine into total proteins (nascent and completed) (filled symbols) and completed proteins (open symbols) is shown for each strain. The half-transit time was measured as the displacement between two lines by linear regression analysis and is shown in each panel as an inset. The t½ values are means ± SD, n = 3, technical replicates. (C) Polysome profiles of WT and SDPM strains after CHX treatment. The polysome-to-monosome (P/M) ratio was calculated by dividing the area of the first four polysomal peaks by the area of the peak for the 80S monosome; P/M value is presented as means ± SD, n = 3, technical replicates. The positions of individual ribosomal subunits are indicated. Source data are available online for this figure.
Figure 8
Figure 8. The relative abundance of 21 nt and 28 nt RPF and specific codon occupancies within 21 nt RPF in steady-state conditions and upon Tun treatment.
(A) The relative abundance of 21 nt and 28 nt RPF in the course of Tun treatment of WT (green) and SDPM (red). (B) The correlation of specific codon occupancies within 21 nt RPF, corresponding to part A. Specific overrepresented codons CGA, CGG for arginine and CCG for proline are indicated. Source data are available online for this figure.
Figure 9
Figure 9. Ribosome-dependent eIF2α phosphorylation and Gcn2 association with the ribosomes.
(A) eIF2α phosphorylation after Tun-induced ER-stress probed with specific anti-phospho-eIF2α antibodies; GAPDH was used as loading control. Left panel, time course of phosphorylation. Right panel, quantification of eIF2α phosphorylation relative to GAPDH loading control, normalized to non-treated cells. Error bars represent SD *p < 0.05; **p < 0.001, determined by Student’s t-test, n = 4, biological replicates. (B) Gcn2 binding to the ribosomes. Top panel, polysome profiles from non-treated (−Tun) and Tun-treated (+Tun) (2.5 μg/ml of tunicamycin for 2 h) WT and SDPM yeast cells. Lower panel, Western blot analysis with antibodies against Gcn2 kinase and uL10 ribosomal protein. Fractions from control and Tun exposed cells are marked with −/+. Source data are available online for this figure.
Figure 10
Figure 10. MD simulation of structures of the unphosphorylated and phosphorylated forms of P-stalk C-terminal peptides.
(AC) Representative structures of the most populated clusters from the MD simulation of the human, yeast and archaeal P1 proteins, respectively. Insets in (A) and (B) display the representative structures of the most populated clusters from the MD simulation of the unphosphorylated P1-proteins, respectively. The right panels in (A), (B), and (C) present free energy landscape plots of C-termini peptides folding in unphosphorylated and phosphorylated state. The bottom panels in (A), (B), and (C) depict C-termini peptide secondary structure transitions over time during the MD simulations.
Figure EV1
Figure EV1. Meta-analysis of CTD P-stalk protein phosphorylation in mammalian cells using mass spectrometry data implemented in the PeptideAtlas database.
The nested pie charts show the identified peptides of the P1/P2 (left chart) and uL10 (right chart) proteins. The upper, blue part of the plots represents the observation from the entire Human Proteome 2022-01 assembly. The lower, green part of the plots shows the results from the Human Phosphoproteome 2022-04 build. The Human Phosphoproteome 2022-04 contains only phosphorylated P1/P2 and uL10 proteins. The complete Human Proteome 2022-01 includes the observation for non-phosphorylated P-stalk proteins. The total number of peptide observations is shown in the outer ring of the plots. The inner ring shows the number of results with different patterns of serine residue phosphorylation. The higher the number of observations, the darker the color (blue or green). The lower panel shows the identified peptides within the two datasets, 2022-01 and 2022-04 builds, in the corresponding colors; phosphorylation site is marked with [p].
Figure EV2
Figure EV2. Purification of phosphorylated (native) and unphosphorylated (AP-treated) P-stalk complexes and 80S ribosomal particles from WT and SDPM mutant strains.
(A) Schematic representation of the genetically engineered ribosomal particles with the P-stalk scheme. Specific thrombin cleavage site and 6xHis-tag used for P-stalk release and subsequent purification are indicated with arrows. (B) SDS-PAGE analysis of purified native (-AP) and dephosphorylated (+AP) stalk complexes. The positions of ΔuL10 and P1A/P2B/P1B/P2A are pointed with arrows. (C) Phos-tag analysis of purified 80S ribosomal particles; 80S WT - ribosomes from WT strain, 80S SDPM - ribsomes from SDPM mutant strain harboring S to A mutations within all P-protein; anti-uL10 and anti-P1A/P2B antibodies were used. (D) Native mass spectroscopy analysis (native-MS) of purified intact P-stalk complexes; left and right panels, MS spectra of the complexes of WT and +AP, respectively; numbers next to the peaks indicate the charge states of the complexes; molecular masses of the P-stalk complexes were calculated by MaxEnt deconvolution software (Waters), and are 56646 and 56425 Da for WT and +AP complexes, respectively; insert - phos-tag analysis of purified stalk complexes, WT and +AP. The complexes were analyzed by SDS-PAGE/phos-tag/WB and subsequently proteins were detected with specific antibodies against uL10 and P1/P2 proteins. The positions of phospho- and dephospho-forms are indicated with arrows.
Figure EV3
Figure EV3. Misincorporation analysis using a dual-luciferase reporter assay.
CGC245 and AGC218 describe near-cognate codons at positions 245 and 218 of the firefly reporter enzyme. All data are presented as the percentage of translational aberration; error bars, standard deviations (n = 3, technical replicates); *p < 0.05 by Student’s t-test is indicated by asterisks.
Figure EV4
Figure EV4. Cellular fitness of the WT and SDPM yeast strains.
(A) Growth curves for WT and SDPM strains. The exponential fragment of growth curves used for doubling time calculation and average doubling time for WT and SDPM are shown in insets. The statistical analysis was done using one-tailed t-Welch test (*p < 0.05), data are presented as mean ± SEM of n = 3, technical replicates. (B) Yeast lifespan analysis of WT and SDPM strains on the single cell level; the values were normalized to the WT referred as 100%, using data presented in (DF). To assess differences between the WT and SDPM strains, one-way ANOVA and Dunnett’s post hoc tests were used (*p < 0.05), ns not significant. Comparison of the reproductive potential (A), reproductive lifespan (B), post-reproductive lifespan (C), and total lifespan (D) of the haploid reference yeast strain BY4741 (wild-type—WT) and the mutant SDPM strain. Statistical significances were assessed using ANOVA and Dunnett’s post hoc test (*p < 0.05). The mean value for a total of 90 cells from two independent experiments is shown in parentheses.
Figure EV5
Figure EV5. The ribosomal footprints distribution obtained based on a genome-wide scale analysis of WT and SDPM yeast strains.
(A, B) Cross-correlation of gene expression analyses at the level of transcription (RNA-seq - A) and translation (RIBO-seq - B) for WT vs SDPM mutant strains; (C) average ribosome occupancy from all genes aligned from start to stop codons within the coding sequence (CDS) for WT (red line) and SDPM mutant strain (blue line); ribosome occupancy was normalized to show a mean value of 1 for each codon; the footprint occupancy was shown for the whole CDS. (D) The correlation of specific codon occupancies within 28 nt RPF. Specific overrepresented codons, CGG for arginine and CCG, CCC for proline are indicated.

References

    1. Bah A, Vernon RM, Siddiqui Z, Krzeminski M, Muhandiram R, Zhao C, Sonenberg N, Kay LE, Forman-Kay JD (2015) Folding of an intrinsically disordered protein by phosphorylation as a regulatory switch. Nature 519:106–109 - PubMed
    1. Belin S, Hacot S, Daudignon L, Therizols G, Pourpe S, Mertani HC, Rosa-Calatrava M, Diaz JJ (2010) Purification of ribosomes from human cell lines. Curr Protoc Cell Biol 49:3–40 - PubMed
    1. Bernado P, Modig K, Grela P, Svergun DI, Tchorzewski M, Pons M, Akke M (2010) Structure and dynamics of ribosomal protein L12: an ensemble model based on SAXS and NMR relaxation. Biophys J 98:2374–2382 - PMC - PubMed
    1. Best RB, Zhu X, Shim J, Lopes PE, Mittal J, Feig M, Mackerell AD Jr (2012) Optimization of the additive CHARMM all-atom protein force field targeting improved sampling of the backbone phi, psi and side-chain chi(1) and chi(2) dihedral angles. J Chem Theory Comput 8:3257–3273 - PMC - PubMed
    1. Blanchet S, Ranjan N (2022) Translation phases in eukaryotes. Methods Mol Biol 2533:217–228 - PMC - PubMed

MeSH terms

Substances

LinkOut - more resources