

Associations of periconception dietary glycemic index and load with fertility in women and men: a study among couples in the general population
- PMID: 39468525
- PMCID: PMC11520767
- DOI: 10.1186/s12916-024-03718-z
Associations of periconception dietary glycemic index and load with fertility in women and men: a study among couples in the general population
Abstract
Background: The dietary glycemic index (GI) and load (GL) reflect carbohydrate quality and quantity, potentially impacting fertility through modulation of insulin sensitivity and generation of oxidative stress. While fertility is influenced by both women and men, reproductive research often emphasizes maternal factors. We first examined periconception dietary intake in both women and male partners, and subsequent associations of dietary GI and GL with fecundability and subfertility.
Methods: Among 830 women and 651 male partners, participating in a population-based prospective cohort study from preconception onwards, we assessed periconception dietary intake and calculated GI and GL, using a food frequency questionnaire (FFQ) at median 12.4 weeks gestation (95% range 10.9, 18.4). Information on time to pregnancy was obtained through questionnaires, with subfertility defined as a time to pregnancy ≥ 12 months or use of assisted reproductive technology.
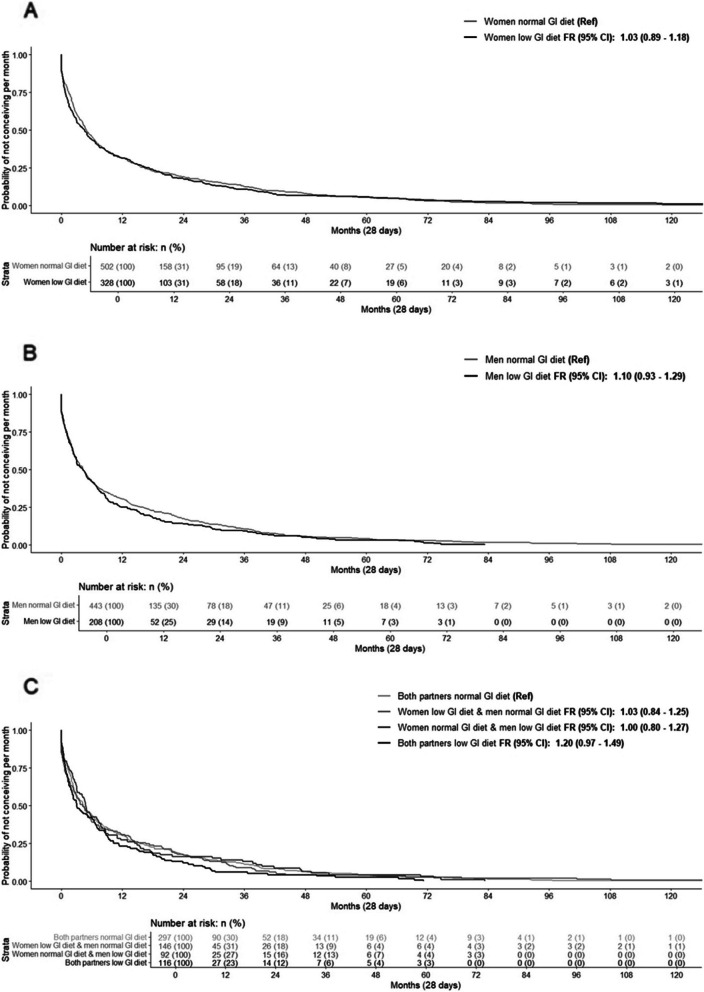
Results: In the periconception period, mean energy intake in women was 1870 kcal (SD: 500; 46% carbohydrates, 16% protein, 33% fat; dietary GI 56.2 (SD: 3.5) and GL 141.4 (SD: 67.4)). Mean energy intake in men was 2350 kcal (SD: 591; 43% carbohydrates, 16% protein, 33% fat; dietary GI 56.8 (SD: 3.2) and GL 156.7 (SD: 75.4)). Median time to pregnancy was 4.8 months (IQR: 1.2, 16.4), with 30.6% of 830 women experiencing subfertility. Dietary GI and GL were not associated with fertility outcomes in women. In men, higher dietary GI and GL across the full range were associated with decreased fecundability, after adjusting for socio-demographic and lifestyle factors, as well as dietary GI or GL of female partners [FR: 0.91, 95% CI 0.83, 0.99; FR: 0.90, 95% CI 0.81, 0.99, per SDS increase in dietary GI and GL, respectively]. When assessing the combined influence of dietary GI clinical categories in women and men, both partners adhering to a low GI diet tended to be associated with increased fecundability, but not with subfertility risk.
Conclusions: Suboptimal periconception carbohydrate intake may be negatively associated with male fertility, but not with fertility outcomes in women. Further studies are needed to assess whether a lower GI and GL diet is a feasible lifestyle intervention to improve couples fertility.
Keywords: Carbohydrates; Fertility; Glycemic index; Glycemic load; Periconception period.
© 2024. The Author(s).
Conflict of interest statement
The authors declare no competing interests.
Figures
References
-
- Practice Committee of American Society for Reproductive Medicine in collaboration with Society for Reproductive Endocrinology and Infertility. Optimizing natural fertility. Fertil Steril. 2008;90(5 Suppl):S1–6. - PubMed
Publication types
MeSH terms
LinkOut - more resources
Full Text Sources
