. 2024 Dec 11;15(12):e0227424.
doi: 10.1128/mbio.02274-24. Epub 2024 Oct 29.

Activation of the general stress response sigma factor SigB prevents competence development in Bacillus subtilis

Affiliations

Activation of the general stress response sigma factor SigB prevents competence development in Bacillus subtilis

Marco Harms et al. mBio. .

Abstract

Seemingly simple bacteria mount intricate adaptive responses when exposed to physical stress or nutrient limitation, and the activation of these responses is governed by complex signal transduction networks. Upon entry into the stationary growth phase, the soil bacterium Bacillus subtilis may develop natural competence, form biofilms or stress-resistant cells, or ultimately trigger a cellular differentiation program leading to spore formation. Master regulators, such as Spo0A, ComK, SinR, and SigB, constantly monitor the bacterium's environment and then determine appropriate adaptive responses. Here, we show that exposure of B. subtilis to visible light and other stresses triggers a general stress response-dependent block in competence development. SigB serves as an "emergency system" to silence inappropriate expression of an alternative developmental program in the face of unfavorable conditions. In particular, we document a stress-dependent molecular mechanism that prevents accumulation of the central competence regulator ComK via expression of a SigB-driven antisense RNA (as-comK, S365) which is part of a noncontiguous operon.

Importance: Bacillus subtilis exhibits a large number of different specific and general adaptation reactions, which need to be well balanced to sustain survival under largely unfavorable conditions. Under specific conditions, natural competence develops, which enables B. subtilis to actively take up exogenous DNA to integrate it into its own genome. In contrast to this specific adaptation, the general stress response is induced by a variety of exogenous stress and starvation stimuli, providing comprehensive protection and enabling survival of vegetative B. subtilis cells. In the present work, we reveal the molecular basis for the interconnection of these two important responses in the regulatory network. We describe that the master regulator of the general stress response SigB is activated by physiological stress stimuli, including daylight and ethanol stress, leading to the inactivation of the competence master regulator ComK by transcriptional anti-sense regulation, showing a strict hierarchy of adaptational responses under severe stress.

Keywords: ComK; ComK anti-sense RNA; SigB; Spo0A; as-comK (feature S365); competence development; general stress response; sporulation.


Conflict of interest statement

The authors declare no conflict of interest.

Figures

Fig 1
Fig 1
Simplified schematic overview of the growth cycle of B. subtilis and interactions between SigB and the master regulators ComK and Spo0A. Under conditions supporting growth, the vegetative cycle is favored (gray cycle). Natural competence (green path) is the ability of B. subtilis to bind and import extracellular DNA and is specifically induced under conditions of high cell densities (CDs) and limiting amino acid (AA) availability in the presence of glucose (Glc). Competence development is inherently coupled to the activity of the master regulator ComK. Sporulation (brown path) describes the development of a highly stress resistant endospore. It is also induced under conditions of high cell densities (CDs) and predominantly activated by glucose starvation (Glc) in the presence of amino acids (AAs). Initiation of sporulation depends on the activity of the primary master regulator Spo0A. The general stress response (pink path) is under control of the alternative sigma factor SigB that can be activated by a variety of physical stress stimuli (salt, heat, light, etc.) at any growth stage as well as glucose starvation at the onset of stationary phase. Stress-dependent activation of SigB directly inactivates the ComK and Spo0A regulators causing a block of competence and spore development.
Fig 2
Fig 2
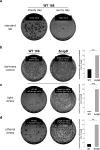
Stress-dependent reduction of transformation frequencies in B. subtilis. To determine transformation efficiencies, dilution series were plated onto both LB agar plates and selective LB agar plates to count the total colony forming units (CFU) and the transformed colony forming units (TCFU) after overnight incubation (24 h) at 37°C. Transformation frequencies (in percent) were determined by normalization on basis of the viable counts (CFU). (a) Two representative selective agar plates of replicate genetic transformation experiments of the B. subtilis wild-type 168 under standard laboratory conditions. The first experiment (left) was performed on a cloudy day and the second (right) on a bright sunny day. (b) Transformation experiments of the B. subtilis wild-type 168 and the isogenic ΔsigB mutant (ML6) under control conditions (darkness) and (c) after exposure to light (True Light LED source for 60 min) and (d) after 2% ethanol stress. The stress stimuli were applied when the cultures reached the late-exponential growth phase (OD500 = 1.6). Quantitative data from at least three independently performed biological replicates of the transformation assays are given as bar plots with the respective standard deviations. The transformation frequencies (Table S4) for the control, light, and ethanol stress experiments were normalized to those of the ΔsigB mutant. Statistical significance within the bar plots is represented by asterisks (**, P-values ≤ 0.01; ***, P-values ≤ 0.001).
Fig 3
Fig 3
SigB-dependent reduction of transformation frequencies in B. subtilis. To determine transformation efficiencies, dilution series were plated onto both LB agar plates and selective LB agar plates to count the total colony forming units (CFU) and the transformed colony forming units (TCFU) after overnight incubation (24 h) at 37°C. Transformation frequencies (in percent) were determined by normalization on the basis of the viable counts (CFU). Transformation of (a) chromosomal DNA and (b) plasmid DNA: Two representative selective agar plates of replicate genetic transformation experiments of the strain BAR610 carrying an inducible copy of the sigB gene under strict transcriptional control of a SigA-type promoter repressed by the tetracycline repressor TetR (26) are shown. SigB was either induced by the addition of 20 ng/mL anhydrotetracycline [aTc; left panels, (+)SigB] or remained uninduced [right panels, (−)SigB]. Transformation of (c) chromosomal DNA in strain BAR609: this strain has decoupled comK expression from the native chromosomal locus and represents a comK complementation mutant in the BAR610 background. A detailed description of the strain is given later in the text but is included here for direct comparison with BAR610. Two representative selective agar plates of replicate genetic transformation of the strain BAR609 with chromosomal DNA are shown. Quantitative data from at least three independently performed biological replicates of the transformation assays are represented by bar plots with the respective standard deviations. The transformation frequencies were normalized to those of the uninduced control cultures, respectively. Statistical significance within the bar plots is represented by asterisks (*, P-values ≤ 0.05; **, P-values ≤ 0.01).
Fig 4
Fig 4
Analysis of the impact of SigB activity on transcript patterns in the yhxD-comK region of the B. subtilis chromosome. (a) Schematic representation of the chromosomal yhxD-comK region. Genes are depicted (yhjA, yhxD, comK, and yhzC) together with their gene length in bases (small number adjacent to gene names), promoters (colored arrows), terminators (dark grey paddles), detected mRNAs (numbered consecutively from 1 to 6 and colored according to their promoter(s) of origin as well as the three RNA probes directed against the yhxD, yhzC, and comK transcripts used for the detection of all possible transcripts in this region (colored according to the transcript to be detected). Transcript number 2 includes three parts, the yhxD coding region (5′ end), the comK antisense as-comK (S365) region (middle) as well as the terminator readthrough into the coding region for yhzC (3′ end) detected by either the yhxD probe or the yhzC probe. Transcript 2 is most likely processed post-transcriptionally and split into parts 2a (detected by the yhxD probe) and 2b (detected by the yhzC probe). The putative cleavage position in transcript 2 is marked by a black triangle and a dotted line. Transcripts 4 and 5 both include the native comK coding region. While transcript 5 represents the monocistronic comK terminated at the terminator at the 3’ end of comK, transcript 4 represents the long read through comK-S367 transcript (both detected by the comK-probe). Transcript 6 corresponds to the comK mRNA originating from the translocated comK gene locus (BAR609). (b) Inversely correlated expression profiles of yhxD (pink), as-comK (S365) (dark purple) and comK (green) mRNAs [adapted from (27)]. The yhxD, as-comK (S365), and comK expression levels are displayed for selected growth and stress conditions. Culture conditions from Nicolas et al. (27) were ordered according to increasing yhxD and S365 expression levels (SMM control: cells sampled at OD500 0.4 from cultures of the BSB1 wild-type strain in Spizizens minimal medium (SMM) at 37°C with vigorous shaking, BMM control: cells sampled at OD500 0.4 from cultures of the BSB1 wild-type strain in Belitsky minimal medium (BMM) at 37°C with vigorous shaking, high temperature: cells sampled at OD578 1.0 from cultures of the BSB1 wild-type strain continuously grown in SMM at 51°C with vigorous shaking, heat stress: cells sampled at approximately OD500 0.4 from cultures of the BSB1 wild-type strain in BMM at 48°C for 10 min with vigorous shaking, salt stress: cells sampled at approximately OD500 0.4 from cultures of the BSB1 wild-type strain in SMM with 0.4 M sodium chloride for 10 min with vigorous shaking, ethanol stress: cells sampled at approximately OD500 0.4 from cultures of the BSB1 wild-type strain in BMM with 4% ethanol for 10 min with vigorous shaking). (c) Northern blot experiments displaying the expression profiles of the yhxD, as-comK (S365), yhzC, and comK transcript under control conditions (ctrl; promoting comK expression) and 20 min (T20) after addition of ethanol (WT and ΔsigB) or anhydrotetracycline (aTc)-dependent induction (BAR610 and BAR609). Cells were grown in competence medium in the dark and 2% ethanol or 20 ng/mL anhydrotetracycline was added when cultures reached an optical density of OD500 = 1.6. The respective detection probes used are shown on the left highlighted in their respective color (yhxD, yhzC, and comK) and their relative localizations are given in panel a. Detected transcripts are numbered and color-coded according to the schematic presentation in panel a. Putative cleavage products of transcript 2 are labeled with 2a.
Fig 5
Fig 5
Induction of the antisense transcript as-comK (S365) inhibits competence development. Schematic representation of the chromosomal organization of the tested mutant strains (BAR78, BAR85, and BAR79) and display of the results of transformation assays (left column) and FACS measurements of a comG-gfp reporter gene fusion (right column). All three strains tested carry a xylose-inducible copy of the T7 polymerase gene (T7 pol) that is chromosomally integrated into amyE and a PcomG-gfp reporter gene fusion in comG. Cells were either grown without (−xyl/green—right panel) or with (+xyl/pink—left panel) xylose. Left column: two representative selective agar plates of replicate genetic transformation experiments as well as bar charts of the determined transformation frequencies (normalized to the non-induced control cultures) are shown. Right column: histograms of the FACS population dynamic measurements are shown, in which the non-competent subpopulations are depicted in gray, and the competent subpopulations are either colored in green (non-induced controls) or purple (induced T7 polymerase), respectively. (a) No modifications were introduced into the yhxD-comK region in the control strain (BAR78). Therefore, expression of the T7 polymerase does not affect yhxD-as-comK(S365) induction. (b) In the PT7-yhxD-as-comK(S365) strain (BAR85), the SigB-dependent promoter (PSigB) in front of yhxD has been replaced by a T7 promoter (PT7) allowing induction of the yhxD and yhxD-as-comK(S365) transcripts by xylose. (c) In the PT7-as-comK(S365) strain (BAR79), the entire region containing the SigB-dependent promoter (PSigB), the yhxD coding sequence and the bidirectional terminator were deleted, and a T7 promoter (PT7) was integrated immediately upstream of as-comK (S365), allowing induction of the as-comK transcript by xylose alone. Statistical significance within the bar plots is represented by asterisks (*, P-values ≤ 0.05).
Fig 6
Fig 6
Comparative analysis of SigB protein quantity and SigB activity in the strains B. subtilis wild-type 168, ΔsigB, and BAR610 and BAR609. (a) Monitoring of SigB amount: Sections of a representative Western blot against SigB protein detected by NIR fluorescence measurement are displayed. Below the corresponding bar plots and standard deviations of the quantifications of three Western blots from independent biological replicates are shown. The respective values were normalized against the wild-type sample at control time t0. Furthermore, bar plots of the iBAQ intensities of SigB with standard deviations from a data independent acquisition–mass spectrometry (DIA-MS) analysis are shown. Three independent biological replicates were measured. The respective measured quantities were normalized against the wild-type sample at control time t0. (b) Analysis of SigB activity: Proteomic profiling allowed simultaneous analysis of the levels of SigB and two members of the SigB regulon, ctc and dps, and thus SigB activity. Bar plots of the iBAQ intensities of two SigB dependently expressed proteins, Ctc and Dps, with standard deviations from a DIA-MS analysis are displayed. Three independent biological replicates were measured. The respective quantities were normalized against the wild-type sample at control time t0.
Fig 7
Fig 7
Comparative analysis of ComK protein quantity and ComK activity in the strains B. subtilis wild-type 168, ΔsigB, and BAR610 and BAR609. (a) Monitoring of ComK amount: bar plots of the iBAQ intensities of ComK with standard deviations from a DIA-MS analysis of three independent biological replicates are shown. The respective quantities were normalized to the wild-type control sample t0. (b) Analysis of ComK activity: bar plot of the iBAQ intensities of the ComK dependently expressed protein ComC with standard deviations from a DIA-MS analysis are displayed. Three independent biological replicates were measured. The respective measured quantities were normalized to the wild-type control sample t0. The data originate from the same proteome profiling experiment displayed in Fig. 6.

References

    1. Branda SS, González-Pastor JE, Ben-Yehuda S, Losick R, Kolter R. 2001. Fruiting body formation by Bacillus subtilis. Proc Natl Acad Sci U S A 98:11621–11626. doi:10.1073/pnas.191384198 - DOI - PMC - PubMed
    1. Mirel DB, Estacio WF, Mathieu M, Olmsted E, Ramirez J, Márquez-Magaña LM. 2000. Environmental regulation of Bacillus subtilis ςD-dependent gene expression. J Bacteriol 182:3055–3062. doi:10.1128/JB.182.11.3055-3062.2000 - DOI - PMC - PubMed
    1. Msadek T, Kunst F, Klier A, Rapoport G. 1991. DegS-DegU and ComP-ComA modulator-effector pairs control expression of the Bacillus subtilis pleiotropic regulatory gene degQ. J Bacteriol 173:2366–2377. doi:10.1128/jb.173.7.2366-2377.1991 - DOI - PMC - PubMed
    1. Ochi K, Ohsawa S. 1984. Initiation of antibiotic production by the stringent response of Bacillus subtilis Marburg. J Gen Microbiol 130:2473–2482. doi:10.1099/00221287-130-10-2473 - DOI - PubMed
    1. Boylan SA, Redfield AR, Brody MS, Price CW. 1993. Stress-induced activation of the σB transcription factor of Bacillus subtilis. J Bacteriol 175:7931–7937. doi:10.1128/jb.175.24.7931-7937.1993 - DOI - PMC - PubMed

MeSH terms

LinkOut - more resources