. 2025 Mar;197(3):e63914.
doi: 10.1002/ajmg.a.63914. Epub 2024 Oct 29.

Neuroimaging to Genotype: Delineating the Spectrum of Disorders With Deficient Myelination in the Indian Population

Affiliations

Neuroimaging to Genotype: Delineating the Spectrum of Disorders With Deficient Myelination in the Indian Population

Namanpreet Kaur et al. Am J Med Genet A. 2025 Mar.

Abstract

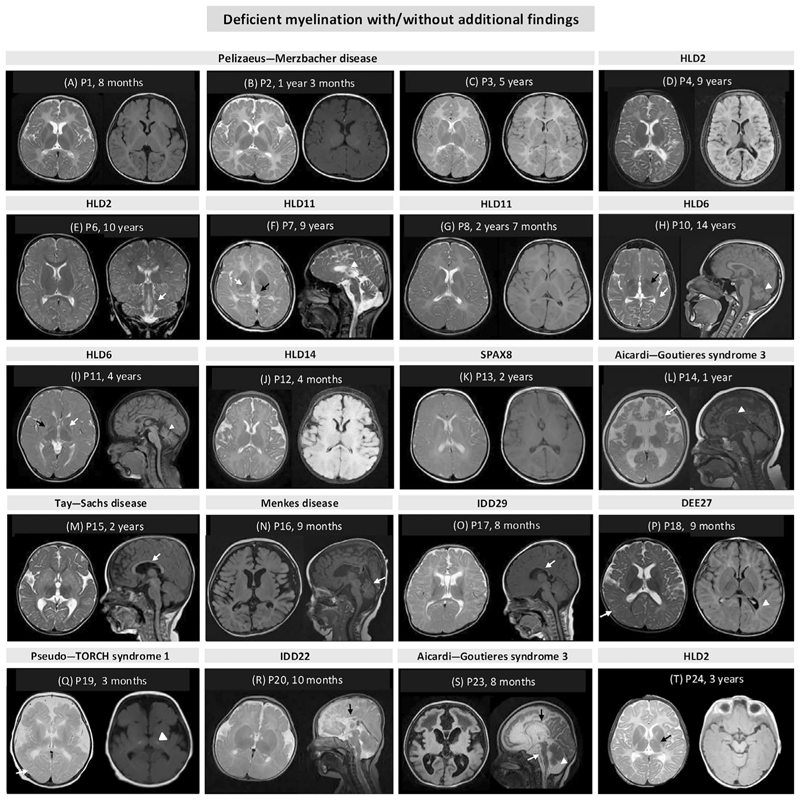
Several genetic disorders are associated with either a permanent deficit or a delay in central nervous system myelination. We investigated 24 unrelated families (25 individuals) with deficient myelination after clinical and radiological evaluation. A combinatorial approach of targeting and/or genomic testing was employed. Molecular diagnosis was achieved in 22 out of 24 families (92%). Four families (4/9, 44%) were diagnosed with targeted testing and 18 families (18/23, 78%) were diagnosed using broad genomic testing. Overall, 14 monogenic disorders were identified. Twenty disease-causing variants were identified in 14 genes including PLP1, GJC2, POLR1C, TUBB4A, UFM1, NKX6-2, DEGS1, RNASEH2C, HEXA, ATP7A, SETBP1, GRIN2B, OCLN, and ZBTB18. Among these, nine (45%) variants are novel. Fourteen families (82%, 14/17) were diagnosed using proband-only exome sequencing (ES) complemented with deep phenotyping, thus highlighting the utility of singleton ES as a valuable diagnostic tool for identifying these disorders in resource-limited settings.

Keywords: deficient myelination; genomics; myelin; neuroimaging.


Conflict of interest statement

Conflicts of Interest

The authors declare no conflicts of interest.

Figures

Figure 1
Figure 1. Brain MRI scans shows deficient myelination with/without additional findings
Diffuse cerebral hypomyelination in axial T2-weighted and T2-flair images of (A) P1 (Pelizaeus–Merzbacher disease), (B) P2 (Pelizaeus–Merzbacher disease), (C) P3 (Pelizaeus–Merzbacher disease), and (D) P4 (leukodystrophy, hypomyelinating, 2, HLD2); (E) subcortical hypomyelination in axial T2-weighted image and brainstem hyperintensities (white arrow) in coronal in T2-weighted image of P6 (HLD2); (F) hypomyelination, anterolateral thalamus hyperintensity (black arrow), and hypointense globus pallidus (white arrow) in axial T2-weighted image and thin corpus callosum (white arrowhead) in sagittal T2-weighted image of P7 (HLD11); (G) diffuse cerebral hypomyelination in axial T2-weighted and T2-flair images of P8 (HLD11); (H) cerebral hypomyelination, hypointense globus pallidus (black arrow) and optic radiation (white arrow) in axial T1-weighted and cerebellar atrophy (white arrow head) in sagittal T1-weighted images of P10 (HLD6); (I) deficient myelination, hypointense globus pallidus (white arrow) and putamen atrophy (black arrow) in axial T2-weighted and cerebellar atrophy (white arrowhead) in sagittal T1-weighted image of P11 (HLD6); (J) diffuse cerebral hypomyelination in axial T2-weighted and T2-flair images of P12 (HLD14); (K) deficient myelination in axial T2-weighted and axial T2-flair images of P13 (spastic ataxia 8, autosomal recessive, with HLD, SPAX8); (L) deficient myelination, cystic abnormalities in the frontotemporal white matter (white arrow), focal hypointensities indicative of calcifications, diffuse cerebral atrophy in axial T2-weighted image and thin corpus callosum (white arrow head) in sagittal T1-weighted image of P14 (Aicardi–Goutières syndrome 3); (M) deficient myelination in axial T2-weighted image and thin corpus callosum (white arrow) in sagittal in T1-weighted image of P15 (Tay–Sachs disease); (N) cerebral atrophy and deficient myelination in axial T2-flair image and cerebellar atrophy (white arrow) in sagittal T1-weighted image of P16 (Menkes disease); (O) bilateral symmetric white volume loss with deficient myelination both in subcortical white matter and centrum semiovale in axial T2-weighted image and thin corpus callosum (white arrow) in sagittal T1-weighted image of P17 (intellectual developmental disorder, autosomal dominant 29, IDD29); (P) deficient myelination and dysmyelination around periventricular (white arrowhead) and subcortical areas (white arrow) in axial T2-weighted and T2-flair images of P18 (developmental and epileptic encephalopathy 27, DEE27); (Q) deficient myelination, pachygyria and bilateral dense calcification involving the subcortical areas (white arrow) and basal ganglia (white arrow head), polymicrogyria involving the temporal lobes and simplified gyration in the frontal and parietal cortex and cerebral atrophy in axial T2-weighted and axial T2-flair images of P19 (pseudo-TORCH syndrome 1); (R) deficient myelination, thickened fornisis, abnormal cortical gyration, polymicrogyria in axial T2-weighted image, and partial agenesis of corpus callosum (black arrow) in sagittal T2-weighted image of P20 (intellectual developmental disorder, autosomal dominant 22, IDD22); (S) leukoencephalopathy, deficient myelination, cystic changes in frontal lobe in axial T2-flair images and hypoplasia of corpus callosum (black arrow), brain stem atrophy (white arrow), and cerebellar vermian atrophy (white arrow head) in sagittal T2-weighted images of P23 (Aicardi–Goutières syndrome 3); (T) diffuse cerebral hypomyelination and hyperintensities in the posterior limb of internal capsule (black arrow) and dysmyelination in axial T2-weighted image and axial T2-flair images of P24 (HLD2). Age mentioned in figures is the age when MRI was performed for the proband.
Figure 2
Figure 2. Schematic diagram to show the genetic testing strategy employed in 24 families.
MLPA, multiplex ligation-dependent probe amplification; PLP1, proteolipid protein 1; qPCR, quantitative PCR; RNASEH2C, ribonuclease H2 subunit C.
Figure 3
Figure 3
(A) Diagrammatic representation of genes, where disease-causing variants were identified in our cohort, classified based on their molecular functions; (B) variant occurrence; (C) type of variants; and (D) American College of Medical Genetics and Genomics (ACMG) classification. VUS, variant of uncertain significance.

References

    1. Arai-Ichinoi N, Uematsu M, Sato R, et al. Genetic Heterogeneity in 26 Infants With a Hypomyelinating Leukodystrophy. Human Genetics. 2016;135(1):89–98. - PubMed
    1. Bae H-G, Kim TK, Suk HY, Jung S, Jo D-G. White Matter and Neurological Disorders. Archives of Pharmacal Research. 2020;43(9):920–931. - PubMed
    1. Barkovich AJ, Deon S. Hypomyelinating Disorders: An MRI Approach. Neurobiology of Disease. 2016;87:50–58. - PubMed
    1. Brandt T, Sack LM, Arjona D, et al. Adapting ACMG/AMP Sequence Variant Classification Guidelines for Single-Gene Copy Number Variants. Genetics in Medicine. 2020;22(2):336–344. - PubMed
    1. Branson HM. Normal Myelination. Neuroimaging Clinics of North America. 2013;23(2):183–195. - PubMed

LinkOut - more resources