

SpliceMutr Enables Pan-Cancer Analysis of Splicing-Derived Neoantigen Burden in Tumors
- PMID: 39470352
- PMCID: PMC11648103
- DOI: 10.1158/2767-9764.CRC-23-0309
SpliceMutr Enables Pan-Cancer Analysis of Splicing-Derived Neoantigen Burden in Tumors
Abstract
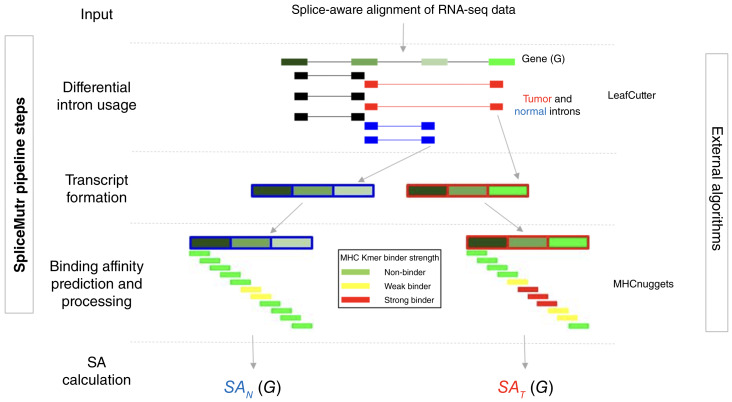
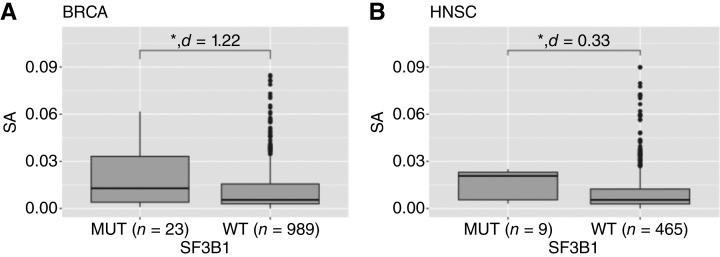
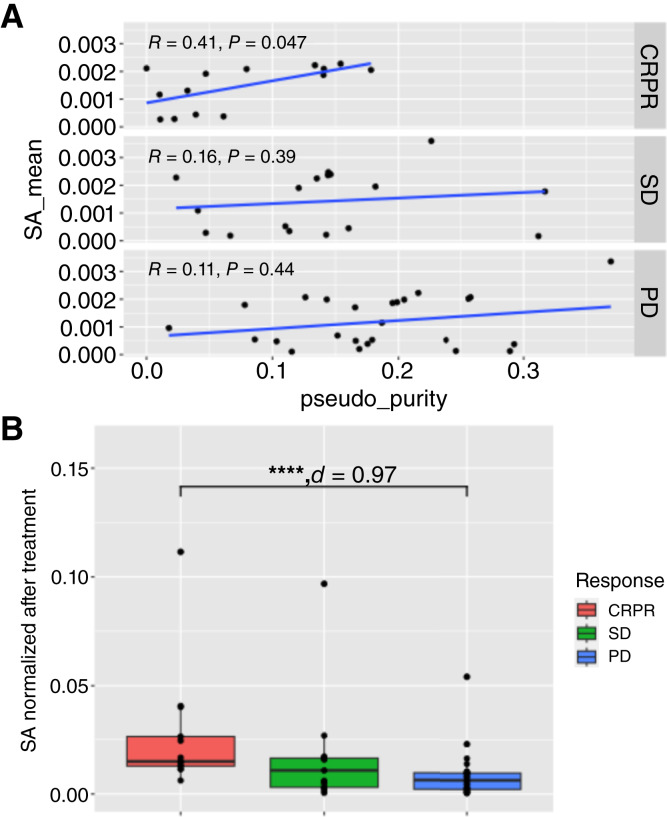
Abstract: Aberrant alternative splicing can generate neoantigens, which can themselves stimulate immune responses and surveillance. Previous methods for quantifying splicing-derived neoantigens are limited by independent references and potential batch effects. Here, we introduce SpliceMutr, a bioinformatics approach and pipeline for identifying splicing-derived neoantigens from tumor and normal data. SpliceMutr facilitates the identification of tumor-specific antigenic splice variants, predicts MHC-binding affinity, and estimates splicing antigenicity scores per gene. By applying this tool to transcriptomic data from The Cancer Genome Atlas, we generate splicing-derived neoantigens and neoantigenicity scores per sample and across all cancer types and find numerous correlations between splicing antigenicity and well-established biomarkers of antitumor immunity. Notably, carriers of mutations within splicing machinery genes have higher splicing antigenicity, which provides support for our approach. Further analysis of splicing antigenicity in cohorts of patients with melanoma treated with mono- or combined immune checkpoint inhibition suggests that the abundance of splicing antigens is reduced post-treatment from baseline in patients who progress. We also observe increased splicing antigenicity in responders to immunotherapy, which may relate to an increased capacity to mount an immune response to splicing-derived antigens. We find the splicing antigenicity to be higher in tumor samples when compared with normal, that mutations in the splicing machinery result in increased splicing antigenicity in some cancers, and higher splicing antigenicity is associated with positive response to immune checkpoint inhibitor therapies. Furthermore, this new computational pipeline provides novel analytical capabilities for splicing antigenicity and is openly available for further immuno-oncology analysis.
Significance: SpliceMutr shows that splicing antigenicity changes in response to ICI therapies and that native modulation of the splicing machinery through mutations increases the contribution of splicing to the neoantigen load of some The Cancer Genome Atlas cancer subtypes. Future studies of the relationship between splicing antigenicity and immune checkpoint inhibitor response pan-cancer are essential to establish the interplay between antigen heterogeneity and immunotherapy regimen on patient response.
©2024 The Authors; Published by the American Association for Cancer Research.
Conflict of interest statement
M.D. Kessler reports personal fees from Regeneron Pharmaceuticals outside the submitted work, as well as current full-time employment with Regeneron Pharmaceuticals. X.M. Shao reports that she and the university are entitled to royalty distributions related to technology described in the study discussed in this publication, as well as reports working for Adaptive Biotechnologies Corp. M. Yarchoan reports grants from Genentech, Bristol Myers Squibb, and Incyte, personal fees from Exelixis, AstraZeneca, and Lantheus, and other support from Adventris outside the submitted work. N. Zaidi reports research support from Bristol Myers Squibb; serving on the advisory board for Genentech; being a consultant for and receiving other support from Adventris Pharmaceuticals; and being a coinventor on filed patents related to KRAS peptide vaccines. N.S. Azad reports institutional funding from Agios, Inc., Array, Atlas, Bayer HealthCare, Bristol Myers Squibb, Celgene, Debio, Eli Lilly and Company, EMD Serono, Incyte Corporation, Intensity, Merck & Co., Inc., and Taiho Pharmaceutical Co., Ltd; participating on advisory boards for Incyte, QED, and GlaxoSmithKline; and being under a license agreement between Genentech and the Johns Hopkins University. E.M. Jaffee reports other support from AbMeta and Adventris, personal fees from Achilles, Dragonfly, Parker Institute, Surge, Mestag, and Medical Home Group, and grants from Lustgarten, Genentech, Bristol Myers Squibb, and Break Through Cancer outside the submitted work. V. Anagnostou reports grants from AstraZeneca, Bristol Myers Squibb, Delfi Diagnostics, and Personal Genome Diagnostics and personal fees from NeoGenomics, AstraZeneca, Foundation Medicine, and Personal Genome Diagnostics outside the submitted work, as well as being an inventor on patent applications (63/276525, 17/779936, 16/312152, 16/341862, 17/047006, and 17/598690) submitted by Johns Hopkins University related to Cancer Genomic Analyses and ctDNA Therapeutic Response Monitoring and Immunogenomic Features of Response to Immunotherapy that have been licensed to one or more entities. Under the terms of these license agreements, the University and inventors are entitled to fees and royalty distributions. R. Karchin reports other support from Genentech during the conduct of the study. D.A. Gaykalova reports grants from the University of Maryland during the conduct of the study. E.J. Fertig reports grants from NIH/NCI, Lustgarten Foundation, and Johns Hopkins University during the conduct of the study, as well as personal fees from ResistanceBio/Viosera Therapeutics and grants from AbbVie Inc., Roche/Genentech, Break Through Cancer, Emerson Collective, and NIH/National Institute of Aging outside the submitted work. No disclosures were reported by the other authors.
Figures


References
Publication types
MeSH terms
Substances
Grants and funding
LinkOut - more resources
Full Text Sources
Medical
Research Materials
