. 2025 Feb 10;27(2):567-582.
doi: 10.1093/neuonc/noae190.

Imaging PD-L1 in the brain-Journey from the lab to the clinic

Affiliations

Imaging PD-L1 in the brain-Journey from the lab to the clinic

Dawoud Dar et al. Neuro Oncol. .

Abstract

Background: Immune checkpoint inhibitors (ICPIs) have proven to restore adaptive anti-tumor immunity in many cancers; however, no noteworthy therapeutic schedule has been established for patients with glioblastoma (GBM). High programmed death-ligand 1 (PD-L1) expression is associated with immunosuppressive and aggressive phenotypes in GBM. Presently, there is no standardized protocol for assessing PD-L1 expression levels to select patients and monitor their response to ICPI therapy. The aim of this study was to investigate the use of 89Zr-DFO-Atezolizumab to image the spatio-temporal distribution of PD-L1 in preclinical mouse models and in patients with newly diagnosed GBM treated with/without neoadjuvant Pembrolizumab.

Methods: The immunoreactivity, binding affinity, and specificity of 89Zr-DFO-Atezolizumab were confirmed in vitro. Mice-bearing orthotopic GBM tumors or patients with newly diagnosed GBM treated with/without Pembrolizumab were intravenously injected with 89Zr-DFO-Atezolizumab, and PET/CT images were acquired 24, 48, and 72 hours in mice and at 48 and 72 post-injection in patients. Radioconjugate uptake was quantified in the tumor and healthy tissues. Ex vivo immunohistochemistry (IHC) and immunophenotyping were performed on mouse tumor samples or resected human tumors.

Results: 89Zr-DFO-Atezolizumab was prepared with high radiochemical purity (RCP > 99%). In vitro cell-associated radioactivity of 89Zr-DFO-Atezolizumab corroborated cell line PD-L1 expression. PD-L1 in mouse GBM tumors was detected with high specificity using 89Zr-DFO-Atezolizumab and radioconjugate uptake correlated with IHC. Patients experienced no 89Zr-DFO-Atezolizumab-related side effects. High 89Zr-DFO-Atezolizumab uptake was observed in patient tumors at 48 hours post-injection, however, the uptake varied between patients treated with/without Pembrolizumab.

Conclusions: 89Zr-DFO-Atezolizumab can visualize distinct PD-L1 expression levels with high specificity in preclinical mouse models and in patients with GBM, whilst complementing ex vivo analysis.

Keywords: glioblastoma; immuno-PET; immunotherapy; nuclear medicine; translational studies.


Conflict of interest statement

The authors declare no conflicts of interest.

Figures

Figure 1.
Figure 1.
(A) Representative flow cytometry histograms showing PD-L1 expression in murine and human GBM cell lines with and without IFN-γ stimulation. (B) Schematic illustration of the 89Zr-DFO-Atezolizumab chemical structure. (C) Immunoreactive fraction of 89Zr-DFO-Atezolizumab in blocked and unblocked conditions (n = 6). (D) Binding specificity of 89Zr-DFO-Atezolizumab (1 nM) in murine and human GBM cell lines with and without IFN-γ stimulation (n = 6). (E) Representative confocal immunofluorescence images demonstrating IR700-Atezolizumab binding to PD-L1 in GL261 cells stimulated with IFN-γ at 4 °C and 37 °C; and nuclei visualization with Hoechst®33342 staining (4 °C, Scale bar: 5 μm, Magnification: × 63; 37 °C, Scale bar: 10 μm, Magnification: × 82).
Figure 2.
Figure 2.
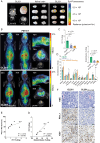
(A) Representative photographic and T2W MR images of GL261 tumor-bearing brains following i.v. injection with 1% Evans Blue (left panel). Photographic and IVIS fluorescent images of naïve and GL261 tumor-bearing brain slices (4 mm) following i.v. injection with 1% Evans Blue (middle and right panels). Evans Blue fluorescence was captured with 640 nm excitation and 680 nm emission filters. (B) Representative PET images of 89Zr-DFO-Atezolizumab uptake in mice-bearing orthotopic GL261 and GL261PD-L1 KO at 48 and 72 hours post-injection. Anatomical visualization of tumors was performed by T2W MRI prior to 89Zr-DFO-Atezolizumab administration. (C) PET quantification (%ID/g) of 89Zr-DFO-Ateolizumab uptake in orthotopic GL261 (n = 8) and GL261PD-L1 KO (n = 4) tumors, and naïve mouse brains (n = 3). (D) Ex vivo biodistribution of naïve mice and mice-bearing orthotopic GL261 and GL261PD-L1 KO tumors 72 hours post-injection with 89Zr-DFO-Atezolizumab (n = 3). (E) Linear correlation between PET-quantified 89Zr-DFO-Atezolizumab uptake and PD-L1-positive IHC score (R2 = 0.3744). (F) Linear correlation between PET-quantified and biodistribution-quantified 89Zr-DFO-Atezolizumab uptake (R2 = 0.8959). (G) Representative images of H&E, PD-L1, and Ki67 IHC stained GL261 and GL261PD-L1 KO tumors (Scale bar: 50 μm, Magnification: × 40).
Figure 3.
Figure 3.
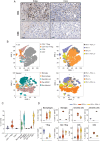
(A) Representative CD4 and CD8 IHC stained GL261 tumors (Scale bar: 50 μm, Magnification: × 40). (B) Composition of myeloid and T cell populations and PD-1/PD-L1 expression using t-SNE maps of CD45 + cells from GL261 tumors (n = 4). (D) Flow cytometry quantification of myeloid and T cell populations as a frequency of live cells from GL261 tumors (n = 4). (E) Flow cytometry quantification of PD-1/PD-L1 expression as a frequency of gated myeloid and T cell populations (n = 4).
Figure 4.
Figure 4.
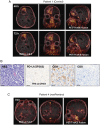
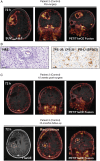
(A) Representative PET/contrast-enhanced T1W (T1wCE) MR fusion images taken pre-surgery from patient 1 (control) at 48 and 72 hours post-injection of 89Zr-DFO-Atezolizumab. (B) Representative H&E and CD4, CD8, and PD-L1 IHC staining from the patient 1 resected tumor specimen (Scale bar: 50 μm, Magnification: × 38). (C) Representative PET/T1wCE MR fusion images taken pre-surgery from patient 4 (neoPembrolizumab) at 72 hours post-injection of 89Zr-DFO-Atezolizumab. (D) Representative T1wCE MR fusion image only (left column), fusion with PET (middle column), and perfusion-weighted imaging (PWI) (right column) from patient 7 demonstrating heterogeneous 89Zr-DFO-Atezolizumab uptake and vascular permeability. The dashed boxes highlight either gadolinium positive–negative and/or PET-positive–negative regions of interest across corresponding T1wCE MR, PET/T1wCE MR fusion, and PWI image slices.
Figure 4.
Figure 4.
(A) Representative PET/contrast-enhanced T1W (T1wCE) MR fusion images taken pre-surgery from patient 1 (control) at 48 and 72 hours post-injection of 89Zr-DFO-Atezolizumab. (B) Representative H&E and CD4, CD8, and PD-L1 IHC staining from the patient 1 resected tumor specimen (Scale bar: 50 μm, Magnification: × 38). (C) Representative PET/T1wCE MR fusion images taken pre-surgery from patient 4 (neoPembrolizumab) at 72 hours post-injection of 89Zr-DFO-Atezolizumab. (D) Representative T1wCE MR fusion image only (left column), fusion with PET (middle column), and perfusion-weighted imaging (PWI) (right column) from patient 7 demonstrating heterogeneous 89Zr-DFO-Atezolizumab uptake and vascular permeability. The dashed boxes highlight either gadolinium positive–negative and/or PET-positive–negative regions of interest across corresponding T1wCE MR, PET/T1wCE MR fusion, and PWI image slices.
Figure 5.
Figure 5.
(A) Representative PET/contrast-enhanced T1W (T1wCE) MR fusion images taken pre-surgery from patient 2 (control) at 72 hours post-injection of 89Zr-DFO-Atezolizumab. (B) Representative H&E and PD-L1 IHC staining from the patient 1 resected tumor specimen (Scale bar: 50 μm, Magnification: × 38). (C) Representative PET/T1wCE MR fusion images taken at 10 weeks and 12 months post-surgery from patient 2 at 72 hours post-injection of 89Zr-DFO-Atezolizumab.
Figure 6.
Figure 6.
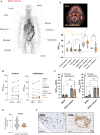
(A) Whole-body MIP of 89Zr-DFO-Atezolizumab uptake in patient 2 (control) at 72 hours post-injection. (B) Representative biodistribution of 89Zr-DFO-Atezolizumab uptake quantified using SUVmax from patient 2 (control). (C) Comparison of SUVmax between healthy brain and tumor at 48 and 72 hours post-injection of 89Zr-DFO-Atezolizumab in control (n = 3) and neoPembrolizumab arms (n = 5). (D) Comparison of SUVmax taken from the tonsils, tumor-draining lymph nodes, spleen, and tumor (control/neoPembrolizumab). Representative PET/CT image of 89Zr-DFO-Atezolizumab uptake in the tumor-draining lymph nodes in patient 5 treated with neoadjuvant Pembrolizumab at 72 hours post-injection. (E) Combined positive scoring (CPS) of PD-L1 expression from control (n = 3) and neoPembrolizumab-treated patient tumor resection tissues (n = 5). (F) Representative CD4 and CD8 IHC staining from patient 2 in the control group (Scale bar: 50 μm, Magnification: × 38).

References

    1. Wen PY, Reardon DA.. Neuro-oncology in 2015: Progress in glioma diagnosis, classification and treatment. Nat Rev Neurol. 2016;12(2):69–70. - PubMed
    1. Waldman AD, Fritz JM, Lenardo MJ.. A guide to cancer immunotherapy: From T cell basic science to clinical practice. Nat Rev Immunol. 2020;20(11):651–668. - PMC - PubMed
    1. Simonds EF, Lu ED, Badillo O, et al.Deep immune profiling reveals targetable mechanisms of immune evasion in immune checkpoint inhibitor-refractory glioblastoma. J ImmunoTher Cancer. 2021;9(6):e002181. - PMC - PubMed
    1. Nduom EK, Wei J, Yaghi NK, et al.PD-L1 expression and prognostic impact in glioblastoma. Neuro Oncol. 2016;18(2):195–205. - PMC - PubMed
    1. Berghoff AS, Kiesel B, Widhalm G, et al.Programmed death ligand 1 expression and tumor-infiltrating lymphocytes in glioblastoma. Neuro Oncol. 2014;17(8):1064–1075. - PMC - PubMed

MeSH terms