

Unveiling novel prognostic biomarkers and therapeutic targets for HBV-associated hepatocellular carcinoma through integrated bioinformatic analysis
- PMID: 39470543
- PMCID: PMC11521037
- DOI: 10.1097/MD.0000000000040134
Unveiling novel prognostic biomarkers and therapeutic targets for HBV-associated hepatocellular carcinoma through integrated bioinformatic analysis
Abstract
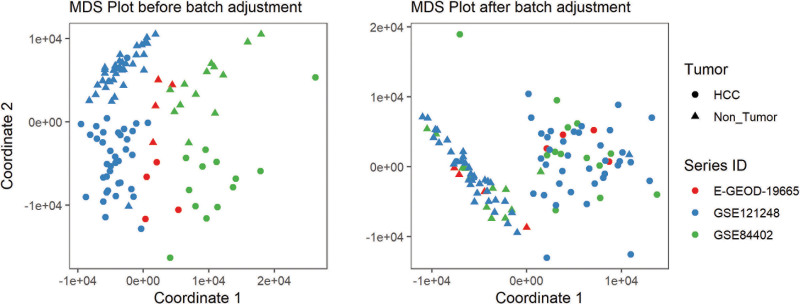
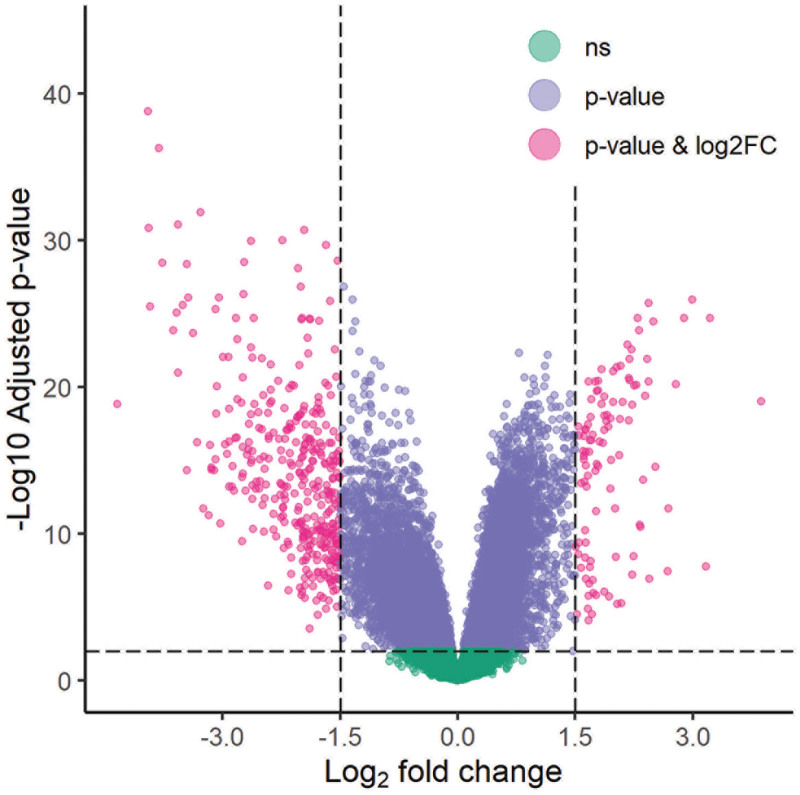
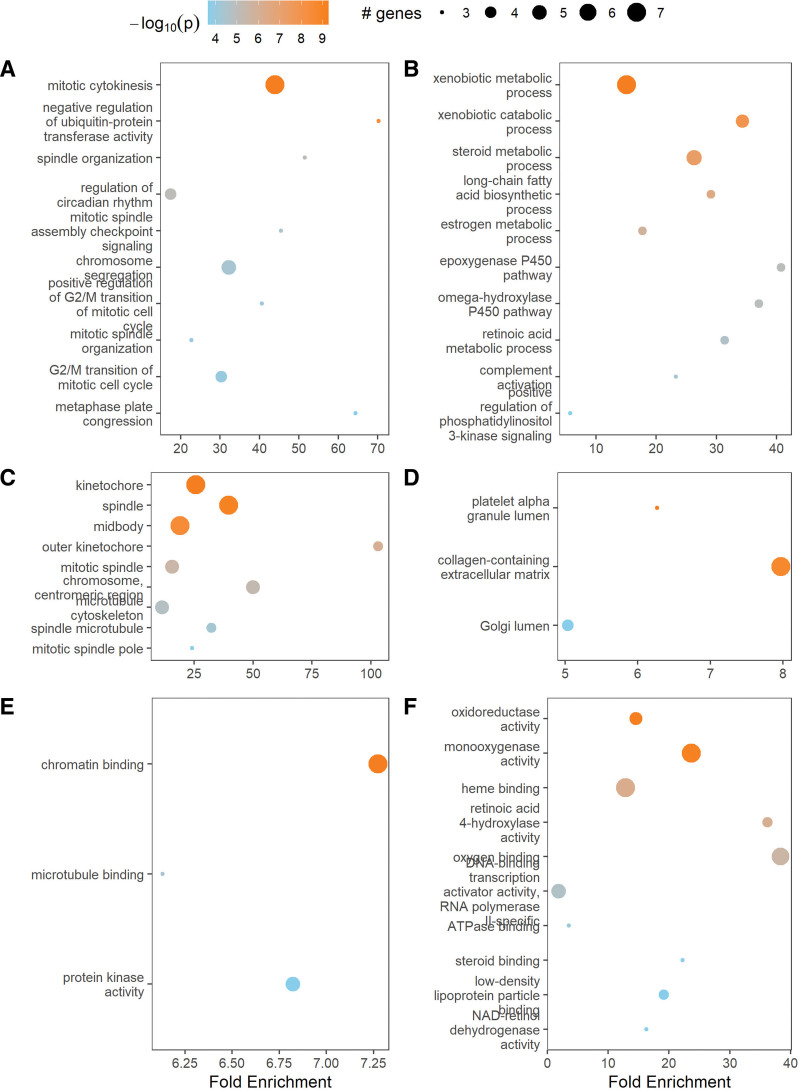
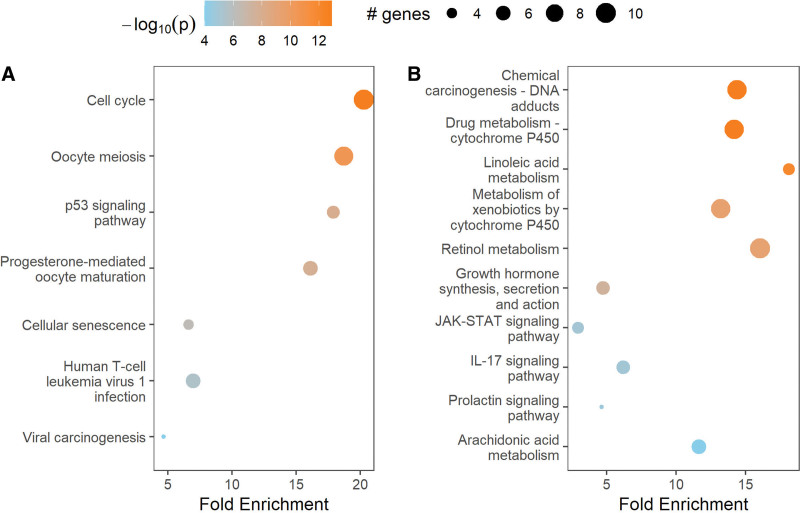
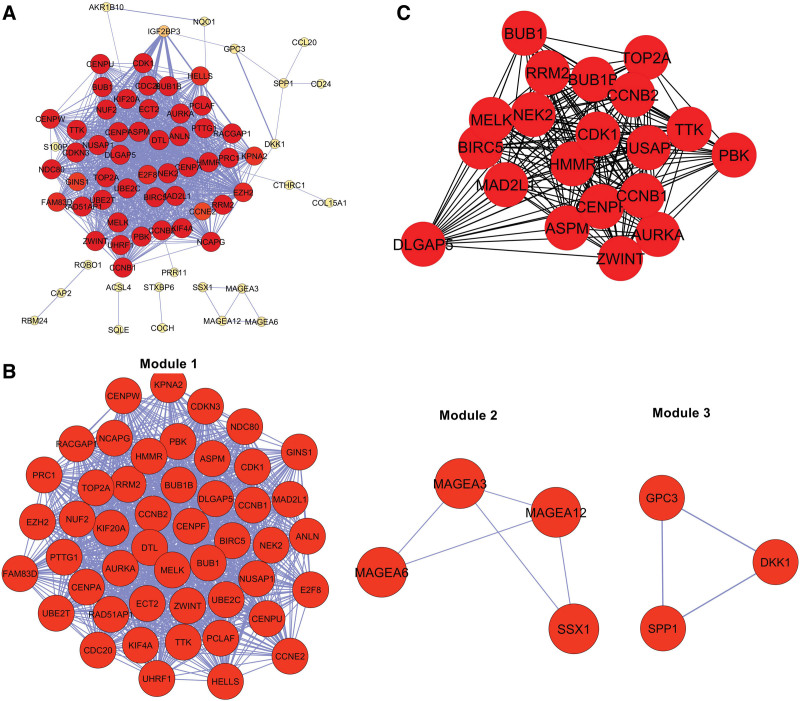
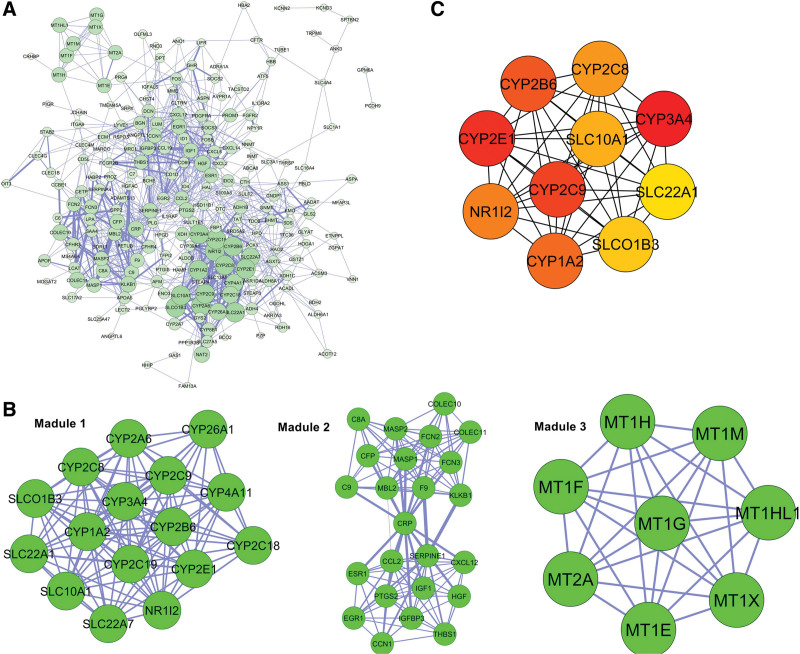
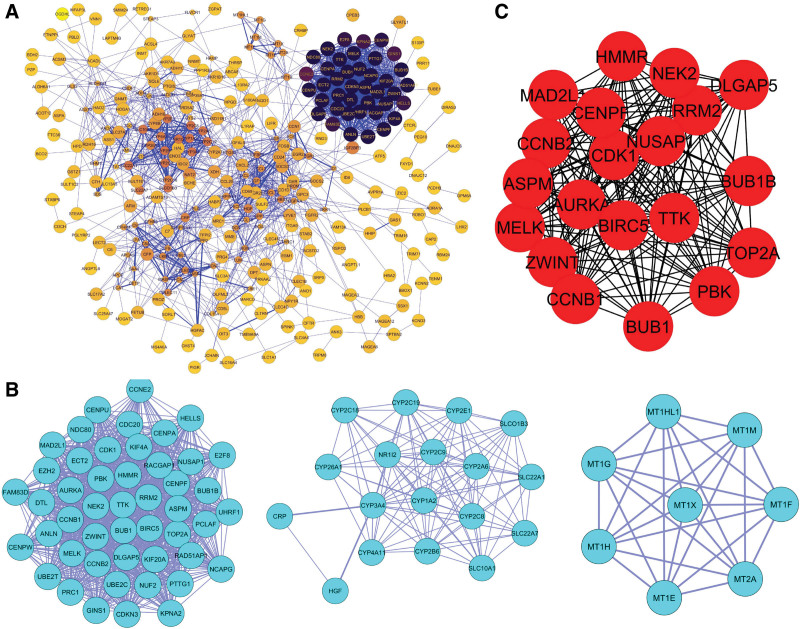
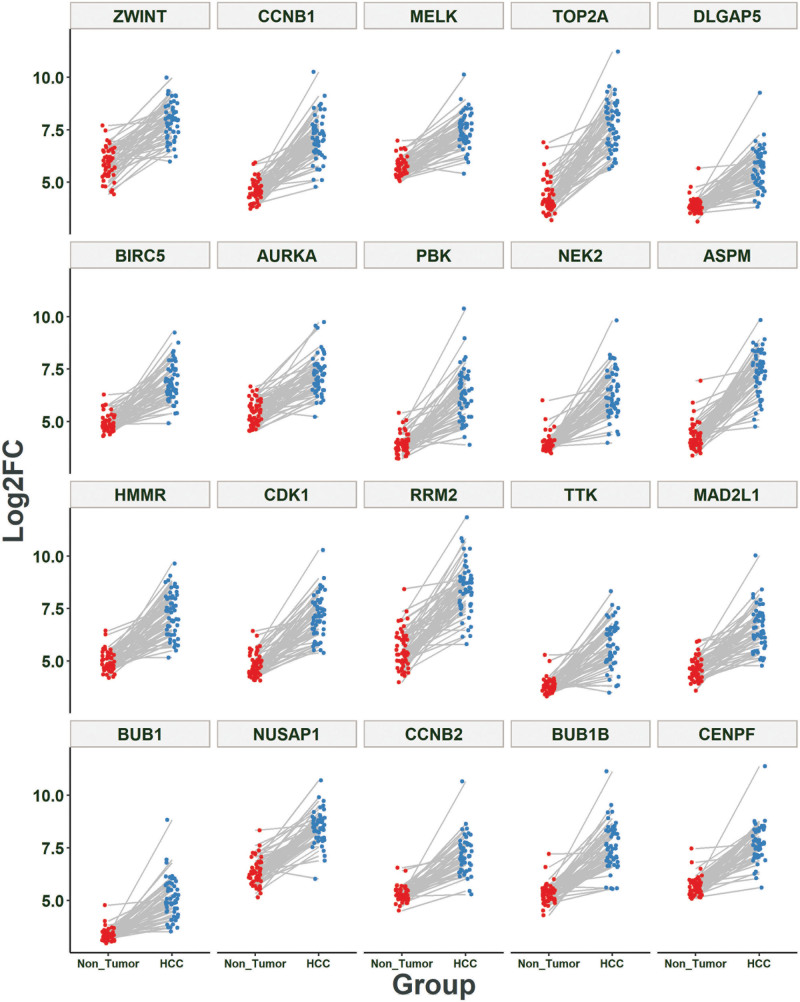
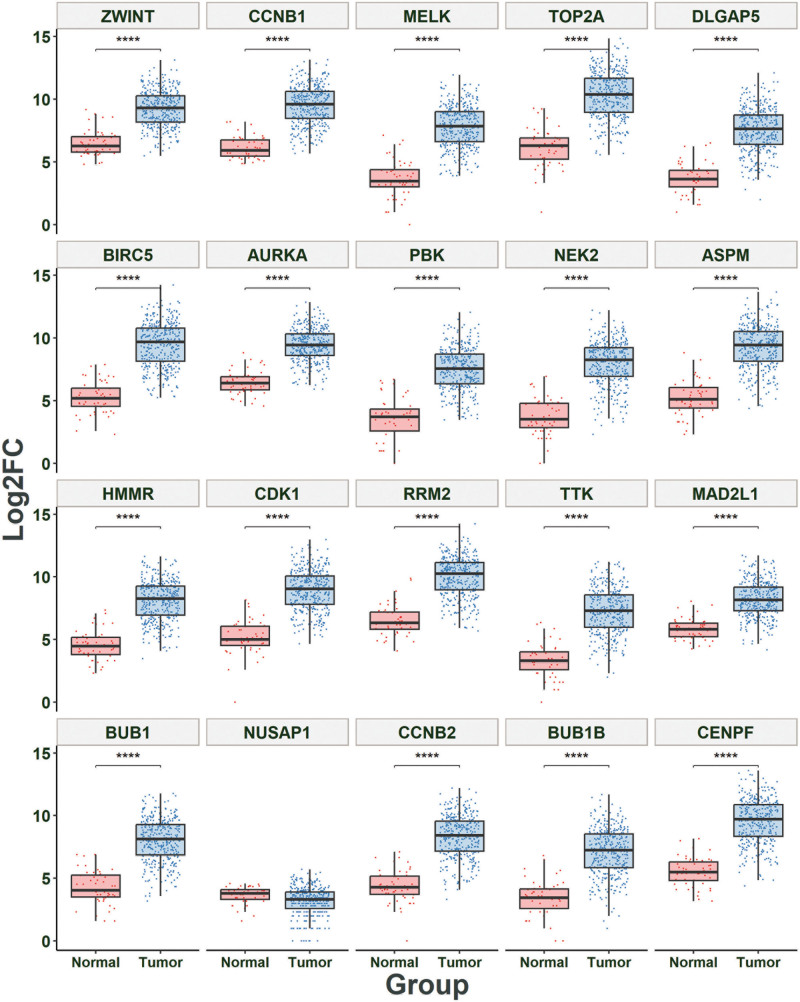
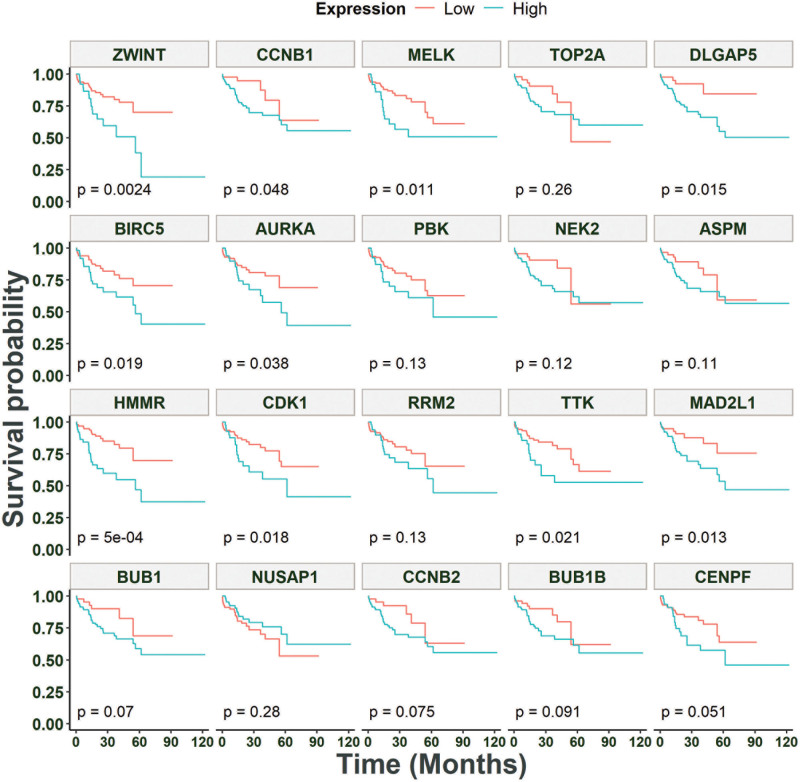
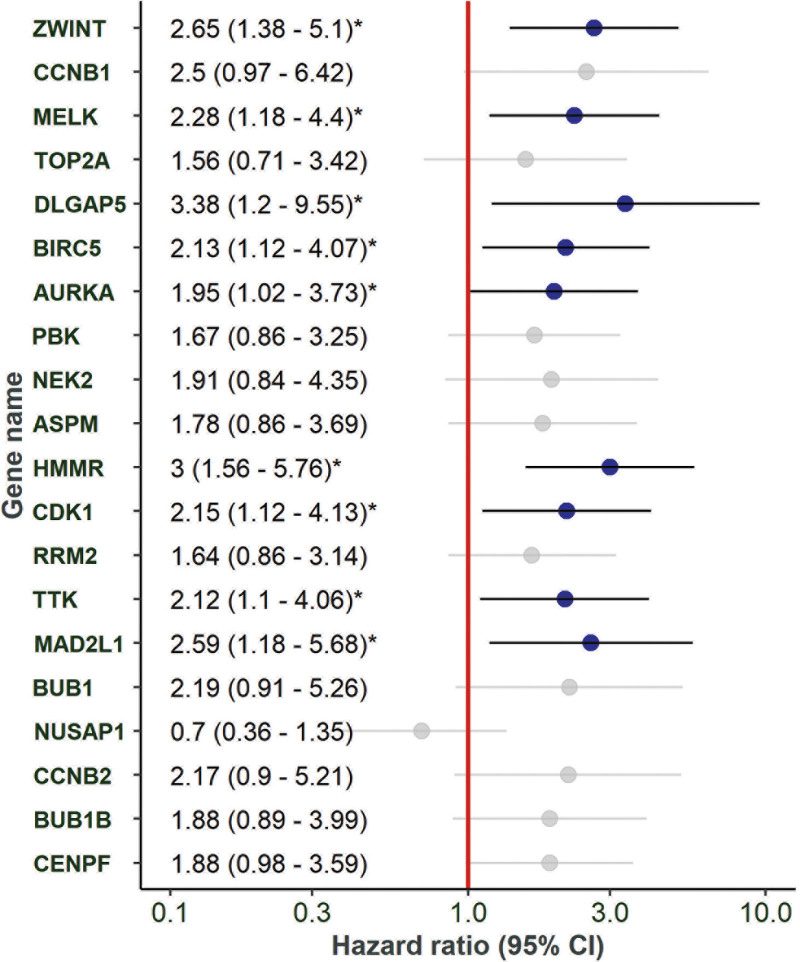
Hepatocellular carcinoma (HCC) is a leading cause of cancer-related deaths globally, with limited treatment options. The goal of this study was to use integrated bioinformatic analysis to find possible biomarkers for prognosis and therapeutic targets for hepatitis B (HBV)-associated HCC. Three microarray datasets (GSE84402, GSE121248, and E-GEOD-19665) from patients with HBV-associated HCC were combined and analyzed. We identified differentially expressed genes (DEGs) and performed pathway enrichment analysis. We constructed protein-protein interaction networks to identify hub genes. We identified a total of 374 DEGs, which included 90 up-regulated and 284 down-regulated genes. Pathway enrichment analysis revealed associations with cell cycle, oocyte meiosis, and the p53 signaling pathway for up-regulated DEGs. Twenty hub genes were identified, and 9 of them (ZWINT, MELK, DLGAP5, BIRC5, AURKA, HMMR, CDK1, TTK, and MAD2L1) were validated using the Cancer Genome Atlas data and Kaplan-Meier survival analysis. These genes were significantly associated with a poor prognosis in HCC patients. Our research shows that ZWINT, MELK, DLGAP5, BIRC5, AURKA, HMMR, CDK1, TTK, and MAD2L1 may be useful for predicting how HBV-associated HCC will progress and for finding new ways to treat it. In addition to these further studies are needed to elucidate the functions of the remaining 11 identified hub genes (RRM2, NUSAP1, PBK, CCNB1, CCNB2, BUB1B, NEK2, CENPF, ASPM, TOP2A, and BUB1) in HCC development and progression.
Copyright © 2024 the Author(s). Published by Wolters Kluwer Health, Inc.
Conflict of interest statement
The authors have no funding and conflicts of interest to disclose.
Figures
Similar articles
-
Screening Hub Genes as Prognostic Biomarkers of Hepatocellular Carcinoma by Bioinformatics Analysis.Cell Transplant. 2019 Dec;28(1_suppl):76S-86S. doi: 10.1177/0963689719893950. Epub 2019 Dec 11. Cell Transplant. 2019. PMID: 31822116 Free PMC article.
-
Identification of 5 Hub Genes Related to the Early Diagnosis, Tumour Stage, and Poor Outcomes of Hepatitis B Virus-Related Hepatocellular Carcinoma by Bioinformatics Analysis.Comput Math Methods Med. 2021 Sep 23;2021:9991255. doi: 10.1155/2021/9991255. eCollection 2021. Comput Math Methods Med. 2021. PMID: 34603487 Free PMC article.
-
[Bioinformatics analysis of core differentially expressed genes in hepatitis B virus-related hepatocellular carcinoma].Zhongguo Xue Xi Chong Bing Fang Zhi Za Zhi. 2022 Nov 21;34(5):507-513. doi: 10.16250/j.32.1374.2021292. Zhongguo Xue Xi Chong Bing Fang Zhi Za Zhi. 2022. PMID: 36464255 Chinese.
-
Identification of most representative hub-genes for diagnosis, prognosis, and therapies of hepatocellular carcinoma.Chin Clin Oncol. 2024 Jun;13(3):32. doi: 10.21037/cco-23-151. Chin Clin Oncol. 2024. PMID: 38984486
-
A comprehensive review and in silico analysis of the role of survivin (BIRC5) in hepatocellular carcinoma hallmarks: A step toward precision.Int J Biol Macromol. 2025 Jun;311(Pt 1):143616. doi: 10.1016/j.ijbiomac.2025.143616. Epub 2025 Apr 28. Int J Biol Macromol. 2025. PMID: 40306500 Review.
Cited by
-
The high expression of Long noncoding RNA TEX41 promotes the proliferation, migration, and invasion of hepatocellular carcinoma.Transl Cancer Res. 2025 May 30;14(5):3175-3185. doi: 10.21037/tcr-2025-812. Epub 2025 May 27. Transl Cancer Res. 2025. PMID: 40530148 Free PMC article.
-
The role and therapeutic value of NUSAP1 in human cancers.J Transl Med. 2025 Jul 2;23(1):725. doi: 10.1186/s12967-025-06746-2. J Transl Med. 2025. PMID: 40605080 Free PMC article. Review.
-
Machine Learning Approach and Bioinformatics Analysis Discovered Key Genomic Signatures for Hepatitis B Virus-Associated Hepatocyte Remodeling and Hepatocellular Carcinoma.Cancer Inform. 2025 Apr 16;24:11769351251333847. doi: 10.1177/11769351251333847. eCollection 2025. Cancer Inform. 2025. PMID: 40291818 Free PMC article. Review.
References
-
- Kao JH, Hu TH, Jia J, et al. . East Asia expert opinion on treatment initiation for chronic hepatitis B. Aliment Pharmacol Ther. 2020;52:1540–50. - PubMed
-
- Yang JD, Mohamed EA, Aziz AO, et al. . Characteristics, management, and outcomes of patients with hepatocellular carcinoma in Africa: a multicountry observational study from the Africa liver cancer consortium. Lancet Gastroenterol Hepatol. 2017;2:103–11. - PubMed
MeSH terms
Substances
LinkOut - more resources
Full Text Sources
Medical
Research Materials
Miscellaneous
