. 2024 Dec 2;221(12):e20240797.
doi: 10.1084/jem.20240797. Epub 2024 Oct 29.

Suppression of melanoma by mice lacking MHC-II: Mechanisms and implications for cancer immunotherapy

Affiliations

Suppression of melanoma by mice lacking MHC-II: Mechanisms and implications for cancer immunotherapy

Hexin Shi et al. J Exp Med. .

Abstract

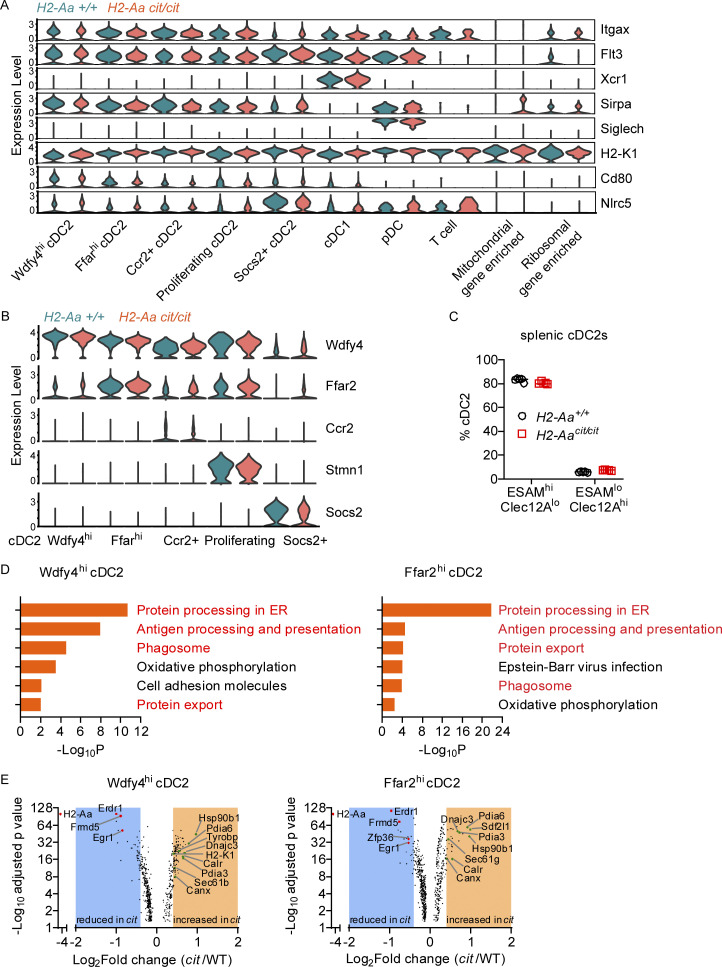
Immune checkpoint inhibitors interfere with T cell exhaustion but often fail to cure or control cancer long-term in patients. Using a genetic screen in C57BL/6J mice, we discovered a mutation in host H2-Aa that caused strong immune-mediated resistance to mouse melanomas. H2-Aa encodes an MHC class II α chain, and its absence in C57BL/6J mice eliminates all MHC-II expression. H2-Aa deficiency, specifically in dendritic cells (DC), led to a quantitative increase in type 2 conventional DC (cDC2) and a decrease in cDC1. H2-Aa-deficient cDC2, but not cDC1, were essential for melanoma suppression and effectively cross-primed and recruited CD8 T cells into tumors. Lack of T regulatory cells, also observed in H2-Aa deficiency, contributed to melanoma suppression. Acute disruption of H2-Aa was therapeutic in melanoma-bearing mice, particularly when combined with checkpoint inhibition, which had no therapeutic effect by itself. Our findings suggest that inhibiting MHC-II may be an effective immunotherapeutic approach to enhance immune responses to cancer.


Conflict of interest statement

Disclosures: B. Beutler reported support from Pfizer Inc. during the conduct of the study; in addition, B. Beutler and H. Shi had U.S. Provisional Patent Application Serial No. 62/702,088 pending. No other disclosures were reported.

Figures

Figure 1.
Figure 1.
Mice with the citation (cit) allele of H2-Aa strongly inhibited melanoma growth. (A) Left panel: B16F10 melanoma volume on day 20 post-injection s.c. of B16F10 cells into the flank of third generation (G3) descendants of a single G1 male mouse, with REF (+/+), HET (+/mutant), or VAR (mutant/mutant) genotypes for H2-Aa (n = 7 B6, 5 REF, 9 HET, 10 VAR). Right panel: Manhattan plot showing −log10(P values) (Y axis) plotted versus chromosomal positions of mutations (X axis) identified in the G1 founder of the affected pedigree using a recessive model of inheritance. Horizontal red or orange lines represent thresholds of P = 0.05 with or without Bonferroni correction, respectively. The strongest mutation–phenotype association is for a mutation in H2-Aa. (B) H2-Aa transcript diagram showing the location of the citation mutation (red asterisk), a G to A transition of the fifth nucleotide of intron 1. Corresponds to 1,128-bp NCBI reference sequence NM_010378.3. (C) RT-PCR analysis of H2-Aa using primers complementary to sequences in exons 1 and 4. No H2-Aa cDNA could be detected in H2-Aacit/cit splenocytes. (D) WT or H2-Aacit/cit splenic B cell (CD19+) MHC-II surface expression detected by flow cytometry. (E–G) Tumor growth curves of B16F10 melanoma (E) (n = 7 +/+, 22 +/cit, 9 cit/cit), YUMM1.G1 melanoma (F) (n = 11 +/+, 14 cit/cit), and MC38 colon carcinoma (G) (n = 10 +/+, 8 cit/cit) after s.c. inoculation on day 0 into the flank of mice. No PD1 antibody was administered. (H) Survival curves of mice after i.v. inoculation with B16F10 melanoma on day 0. Mice were intraperitoneally (i.p.) injected with anti-PD1 or vehicle (PBS) twice per week till the end of the experiment (death or euthanasia) (n = 16–24 per group). (I) Tumor growth curve of B16F10 melanoma in which H2-Aa was knocked out (KO) after s.c. inoculation on day 0 into the flank of mice (n = 7 +/+, 9 cit/cit). (J) Tumor growth curve in the presence of cell depleting antibodies. B16F10 cells were injected s.c. on day 0 into the flank of mice. Anti-CD4, anti-CD8, anti-NK1.1, or control IgG, were injected i.p. into H2-Aacit/cit (cit) mice on days 0, 3, 6, 9, 12, and 15 after tumor inoculation to deplete the corresponding cells (n = 4 per group). (K–M) Frequency of tumor infiltrating lymphocytes (K), CD8 T cells, Treg, tTreg, and pTreg (L), and the phenotype of CD8 T cells (M) in B16F10 tumors collected on day 13 after B16F10 inoculation (n = 4 per group). Data points represent individual mice (A and K–M). Data are representative of one experiment (A) or two independent experiments (C–M). WT littermates (C–M) and WT C57BL/6J mice from JAX (A) were used as controls. Error bars indicate SD (A left panel, K–M) or SEM (E–G, I, and J). P values were determined by Student’s t test (A left panel, K–M), two-way ANOVA with post-hoc Tukey test (E–G, I, and J), or log-rank test (H). *P < 0.05; **P < 0.01; ***P < 0.001; ****P < 0.0001.
Figure S1.
Figure S1.
MHC-II KO recapitulated H2-Aacit/cit tumor inhibition and phenotyping of H2-Aacit/cit mice. (A) Tumor growth curves of B16F10 melanoma after s.c. inoculation on day 0 into the flank of mice (n = 7 or 8 per group). (B) Survival curves of mice after i.v. inoculation with B16F10 melanoma on day 0. Mice were intraperitoneally (i.p.) injected with anti-PD1 twice per week till the end of the experiment (death or euthanasia) (n = 10 per group). (C–K) CD8 T cells (C), CD4 T cells (D), B cells (E), B1 cells (F), NK cells (G), monocytes (H), neutrophils (I), red blood cells (RBC, J), and platelets (K) in H2-Aacit/cit mice and WT littermates. Data were collected by flow cytometric analysis with counting beads (C–I). Data were obtained using a Hemavet 950 (J and K). (L) ELISA analysis of cytokines in the peripheral blood plasma of WT and H2-Aacit/cit mice. Data are representative of two independent experiments (A–K). WT C57BL/6J mice from JAX (A and B) and WT littermates (C–L) were used as controls. Error bars indicate SEM (A) or SD (C–L). P values were determined by two-way ANOVA with post-hoc Tukey test (A), log-rank test (B), or Student’s t test (C–L). Each symbol represents an individual mouse (C–L). n = 4 per group (C–L). *P < 0.05; **P < 0.01; ***P < 0.001; ****P < 0.0001; ns, not significant.
Figure 2.
Figure 2.
H2-Aa–deficient cDC2 are necessary for melanoma inhibition in H2-Aacit/cit mice. Tumor growth curves of B16F10 melanoma after s.c. inoculation on day 0 into the flank of mice. No PD1 antibody was administered. (A and B) Lethally irradiated WT or H2-Aacit/cit (cit) recipients of WT (CD45.1), or H2-Aacit/cit (cit, CD45.2), or a 1:1 mixture of H2-Aacit/cit and WT bone marrow were inoculated with B16F10 cells 12 wk after bone marrow transfer (n = 7 or 8 recipients per group). (C–F) Mice in which H2-Aa was deleted in (C) DC (H2-Aaflox/flox;Cd11c-cre), (D) B cells (H2-Aaflox/flox;Cd19-cre), (E) macrophages (H2-Aaflox/flox;LysM-cre), or (F) cDC1 (H2-Aaflox/flox;Xcr1-cre). (C–F, n = 5–10 mice per group). H2-Aacit/cit;Xcr1-cre mice in F were checked by flow cytometric analysis to confirm the absence of undesired H2-Aa KO in B cells (pre-experiment) and cDC2 cells (post-experiment) to exclude any H2-Aa germline deletion due to Xcr1-cre leakage (Ferris et al., 2020; Lança et al., 2022; Wohn et al., 2020). Data are representative of two independent experiments (A–F). WT C57BL/6J mice from JAX (C–F) were used as controls. Error bars indicate SEM (A–F). P values were determined by two-way ANOVA with post-hoc Tukey test (A–F). *P < 0.05; **P < 0.01; ****P < 0.0001.
Figure 3.
Figure 3.
H2-Aacit/cit cDC2 have increased cross-priming activity. (A–D) Antigen uptake assays of BMDC (n = 4 or 5 per group). Frequency of FITC-positive BMDC (A and B) or CellTrace Violet (CTV)-positive BMDC (C and D) after incubation with FITC-labeled OVA (A and B) or after co-culture with CTV-labeled B16F10 cells (C and D). BMDC were induced from bone marrow cells by GM-CSF (A and C) or Flt3L (B and D). (E and F) In vitro cross-priming by cDC2 (E) and cDC1 (F). Representative flow cytometric histogram plots of CTV-labeled naïve OT-I CD8 T cells after co-culture (3 days) with DC purified from draining lymph nodes on day 6 after inoculation of mice with B16F10-OVA tumors. cDC2 cells were sorted as Lin− CD45+ Ly6C− CD11c+ Xcr1− CD11b+ and cDC1 cells were sorted as Lin− CD45+ Ly6C− CD11c+ Xcr1+ CD11b−. Inset, ratio of peak area for G0, G1, G2, or G3/total peak area (G0+G1+G2+G3). (G) In vivo cross-priming by DC. WT and H2-Aacit/cit mice were injected intravenously with equal amounts of CTV-labeled OT-I CD8 T cells, and 1 day later, recipients received OVA by i.p. injection. 4 days after OVA injection, splenocytes were collected and analyzed by flow cytometry. CTV mean fluorescence intensity (MFI, left), and the total number of OT-I CD8 T cells in the spleen (right). Three mice per group are shown (E–G). Data points represent individual mice (A–G). Data are representative of two independent experiments (A–G). WT littermates were used as controls (A–G). Error bars indicate SD (A–G). P values were determined by Student’s t test (A–G); no differences between genotypes were found in A–D and F. *P < 0.05; **P < 0.01; ***P < 0.001; ****P < 0.0001.
Figure S2.
Figure S2.
Elevated cDC2 cross priming activity, cell counts, and MHC-I expression in H2-Aacit/cit mice. (A) In vitro cross-priming by macrophages. Representative flow cytometric histogram plots of CTV-labeled naïve OT-I CD8 T cells after co-culture (3 days) with macrophages purified from draining lymph nodes on day 6 after inoculation of mice with B16F10-OVA tumors. Macrophages were sorted as Lin− CD45+ CD11b+ F4/80+. Inset: Ratio of peak area for G0, G1, G2, or G3/total peak area (G0+G1+G2+G3). (B and C) In vitro cross-priming by cDC2. CTV-labeled naïve OT-I CD8 T cells were co-cultured (3 days) with OVA (100 μg/ml) and cDC2 purified from Flt3L (100 ng/ml) induced WT or H2-Aacit/cit BMDCs. (B) Representative flow cytometric histogram plots of CTV-labeled naïve OT-I CD8 T cells after co-culture. cDC2 were sorted as Lin− CD45+ Ly6C− CD11c+ CD11bhi Xcr1lo. Right: Ratio of peak area for G0, G1, G2, G3, or G4/total peak area (G0+G1+G2+G3+G4). (C) ELISA analysis of IFNγ secreted by OT-I CD8 T cells after co-culture. (D) The total number of cDC1 in spleens of WT and H2-Aacit/cit mice. (E) The frequencies of splenic cDC1 in mice of the indicated genotypes. (F) Representative flow cytometry plots of pre-cDC in the bone marrow. Bone marrow cells were gated on Lin− CD11c+ CD172a− Flt3+. Unc pre-cDC, uncommitted pre-cDC. (G) Intracellular Irf8 mean fluorescence intensity (MFI) in splenic cDC1. (H) Representative flow cytometry plots of the indicated cDC populations in mesenteric lymph nodes (MLN) of WT and H2-Aacit/cit mice. Cells were gated on Lin− CD45+ Ly6C− CD11c+. (I) The total number of cDC2 in MLN of WT and H2-Aacit/cit mice. (J) MHC-I and CD80 MFI on cDC2. (K) Frequency of H2-Kb-SIINFEKL tetramer positive tumor infiltrated CD8 T cells in WT or H2-Aacit/cit mice on day 9 after s.c inoculation with B16F10-OVA cells. Data points represent individual mice (A–E, G, and I–K). Data are representative of two independent experiments (A–K). WT littermates (A–D and F–K) and WT C57BL/6J (E) from JAX were used as controls. Error bars indicate SD (A–E, G, and I–K). P values were determined by Student’s t test (A–E, G, and I–K). n = 3 per group (A–C, F, and G), n = 4 per group (D, E, and H−K). *P < 0.05; **P < 0.01; ***P < 0.001; ****P < 0.0001.
Figure 4.
Figure 4.
H2-Aa deficiency increased cDC2 and altered their transcriptional program to promote cross-presentation. (A) Representative flow cytometry plots of the indicated cDC populations in spleens of WT and H2-Aacit/cit mice. Cells were gated on Lin− CD45+ Ly6C− CD11c+. (B) The total number of cDC2 in spleens of WT and H2-Aacit/cit mice. (C) MHC-I and CD80 mean fluorescence intensity (MFI) on cDC2. (D and E) Frequency (D) and MHC-I MFI (E) of cDC2 among tumor-infiltrating lymphocytes isolated from B16F10 melanomas collected on day 11 after B16F10 inoculation into the flank of mice. (F) Immunoblot analysis of Nlrc5 in lysates of panDC enriched from spleens of WT and H2-Aacit/cit(cit/cit) mice. α-tubulin was used as a loading control. (G) Uniform Manifold Approximation and Projection (UMAP) clustering of scRNA-seq data from splenic DC sorted from 3 naïve H2-Aacit/cit mice (right) and 3 naïve WT littermates (left), showing 10 color-coded clusters at a resolution of 0.2. (H) Proportion of each cell cluster identified in G. (I) KEGG pathway enrichment analysis of genes significantly increased in H2-Aacit/cit relative to WT Ccr2+ cDC2 (adjusted P ≤ 0.05, n = 410). One-sided hypergeometric test was used to determine the statistical significance of enrichment. (J) Volcano plot showing differentially expressed genes in WT versus H2-Aacit/cit (cit) Ccr2+ cDC2 (adjusted P ≤ 0.05, n = 854). Shaded areas contain genes with Log2Fold change (FC) > 0.4 and Log2FC less than −0.4. Data points represent individual mice with four mice per group (B–E). Data are representative of one experiment (G–J) or two independent experiments (A–F). WT littermates were used as controls (A–H). Error bars indicate SD (B–E). P values were determined by Student’s t test (B–E). *P < 0.05; **P < 0.01; ***P < 0.001. Source data are available for this figure: SourceData F4.
Figure S3.
Figure S3.
scRNA-seq analysis of splenic DCs sorted from WT and H2-Aacit/cit mice. (A and B) Violin plots showing the expression distribution of DC subset-defining markers (A) or cDC2 subset-defining markers (B) in different clusters from Fig. 4 G. (C) Frequencies of ESAMhi or Clec12Ahi splenic cDC2. Data points represent individual mice (n = 5 per group). Error bars indicate SD. No significant difference by Student’s t test. (D) KEGG pathway enrichment analysis of genes significantly increased in H2-Aacit/cit relative to WT Wdfy4hi cDC2 (adjusted P ≤ 0.05, n = 203) and Ffarhi cDC2 (adjusted P ≤ 0.05, n = 261). One-sided hypergeometric test was used to determine statistical significance of enrichment. (E) Volcano plot showing differentially expressed genes in WT versus H2-Aacit/cit (cit) Wdfy4hi cDC2 (n = 570) and Ffarhi cDC2 (n = 688). Adjusted P ≤ 0.05. Shaded areas contain genes with Log2Fold change (FC) >0.4 and Log2FC less than −0.4. Data are representative of one experiment (A, B, D, and E) or two experiments (C). WT littermates were used as controls (A–E).
Figure 5.
Figure 5.
Cell-autonomous regulation of cDC function by MHC-II. (A) Diagram of mixed bone marrow transplantation. A 1:1 mixture of H2-Aacit/cit (CD45.2) or WT (CD45.2) bone marrow cells and congenic WT (CD45.1) bone marrow cells were transferred to lethally irradiated WT (CD45.1) recipients. (B) Representative flow cytometry plots of the indicated cDC populations in spleens of bone marrow chimeric mice. Reduced cDC1 and increased cDC2 frequencies were observed among cDC derived from CD45.2+ H2-Aacit/cit BM (highlighted in red). (C and D) Expression of MHC-I (C) and CD80 (D) on splenic cDC2 from bone marrow chimeric mice. MFI, mean fluorescence intensity. (E) Tumor growth curve of B16F10 melanoma after s.c. inoculation on day 0 into the flank of bone marrow chimeric mice 12 wk after bone marrow transplantation. No PD1 antibody was administered. (F) Body weight relative to weight on the day of bone marrow transplantation (day 0). Data points represent individual mice (C and D). Data are representative of two independent experiments (B–F). WT littermates were used as bone marrow donor controls (B–F). Error bars indicate SD (C, D, and F) or SEM (E). P values were determined by Student’s t test (C and D) or two-way ANOVA with post-hoc Tukey test (E). n = 5 or 6 recipients per group (B–F). *P < 0.05; ****P < 0.0001.
Figure S4.
Figure S4.
Lymphocyte frequencies in mixed bone marrow chimeric mice. (A–E) A 1:1 mixture of H2-Aacit/cit (cit, CD45.2) or WT (CD45.2) bone marrow cells and congenic WT (CD45.1) bone marrow cells were transferred to lethally irradiated WT (CD45.1) recipients (n = 5 or 6 recipients per group). (A) Representative flow cytometry plots of the indicated cDC populations in mesenteric lymph nodes (MLN) of bone marrow chimeric mice. Reduced cDC1 and increased cDC2 frequencies were observed among cDC derived from CD45.2 H2-Aacit/cit BM (cit, highlighted in red). (B) Expression of MHC-I (upper panel) and CD80 (lower panel) on MLN cDC2 from bone marrow chimeric mice. MFI, mean fluorescence intensity. (C and D) Frequencies of B cells, CD4 T cells, CD8 T cells (C), and Treg (D) in the spleens of bone marrow chimeric mice. (E) Frequency of Treg in tumor infiltrating lymphocytes from B16F10 melanoma collected on day 21 after B16F10 inoculation in the flank of bone marrow chimeric mice. (F) Tumor growth curves of B16F10 melanoma after s.c. inoculation on day 0 into the flank of WT mice. Naïve cDC2 cells were intratumorally injected on day 3 (n = 6–8 per group). Data points represent individual mice (B–E). Data are representative of two independent experiments (A–F). Error bars indicate SD (B–E) or SEM (F). P values were determined by Student’s t test (B–E) or two-way ANOVA with post-hoc Tukey test (F). *P < 0.05; **P < 0.01; ****P < 0.0001; ns, not significant.
Figure 6.
Figure 6.
Treg depletion inhibited melanoma growth. B16F10 cells were injected s.c. on day 0 into the flank of mice. No PD1 antibody was administered. (A and B) Tumor growth curve (A) and frequencies of B cells, CD4 T cells, and CD8 T cells in the peripheral blood (B) on day 20 (n = 3–5 per group). (C) Tumor growth curve in the presence of cell depleting antibodies. Anti-CD4, anti-CD8, anti-NK1.1, or control IgG were injected i.p. into WT mice on days 0, 3, 6, 9, 12, and 15 after tumor inoculation to deplete the corresponding cells (n = 5 per group). (D) Tumor growth curve in Foxp3-DTR mice. 1 μg diphtheria toxin (DT) per mouse was injected i.p. on a daily basis for five consecutive days (day −5 to −1) to deplete Treg (Foxp3+ cells) in Foxp3-DTR mice (Foxp3-DTR with DT) (n = 4–8 per group). Data points represent individual mice in B. Data are representative of two independent experiments (A–D). WT C57BL/6J mice from JAX were used as controls (A–D). Error bars indicate SD (B) or SEM (A, C, and D). P values were determined by two-way ANOVA with post-hoc Tukey test (A–D). *P < 0.05; ***P < 0.001.
Figure 7.
Figure 7.
Acute deletion of H2-Aa or Ciita or antibody-mediated blockade of MHC-II inhibited B16F10 melanoma growth. (A–C) Tumor growth curves of B16F10 melanoma after s.c. inoculation on day 0 into the flank of mice. (A) Effect on tumor growth of tamoxifen-induced deletion of H2-Aa in the host. 100 mg tamoxifen/kg body weight was injected i.p. daily on days 5–7 (n = 4 per group). (B) Effect on tumor growth of monoclonal antibody (HB12-18) against MHC-II. Different concentrations of HB12-18 were injected i.p. into WT mice on the indicated days (n = 5 per group). (C) Effect on tumor growth of combined anti-PD1 (10 μg/g body weight) and HB12-18 (25 μg/g body weight) treatment. Antibodies were injected i.p. on days 3, 5, 7, and 10 into WT mice (n = 5 per group). (D) Survival curves of mice after i.v. inoculation with B16F10 melanoma on day 0. WT mice were intraperitoneally (i.p.) injected with HB12-18 (50 μg/g body weight) and anti-PD1 twice per week till the end of the experiment (death or euthanasia) (n = 10 per group). (E) Frequency of tumor infiltrating lymphocytes and CD8 T cells in B16F10 tumors collected on day 11 after B16F10 inoculation. Control IgG or HB12-18 monoclonal antibodies were injected i.p. into WT mice on days 3, 5, 7, and 10 (n = 5 per group). (F) WT mice were s.c inoculated with B16F10 on day 0 and i.p injected with control IgG or HB12-18 on days 3, 5, 7, and 10. On day 11, splenic CD8 T cell and CD4 T cell activation were analyzed by flow cytometry (n = 5 per group). (G) Tumor growth curves of B16F10 melanoma after s.c. inoculation on day 0 into the flank of mice. 100 mg tamoxifen/kg body weight was injected i.p. daily on days 5–7 (n = 7–15 per group). Data are representative of two independent experiments (A–G). WT C57BL/6J mice from JAX were used as controls (A and G). Error bars indicated SEM (A–C and G) or SD (E and F). P values were determined by two-way ANOVA with post-hoc Tukey test (A–C and G), Student’s t test (E and F), or log-rank test (D). Data points represent individual mice (E and F). *P < 0.05; **P < 0.01; ***P < 0.001; ****P < 0.0001.
Figure S5.
Figure S5.
Analysis of the MHC-II monoclonal antibody HB12-18. (A and B) Anti-MHC-II (M5/114, 25 μg/g body weight) or control IgG were injected i.p. into WT mice on days 0, 4, 7, 10, 13, and 16 after B16F10 inoculation on day 0 into the flank of mice (n = 5 per group). (A) Tumor growth curve. (B) Frequencies of myeloid DC (CD11b+CD11c+) in the peripheral blood on day 15. (C) Splenocytes from C57BL/6J, H2-Aacit/cit, or BALB/cJ mice were incubated with different concentrations of HB12-18 (n = 3 per group). MHC-II expression (HB12-18 reactivity) on CD19+ B cells was determined by flow cytometry. MFI, mean fluorescence intensity. (D) WT (CD45.1) mice were injected i.v. with CellTrace Violet (CTV)-labeled OT-I CD8 T cells (CD45.2) and CellTrace Far Red (CTF)-labeled OT-II CD4 T cells (CD45.2), and 1 day later, recipients were mock injected (left panel), or injected i.p. with OVA+IgG (middle panel) or OVA+HB12-18 (200 μg/mouse, right panel) (n = 3 per group). Representative flow cytometry plots of CTV-positive OT-I CD8 T cells (CD45.2) and CTF-positive OT-II CD4 T cells (CD45.2) in the spleens of WT recipients (CD45.1) 4 days after immunization. Data points represent individual mice (B). Data are representative of two independent experiments (A–D). Error bars indicate SD (B and C) or SEM (A). P values were determined by Student’s t test (B) or two-way ANOVA with post-hoc Tukey test (A); no difference between treatments was found in A. ****P < 0.0001.
Figure 8.
Figure 8.
Model of cDC2 cross-presentation regulated by MHC-II deficiency. T cell activation requires engagement of both T cell receptors (TCR) and receptors for costimulatory molecules (e.g., CD28) by, respectively, MHC-peptide complex (p-MHC-I for CD8 T and p-MHC-II for CD4 T and Treg) and costimulatory molecules on DC (e.g., CD80). In WT mice, CD8 T cells (that mediate tumor killing) are typically primed by cDC1 and CD4 T cells (including Treg) are primed by cDC2; the outcome is that WT hosts are usually tolerant to syngeneic tumors and the tumors expand (left). In contrast, reducing or deleting MHC-II expression or function on cDC2 results in the expansion of the cDC2 population, their elevated MHC-I expression, and enhanced cDC2 cross-priming activity, all of which favor CD8 T proliferation. Conversely, the activation and proliferation of Treg are impeded due to the absence of Treg–cDC2 interaction mediated by TCR and p-MHC-II. The net result is tumor growth inhibition (right). MHC-II deficiency could be achieved by monoclonal antibody HB12-18 treatment or CIITA inhibition.

References

    1. Amon, L., Seichter A., Vurnek D., Heger L., Lächele L., Tochoedo N.R., Kaszubowski T., Hatscher L., Baranska A., Tchitashvili G., et al. . 2024. Clec12A, CD301b, and FcγRIIB/III define the heterogeneity of murine DC2s and DC3s. Cell Rep. 43:113949. 10.1016/j.celrep.2024.113949 - DOI - PubMed
    1. Ballesteros-Tato, A., León B., Lund F.E., and Randall T.D.. 2010. Temporal changes in dendritic cell subsets, cross-priming and costimulation via CD70 control CD8(+) T cell responses to influenza. Nat. Immunol. 11:216–224. 10.1038/ni.1838 - DOI - PMC - PubMed
    1. Beura, L.K., Hamilton S.E., Bi K., Schenkel J.M., Odumade O.A., Casey K.A., Thompson E.A., Fraser K.A., Rosato P.C., Filali-Mouhim A., et al. . 2016. Normalizing the environment recapitulates adult human immune traits in laboratory mice. Nature. 532:512–516. 10.1038/nature17655 - DOI - PMC - PubMed
    1. Binnewies, M., Mujal A.M., Pollack J.L., Combes A.J., Hardison E.A., Barry K.C., Tsui J., Ruhland M.K., Kersten K., Abushawish M.A., et al. . 2019. Unleashing type-2 dendritic cells to drive protective antitumor CD4+ T cell immunity. Cell. 177:556–571.e16. 10.1016/j.cell.2019.02.005 - DOI - PMC - PubMed
    1. Bosteels, C., Neyt K., Vanheerswynghels M., van Helden M.J., Sichien D., Debeuf N., De Prijck S., Bosteels V., Vandamme N., Martens L., et al. . 2020. Inflammatory type 2 cDCs acquire features of cDC1s and macrophages to orchestrate immunity to respiratory virus infection. Immunity. 52:1039–1056.e9. 10.1016/j.immuni.2020.04.005 - DOI - PMC - PubMed

MeSH terms

Substances