. 2024 Nov 4;221(11):e20231832.
doi: 10.1084/jem.20231832. Epub 2024 Oct 29.

IMPA1-derived inositol maintains stemness in castration-resistant prostate cancer via IMPDH2 activation

Affiliations

IMPA1-derived inositol maintains stemness in castration-resistant prostate cancer via IMPDH2 activation

Che-Chia Hsu et al. J Exp Med. .

Abstract

Acquisition of prostate cancer stem cells (PCSCs) manifested during androgen ablation therapy (ABT) contributes to castration-resistant prostate cancer (CRPC). However, little is known about the specific metabolites critically orchestrating this process. Here, we show that IMPA1-derived inositol enriched in PCSCs is a key metabolite crucially maintaining PCSCs for CRPC progression and ABT resistance. Notably, conditional Impa1 knockout in the prostate abrogates the pool and properties of PCSCs to orchestrate CRPC progression and prolong the survival of TRAMP mice. IMPA1-derived inositol serves as a cofactor that directly binds to and activates IMPDH2, which synthesizes guanylate nucleotides for maintaining PCSCs with ARlow/- features leading to CRPC progression and ABT resistance. IMPA1/inositol/IMPDH2 axis is upregulated in human prostate cancer, and its overexpression predicts poor survival outcomes. Genetically and pharmacologically targeting the IMPA1/inositol/IMPDH2 axis abrogates CRPC and overcomes ABT resistance in various CRPC xenografts, patient-derived xenograft (PDX) tumor models, and TRAMP mouse models. Our study identifies IMPDH2 as an inositol sensor whose activation by inositol represents a key mechanism for maintaining PCSCs for CRPC and ABT resistance.


Conflict of interest statement

Disclosures: A.J. Armstrong reported personal fees from Pfizer/Astellas, personal fees from AstraZeneca, personal fees from Bayer, personal fees from Novartis, grants from BMS, and personal fees from Merck during the conduct of the study. J. Huang reported personal fees from Kingmed Diagnostics, personal fees from Artera, and personal fees from York Biotechnology outside the submitted work. H.-K. Lin reported personal fees from Stablix, Inc. outside the submitted work. No other disclosures were reported.

Figures

None
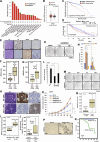
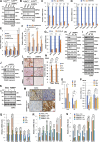
Graphical abstract
Figure 1.
Figure 1.
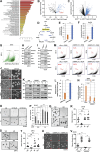
IMPA1/inositol axis is enriched in ALDH-positive PCSCs and maintains prostate cancer stemness. (A and B) Dot plots show the upregulation of genes and metabolites in ALDHhigh compared with ALDHlow/− of PC3 cells. PC3 cells were isolated using FACS based on ALDH expression. (C) Metabolic profiling of PC3 or DU145 cells expressing shLuc or shIMPA1 was revealed by targeted mass spectrometry analysis of phosphoinositides metabolism including inositol (Ins), PI, inositol 1,3,4-trisphosphate (IP3), phosphatidylinositol 3-phosphate (PIP), and inositol 4-phosphate (IP). Each metabolite in the shIMPA1 group was normalized by shLuc showing relative peak intensity. The mean ± SEM showed three independent experiments for each group. *, P < 0.05; **, P < 0.01 by two-tailed unpaired t test. (D) The level of inositol of PC3 cells stably expressing shLuc or IMPA1-two specific shRNA lentivirus (#1 and #2) was determined using a K-INOSL assay kit according to the manufacturer’s instructions. The inositol levels were normalized by protein concentration in each experimental group. The mean ± SEM showed three independent experiments for each group. *, P < 0.05; **, P < 0.01 by two-tailed unpaired t test. (E) Spheres from LNCaP, PC3, DU145, and TRAMP-C2 stably expressing shLuc or IMPA1-two specific shRNA lentivirus (#1 and #2) were shown. Scale bar, 200 μm. (F–I) Quantification of the number of spheres from E was shown for LNCaP (F), PC3 (G), DU145 (H), and TRAMP-C2 (I). The mean ± SEM showed three independent experiments for each group. **, P < 0.01; ***, P < 0.001 by two-tailed unpaired t test. (J–M) Immunoblotting of LNCaP (J), PC3 (K), DU145 (L), and TRAMP-C2 (M) cells stably expressing shLuc or shIMPA1 (#1 and #2) with indicated antibodies. Immunoblotting data were verified in at least two independent experiments. Source data are available for this figure: SourceData F1.
Figure S1.
Figure S1.
Inositol decline by IMPA1 loss impairs cancer sphere formation and ALDHhigh PCSCs. (A) Gene ontology enrichment analysis reveals the upregulated metabolism pathways in ALDH-positive (ALDHhigh) PC3 cells compared with ALDH-negative (ALDHlow/−) PC3 cells. (B and C) Volcano plot shows upregulation of genes and metabolites in ALDHhigh compared with ALDHlow/− of LNCaP cells. LNCaP cells were isolated using FACS based on ALDH expression. (D) The graph represents the pathway of the PI cycle. (E) The graph represents the expression levels of IMPA1 from DNA microarray in ALDHhigh and ALDHlow/− PC3 cells. (F) The levels of inositol from metabolomics in ALDHhigh and ALDHlow/− of PC3 cells. (G) Dot plot of sorted ALDHhigh and ALDHlow/− 22RV1 cells population. (H) Immunoblotting of ALDHlow/− and ALDH+ 22RV1 cells from cell sorting using ALDEFLUOR kit with indicated antibodies. Immunoblotting data were verified in at least two independent experiments. (I) Immunoblotting of ALDHhigh and ALDHlow/− LNCaP cells from cell sorting using ALDEFLUOR kit with indicated antibodies. Immunoblotting data were verified in at least two independent experiments. (J) The phase contrast shows the images of adherent and spheroid PC3, DU145, and 22RV1 cells. Scale bar, 100 μm. (K) Immunoblotting of adherent and spheroid PC3, DU145, and 22RV1 cells. Immunoblotting data were verified in at least two independent experiments. (L) The graph represents relative mRNA expression levels of IMPA1 in adherent and spheroid PC3 cells. (M) 22RV1 cells stably expressing shLuc, shIMPA1 (#1 and #2) incubated with ALDEFLUOR for 45 min. FACS profiles represent DEAB control and ALDH staining in each group. The gate (P3) was set according to DEAB control. (N) Quantification of relative ALDH positive cells normalized by DEAB control according to the gate (P3) from J is shown as the mean ± SEM of three independent experiments for each group. **, P < 0.01 by two-tailed unpaired t test. DEAB, ALDH inhibitor. (O) Spheres from DU145 upon vehicle (Veh), 25 μM of inositol (Ins), or 50 and 500 μM of LiCl treatment for 4 days. Scale bar, 100 μm. (P) Quantification of number of spheres from DU145 (O) was shown as the mean ± SEM of three independent experiments for each group. *, P < 0.05; **, P < 0.01; ***, P < 0.001 by two-tailed unpaired t test. (Q and S) Sphere forming cells from DU145 (N) and 22RV1 (P) upon vehicle (Veh), inositol (Ins), 500 μM of LiCl, 10 μM of SB216763 or BIO treatment. Scale bar, 100 μm. (R and T) Quantification of the size of spheres for R and T from DU145 (Q) and 22RV1 (S) upon the vehicle or 10 μM of inositol (Ins) treatment was shown as the mean ± SEM of three independent experiments for each group. ***, P < 0.001; NS, non-significant by two-tailed unpaired t test. (U) Spheres from DU145 stably expressing shLuc or IMPA1-two specific shRNA lentivirus (#1 and #2) upon vehicle (Veh) or 25 μM of inositol treatment (Ins). Scale bar, 100 μm. (V) Quantification of the size of spheres shown in R. At least five images of phase contrast were randomly captured, followed by using ImageJ software analysis. **, P < 0.01 by two-tailed unpaired t test. Source data are available for this figure: SourceData FS1.
Figure S2.
Figure S2.
IMPA1/inositol/IMPDH2 pathway maintains the proliferation of ALDHhigh cells, but not ALDHlow/− cells. (A and B) Dot plot of sorted ALDHhigh and ALDHlow/− LNCaP (A) and TRAMP-C2 (B) cells population. (C and D) Inositol levels were determined by K-INOSL assay kit according to the manufacturer’s instructions. The inositol levels were normalized by protein concentration in each experimental group. Three independent experiments were performed. *, P < 0.05; **, P < 0.01 by two-tailed unpaired t test. Immunoblotting of ALDHhigh and ALDHlow/− LNCaP cells and ALDHhigh and ALDHlow/− TRAMP-C2 cells with indicated antibodies. (E–H) Colony formation of ALDHhigh (E and G) and ALDHlow/− (F and H) LNCaP cells and TRAMPC-C2 cells upon shLuc and shIMPA1 (#1 and #2). Immunoblotting of ALDHhigh (E and G) and ALDHlow/− (F and H) LNCaP cells and TRAMP-C2 cells stably expressing shLuc and shIMPA1 (#1 and #2). (I–L) Quantification of number of colonies of ALDHhigh (I and J) and ALDHlow/− (K and L) LNCaP cells (I and K) and TRAMPC-C2 cells (J and L). The data are shown as the mean ± SEM of three independent experiments for each group. **, P < 0.01; ***, P < 0.001; NS, non-significant by two-tailed unpaired t test. (M) Cancer sphere formation in ALDHhigh LNCaP and ALDHhigh TRAMP-C2 cells upon shLuc, shIMPA1 #1 and shIMPDH2 #1. Scale bar, 100 μm. (N and O) Quantification of cancer sphere formation of ALDHhigh LNCaP cells (N) and ALDHhigh TRAMP-C2 cells (O) from M. The data are shown as the mean ± SEM of three independent experiments for each group. **, P < 0.01; ***, P < 0.001 by two-tailed unpaired t test. (P and Q) Immunoblotting of ALDHhigh and ALDHlow/− LNCaP (P) and TRAMP-C2 (Q) cells stably expressing shLuc, shIMPA1 #1, or shIMPDH2 #1 with indicated antibodies. Immunoblotting data were verified in at least two independent experiments. (R and S) Colony formation of ALDHhigh or ALDHlow/− LNCaP (R) and TRAMP-C2 (S) cells stably expressing shLuc, shIMPA1 #1, or shIMPDH2 #1 upon vehicle, 80 μM of inositol (Ins), and 80 μM of guanosine (Gua) treatment. (T–W) Quantification of number of colonies of ALDHhigh (T and U) or ALDHlow/− (V and W) LNCaP (T and V) and TRAMP-C2 (U and W) cells upon shLuc, shIMPA1 #1, shIMPDH2 #1 with vehicle, 80 μM of inositol (Ins), and 80 μM of guanosine (Gua) treatment from R and S. The data were shown as the mean ± SEM of three independent experiments for each group. *, P < 0.05; **, P < 0.01; ***, P < 0.001 by two-tailed unpaired t test. Source data are available for this figure: SourceData FS2.
Figure 2.
Figure 2.
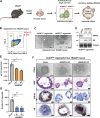
IMPA1-derived inositol is required for maintaining ALDHhigh PCSCs and 3D prostate tumor organoids from CRPC TRAMP mouse model. (A) The flow chart shows an experimental outline to demonstrate the tumor-initiating ability of ALDHhigh cells sorted from LNCaP or PC3 cells stably expressing shLuc or shIMPA1 (#1 and #2), followed by transplanting 104, 103, and 102 cells into male nude mice for each group. (B and C) The image of tumor formation from limiting dilution transplantation using LNCaP (B) and PC3 (C) cells. (D and E) Table outlining differences in tumor-initiating frequency of ALDHlow/− or ALDHhigh LNCaP cells (D) and PC3 cells (E) upon limiting dilution transplantation. Tumors arose from transplantation of 104, 103, and 102 ALDHlow/− or ALDHhigh LNCaP cells upon IMPA1 loss. Tumor-initiating frequency was calculated by the ELDA software application for limiting dilution analysis (Hu and Smyth, 2009). (F) The flow chart shows prostate tumor organoids are established from male TRAMP mice, followed by infection with lentivirus shRNAs of IMPA1. (G) Representative images show the growth of prostate tumor organoids from male TRAMP mice at the age of 6 mo with indicated days. Scale bar, 200 μm. (H) H&E staining and IHC staining with IMPA1 antibody of prostate organoids from WT and TRAMP mice at the age of 6 mo. Scale bar, 100 μm for H&E staining; 50 μm for IHC staining. (I) Immunoblotting of tumor organoids from male TRAMP mice with indicated antibodies. Immunoblotting data were verified in at least two independent experiments. (J) Representative images of tumor organoids expressing shLuc or shIMPA1 (#1, #2 and #3) from male TRAMP mice. Scale bar, 200 μm. (K) Quantification of number of tumor organoids from J was shown as the mean ± SEM of three independent experiments for each group. ***, P < 0.001 by two-tailed unpaired t test. (L) Tumor organoids from male TRAMP mice expressing shLuc or shIMPA1 with vehicle (Veh) or 25 μM of inositol (Ins) treatment. Scale bar, 200 μm. (M) Quantification of the number of tumor organoids from L for TRAMP mice was shown as the mean ± SEM of three independent experiments for each group. **, P < 0.01; ***, P < 0.001 by two-tailed unpaired t test. Source data are available for this figure: SourceData F2.
Figure 3.
Figure 3.
IMPA1/inositol maintains ALDHhigh organoids with AR low expression from TRAMP mouse model. (A) The flow chart shows an experimental outline to demonstrate ALDHhigh tumor organoids sorted from TRAMP mouse. (B) Dot plot of sorted ALDHhigh and ALDHlow/− cell population from TRAMP mouse. (C) The phase contrast shows the images of sorted ALDHhigh and ALDHlow/− organoids from TRAMP mouse. Scale bar, 50 μm. (D) Immunoblotting of ALDHhigh and ALDHlow/− organoids from TRAMP mouse with indicated antibodies. Immunoblotting data were verified in at least two independent experiments. (E) Inositol levels were determined by K-INOSL assay kit. The inositol levels were normalized by protein concentration in each experimental group. Three independent experiments were performed. *, P < 0.05; **, P < 0.01 by two-tailed unpaired t test. (F) The phase contrast shows the images of ALDHhigh organoids upon shLuc, shIMPA1 (#1 and #2). Scale bar, 50 μm. H&E staining and IHC analysis of ALDHhigh organoids upon shLuc, shIMPA1 (#1 and #2) with indicated antibodies. Scale bar, 20 μm. (G) Quantification of ALDHhigh organoids upon shLuc, shIMPA1 #1 and shIMPA1 #2. The data were shown as the mean ± SEM of three independent experiments for each group. **, P < 0.01 by two-tailed unpaired t test. Source data are available for this figure: SourceData F3.
Figure S3.
Figure S3.
Inositol directly maintains cancer stemness in prostate cancer spheres and tumor organoids independently of its downstream PI cycle. (A) Spheres from DU145 stably expressing Flag vector or Flag-IMPA1 lentivirus. Scale bar, 100 μm. (B) The cell lysates of spheres from DU145 stably expressing Flag vector or Flag-IMPA1 lentivirus were subjected to immunoblotting with indicated antibodies. (C) Quantification of number of spheres from DU145 (A) was shown as the mean ± SEM of three independent experiments for each group. **, P < 0.001 by two-tailed unpaired t test. (D) Representative images of spheres from DU145 and 22RV1 upon 1, 2.5, 5, and 10 μM of inositol treatment for 4 days. Scale bar, 150 μm. (E–H) Quantification of the size and number of spheres from DU145 (E and G) and 22RV1 (F and H) upon the vehicle or 10 μM of inositol (Ins) treatment is shown as the mean ± SEM of three independent experiments for each group. **, P < 0.01 by two-tailed unpaired t test. (I) Illustration of cDNA sequence of IMPA1 targeted by the gRNA pairs. (J) Photographs of spheres from 22RV1 cells stably expressing shLuc or shIMPA1 upon the treatment of vehicle (Veh), 25 μM of inositol (Ins), 4 μM of PI, phosphatidylinositol 4-phosphate (PIP), phosphatidylinositol 4,5-bisphosphate (PIP2), phosphatidylinositol 3,4,5-trisphosphate (PIP3), 25 μM of inositol 1,3,4-trisphosphate (IP3), inositol 1,4-bisphosphate (IP2), or inositol 4-phosphate (IP). Immunoblotting of 22RV1 cells stably expressing shLuc or shIMPA1 with indicated antibodies. Scale bar, 100 μm. (K) Quantification of the number of spheres from 22RV1 (J) was shown as the mean ± SEM of three independent experiments for each group. *, P < 0.05; **, P < 0.01; NS, non-significant by two-tailed unpaired t test. (L) Tumor organoids from TRAMP expressing shLuc or shIMPA1 upon the treatment of vehicle (Veh) or 25 μM of inositol (Ins), 4 μM of PI, phosphatidylinositol 4-phosphate (PIP), phosphatidylinositol 4,5-bisphosphate (PIP2), phosphatidylinositol 3,4,5-trisphosphate (PIP3), 25 μM of inositol 1,3,4-trisphosphate (IP3), inositol 1,4-bisphosphate (IP2) or inositol 4-phosphate (IP) were shown. Scale bar, 100 μm. (M) Quantification of the number of tumor organoids from TRAMP was shown as the mean ± SEM of three independent experiments for each group. **, P < 0.01; NS, non-significant by two-tailed unpaired t test. (N) Immunoblotting of DU145 cells stably expressing shLuc, shIMPA1, shCDIPT, shPI4K2α, shPLCβ1, or shINPP1 with indicated antibodies. (O) Photographs of spheres from DU145 cells stably expressing shLuc, shIMPA1, shCDIPT, shPI4K2α, shPLCβ1, or shINPP1. Scale bar, 100 μm. (P) Quantification of the number of spheres from DU145 (O) was shown as the mean ± SEM of three independent experiments for each group. *, P < 0.05; ***, P < 0.001; NS, non-significant by two-tailed unpaired t test. (Q) The images of the EM represent the cell membrane from DU145 cells stably expressing shLuc and shIMPA1 (#1 and #2). The red arrow indicates cell membrane. (R) Insulin levels were determined by human insulin ELISA kit (Elabscience) in ALDHhigh LNCaP cells upon shLuc and shIMPA1 (#1 and #2). NS, non-significant. (S and T) The levels of dopamine (S) and glutamine (T) were determined by LC-MC/MS in 22RV1 cells upon shLuc and shIMPA1 (#1 and #2). NS, non-significant. Triplicate samples in each group were performed for LC-MS/MS. Source data are available for this figure: SourceData FS3.
Figure 4.
Figure 4.
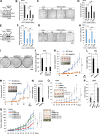
IMPA1/inositol promotes PCSCs, anchorage-independent growth, and tumorigenicity of CRPC in vivo. (A and E) Immunoblotting of DU145 (A) and 22RV1 (E) scramble (Scram.) or IMPA1 knockout (KO) cells by CRISPR/Cas9 upon Flag vector, Flag-IMPA1 (WT), and Flag-IMPA1 D220A (D220A) overexpression with indicated antibodies. Immunoblotting data were verified in at least two independent experiments. (B and F) The levels of inositol in DU145 (B) and 22RV1 (F) scramble (Scram.) or IMPA1 knockout by CRISPR/Cas9 cells upon Flag vector, Flag-IMPA1 (WT), and Flag-IMPA1 D220A (D220A) overexpression were determined by K-INOSL assay kit. The inositol levels were normalized by protein concentration in each experimental group. Three independent experiments were performed for the statistic of two-tailed unpaired t test. **, P < 0.01; NS, non-significant; ***, P < 0.001 by two-tailed unpaired t test. (C and G) Representative images of spheres from DU145 (C) and 22RV1 (G) scramble (Scram.) or IMPA1 knockout cells upon Flag vector, Flag-IMPA1 (WT), and Flag-IMPA1 D220A (D220A) overexpression. Scale bar, 100 μm. (D and H) Quantification of the number of spheres from DU145 (D) and 22RV1 (H) is shown as the mean ± SEM of three independent experiments for each group. **, P < 0.01; ***, P < 0.001; NS, non-significant by two-tailed unpaired t test. (I) Soft agar assay is shown in PC3 cells stably expressing shLuc or IMPA1-two specific shRNA lentivirus (#1 and #2). (J) Quantification of the number of colonies formation in soft agar by ImageJ in I is shown as the mean ± SEM of three independent experiments for each group. **, P < 0.01 by two-tailed unpaired t test. (K and M) Tumorigenicity of PC3 (K) or DU145 (M) cells stably expressing shLuc or shIMPA1 was determined by tumor volume. At least four xenograft tumors in each group were quantified. **, P < 0.001 by two-tailed unpaired t test. (L and N) Tumor weight from PC3 (L) or DU145 (M) cells stably expressing shLuc or shIMPA1 was measured at day 48 (L) and day 38 (N). At least four xenograft tumors in each group were quantified. **, P < 0.01 by two-tailed unpaired t test. (O) Nude mice subcutaneously injected with 22RV1 cells stably expressing shLuc or shIMPA1 were intraperitoneally injected with vehicle or 30 mg/kg of inositol every 2 days until 41 days, and tumor volume was measured with indicated days. At least five xenograft tumors in each group were quantified. **, P < 0.001; ***, P < 0.001 by two-tailed unpaired t test. (P) Tumor weight from 22RV1 cells stably expressing shLuc or shIMPA1 upon intraperitoneal injection with vehicle or 30 mg/kg of inositol every 2 days at day 41 was measured. At least five xenograft tumors in each group were quantified. **, P < 0.01; ***, P < 0.001 by two-tailed unpaired t test. (Q) Nude mice subcutaneously injected with DU145 cells stably expressing shLuc or shIMPA1 (#1 and #2) were intraperitoneally injected with vehicle or 50 mg/kg of inositol every 2 days until 34 days, and tumor volume was measured with indicated days. At least four xenograft tumors in each group were quantified. *, P < 0.05; **, P < 0.01 by two-tailed unpaired t test. Source data are available for this figure: SourceData F4.
Figure 5.
Figure 5.
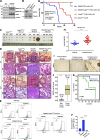
Impa1 deficiency abrogates CRPC progression in TRAMP mouse model and IMPA1/inositol is upregulated in prostate cancer patients and CRPC patients and correlates with poor survival outcome. (A) Immunoblotting of prostate tissue from male C57BL/6J WT (n = 3) and TRAMP (n = 3) mice of 8 mo with indicated antibodies. LE, long exposure; SE, short exposure. Immunoblotting data were verified in at least two independent experiments. (B) Immunoblotting of prostate tissue from Impa1FL/FL and Impa1FL/FL/PB-Cre4 with indicated antibodies. Impa1FL/FL, Impa1FL/FL/PB-Cre4, TRAMP/PB-Cre4, and TRAMP/Impa1FL/FL/PB-Cre4 mice were generated from four generations of backcrossing to maintain in C57BL/6J background. All mice were intercrossed to generate pups, followed by genotyping to group the age-matched mice for each experimental group. Immunoblotting data were verified in at least two independent experiments. (C) Representative images of AP, VP, and DLP lobes of the prostate from Impa1FL/FL, Impa1FL/FL/PB-Cre4, TRAMP/PB-Cre4, and TRAMP/Impa1FL/FL/PB-Cre4 mice at the age of 7 mo. (D) H&E staining of AP and DLP lobes of prostate from Impa1FL/FL, Impa1FL/FL/PB-Cre4, TRAMP/PB-Cre4, and TRAMP/Impa1FL/FL/PB-Cre4 mice at the age of 7 mo with 4× and 10× magnification (three mice for each group). Scale bar for 4× magnification, 500 μm; scale bar for 10× magnification, 100 μm. (E) ALDH1A1 cell population from the prostate tissue of WT, TRAMP/PB-Cre4 or TRAMP/Impa1FL/FL/PB-Cre4 mice was determined by flow cytometry analysis using isotype and ALDH1A1 antibody. (F) The percentage of ALDH1A1 (ALDHhigh) cells from prostate tissue was quantified from E shown as the mean ± SEM of three independent experiments for each group (three mice for each group). TRAMP, TRAMP/PB-Cre4 mice, and TRAMP/Impa1 KO, TRAMP/Impa1FL/FL/PB-Cre4 mice. ***, P < 0.001 by two-tailed unpaired t test. (G) Kaplan–Meier survival plots of Impa1FL/FL, Impa1FL/FL/PB-Cre4, TRAMP/PB-Cre4, and TRAMP/Impa1FL/FL/PB-Cre4 mice (15 mice for each group). P < 0.0001 by log–rank test. (H) The levels of inositol in the sera of normal male people (n = 20) and prostate cancer patients (n = 29) were determined by K-INOSL assay kit. ***, P < 0.001 by two-tailed unpaired t test. (I) IMPA1 protein expression from adjacent normal and prostate cancer patient with low or high Gleason score in our in-house prostate cancer samples was determined by IHC staining. Scale bar, 20 μm. (J) Box plot represents IMPA1 expression in adjacent normal (80 cases) and prostate cancer patients with high Gleason score and advanced stage (80 cases). ***, P < 0.001 by Mann–Whitney U test. (K) Disease-specific survival outcome with IMPA1 low or high expression was shown by Kaplan–Meier plots in prostate cancer patients with high Gleason score and advanced stage (80 cases). **, P = 0.0091 by long–rank test. Source data are available for this figure: SourceData F5.
Figure S4.
Figure S4.
IMPA1 and IMPDH2 are upregulated in prostate cancer patients correlated with poor survival outcome. (A) The frequency of alteration of IMPA1 gene in human prostate cancers. The representative data obtained from cBioPortal (https://www.cbioportal.org) representing a combined study of 4,104 samples, querying 3,886 prostate cancer patients in 16 studies are shown by a bar graph. (B) The bar graph represents the relative expression of IMPA1 in normal tissues (152) and prostate cancers (492) from the GEPIA database. P < 0.01. (C) The overall survival of prostate cancer patients with IMPA1 altered group (121 cases) and IMPA1 unaltered group (1,157 cases). The representative data also obtained from cBioPortal (https://www.cbioportal.org) representing a combined study of 4,104 samples, querying 3,886 prostate patients in 16 studies as shown by overall survival Kaplan–Meier plot. The median months overall survival of the IMPA1 altered group and IMPA1 unaltered group are 97 and 141 mo, respectively. Long–rank test P value = 3.69e−8. (D) The overall survival Kaplan–Meier plot of prostate cancer patients with IMPA1 high and low expression from the database of PrognoScan. Long–rank test P value = 0.045595. (E) Prostate tissue from AR+ metastatic prostate cancer and ARlow/− metastatic prostate cancer patients in our in-house prostate cancer samples were determined by IHC staining with indicated antibodies. Scale bar, 100 μm. (F and G) Box plot represents IMPA1 (F) and IMPDH2 (G) expression in AR+ metastatic prostate cancer (20 cases) and AR metastatic prostate cancer (20 cases). ***, P < 0.001 by Mann–Whitney U test. (H) Prostate tissue from AR+ CRPC and ARlow/− CRPC in our in-house prostate cancer samples were determined by IHC staining with indicated antibodies. Scale bar, 200 μm. (I) Box plot represents IMPA1 expression levels by H-score in AR+ CRPC (n = 5) and ARlow/− CRPC (n = 15) prostate cancer patients. ***, P < 0.001 (AR+ CRPC versus ARlow/- CRPC) by Mann–Whitney U test. (J) Inositol levels were determined by LC-MS/MS in the prostate tissues of the patients without or with the development to CRPC. ***, P < 0.001 (patients without CRPC versus patient with CRPC) by Mann–Whitney U test. (K) Soft agar assay shown in 22RV1 cells stably expressing shLuc or shIMPDH2 (#1 and #2). (L) Quantification of the number of colonies from 22RV1 by ImageJ shown in K. The data were shown as the mean ± SEM of three independent experiments for each group. *, P < 0.05; **, P < 0.01 by two-tailed unpaired t test. (M) Soft agar assay shown in 22RV1 cells stably expressing shLuc or shIMPDH2 upon the treatment of 40 μM of guanosine (Gua), 40 μM of inositol (Ins) or 40 μM of adenosine (Ade) for 20 days. (N) Quantification of the number of colonies from 22RV1 by ImageJ shown in M. The data were shown as the mean ± SEM of three independent experiments for each group. *, P < 0.05; **, P < 0.01 by two-tailed unpaired t test. (O) Male nude mice subcutaneously injected with 22RV1 cells stably expressing shLuc or shIMPDH2 were intraperitoneally injected with 30 mg/kg of inositol (Ins) or 30 mg/kg of guanosine (Gua) every 2 days until 39 days, and tumor volume was measured with indicated days. Four mice were included in each experimental group. (P) IMPDH2 protein expression from adjacent normal and prostate cancer patients with high Gleason scores, and advanced stage in our in-house prostate cancer samples was determined by IHC staining. Scale bar, 20 μm. (Q) Box plot represents IMPDH2 expression in adjacent normal (80 cases) and prostate cancer patients with high Gleason score and advanced stage (80 cases). ***, P < 0.001 by Mann–Whitney U test. (R) Disease-specific survival outcome with IMPDH2 low or high expression was shown by Kaplan–Meier plots in prostate cancer patients with high Gleason score and advanced stage (80 cases). *, P = 0.0171 by long–rank test.
Figure 6.
Figure 6.
Inositol maintains IMPDH2 oligomerization, directly binds to IMDPH2, and activates IMPAH2 activity, thereby promoting guanylate purine metabolism. (A) The cell lysates from PC3 cells were incubated with biotin or biotin-labeled inositol, and inositol-interacting proteins were pulled down by streptavidin beads and subjected to mass spectrometry. (B) The cell lysates from PC3 cells were incubated with 40 μM of biotin or biotin-labeled inositol, pulled down with streptavidin beads and subjected to immunoblotting with IMPDH2 antibody. Immunoblotting data were verified in at least two independent experiments. (C) GST and GST-IMPDH2 full length (FL) were expressed in Escherichia coli BL21 cells and immobilized on Glutathione-Sepharose. 2 μg of these recombinant proteins were incubated with 40 μM of biotin or biotin-labeled inositol (Biotin-Ins) for 3 h, followed by pulled down with streptavidin beads. The interaction was determined by immunoblotting with indicated antibodies. The purity of the recombinant proteins was resolved by SDS-PAGE, followed by Coomassie blue staining. (D) The illustration of the IMPDH2 full length (1–514 aa), the N-terminal (1–111 aa), CBS (111–232 aa), and C-terminal (232–514 aa). (E) GST-IMPDH2 N-terminal, GST-IMPDH2 C-terminal, and GST-CBS domain from IMPDH2 were expressed in Escherichia coli BL21 cells and immobilized on Glutathione-Sepharose. 2 μg of these recombinant proteins was incubated with 40 μM of biotin or biotin-labeled inositol (Biotin-Ins) for 3 h, followed by pulled down with streptavidin beads. The interaction was determined by immunoblotting with indicated antibodies. The purity of the recombinant proteins was resolved by SDS-PAGE, followed by Coomassie blue staining. Immunoblotting data were verified in at least two independent experiments. (F) 22RV1 cell lysates upon shLuc and shIMPA1(#1 and #2) were subjected to crosslinking by bismaleimidohexane (BHM), followed by immunoblotting with IMPDH2 antibody. The input levels of IMPA1, IMPDH2, and GAPDH were represented without crosslinking. Immunoblotting data were verified in at least two independent experiments. (G) 22RV1 cell lysates upon shLuc and shIMPA1(#2) with the treatment of vehicle and 100 μM of inositol were subjected to cross-link by bismaleimidohexane (BHM), followed by immunoblotting with IMPDH2 antibody. The input levels of IMPA1, IMPDH2, and GAPDH were represented without cross-link. Immunoblotting data were verified in at least two independent experiments. (H) Recombinant IMPDH2 protein incubated with vehicle and 100, 200 μM of inositol were subjected to cross-link by BMH, followed by immunoblotting with IMPDH2 antibody. The input levels of IMPDH2 were represented without cross-link. Immunoblotting data were verified in at least two independent experiments. (I) The illustration of the IMPDH2 full length (IMPDH2FL), truncated 41–43 aa of IMPDH2 (IMPDH2Δ41–43) and truncated 279–281 aa of IMPDH2 (IMPDH2Δ279–281). (J) Recombinant proteins, GST- IMPDH2FL, GST-IMPDH2Δ41–43 and GST-IMPDH2Δ279–281, were subjected to biotin and biotin-labeled inositol pull-down assay, followed by immunoblotting with GST antibody. Coomassie blue indicates the equal amount of recombinant proteins in each group. Immunoblotting data were verified in at least two independent experiments. (K) Recombinant GST- IMPDH2FL protein were subjected to 40 μM of biotin and 40 μM of biotin-labeled inositol pull-down assay upon adding 1 mM of IMP, 75 nM of MPA and excessive 500 μM of inositol, followed by immunoblotting with IMPDH2 antibody. Immunoblotting data were verified in at least two independent experiments. (L) 22RV1 cell lysates were subjected to biotin and biotin-labeled inositol pull-down assay, followed by immunoblotting with indicated antibodies. Immunoblotting data were verified in at least two independent experiments. (M) Immunoblotting of various prostate cancer cell lines with indicated antibodies. Immunoblotting data were verified in at least two independent experiments. (N) Schematic representation of purine metabolism with a series of enzymes and metabolites. (O and P) The activity of IMPDH was measured in DU145 (O) and PC3 (P) stably expressing shLuc or shIMPA1 (#1 and #2) upon 10 μM of MPA treatment by using IMPDH activity assay kit. The detailed procedure is described in Materials and methods. The activity was normalized by protein concentration in each experimental group. The data were shown as the mean ± SEM of three independent experiments for each group. *, P < 0.05; **, P < 0.01 by two-tailed unpaired t test. (Q) The activity of IMPDH was measured in DU145 cells stably expressing shLuc or shIMPA1 upon 25 μM of inositol (Ins) treatment by using IMPDH activity assay kit. The data were shown as the mean ± SEM of three independent experiments for each group. *, P < 0.05; **, P < 0.01 by two-tailed unpaired t test. (R) In vitro IMPDH2 activity using IMPDH activity assay kit was determined by incubation recombinant IMPDH2 protein with 40 μM of inositol (Ins) or 10 μM of MPA with indicated time. (S) Targeted metabolomics of PC3 cells expressing shLuc or shIMPA1 upon 25 μM of inositol (Ins) treatment was performed to measure the levels of purine metabolism including guanosine, xanthosine, cGMP, GDP, xanthine, GTP, Urate. The data were shown as the mean ± SEM of three independent experiments for each group. *, P < 0.05; **, P < 0.01 by two-tailed unpaired t test. (T) Heatmap plot from RNA-seq shows the expression levels of reprogramming factors, epigenetic factors, E2F targets, and AR targets in CRPC 22RV1 cells stably expressing shLuc, shIMPA1, or shIMPDH2. Duplicate RNA samples in each group were performed for RNA-seq. Source data are available for this figure: SourceData F6.
Figure 7.
Figure 7.
Inositol promotes PCSCs via directly binding to IMPDH2. (A) IMPDH activity of adherent and spheroid in 22RV1 cells. The activity was normalized by protein concentration in each experimental group. The data were shown as the mean ± SEM of three independent experiments for each group. **, P < 0.01 by two-tailed unpaired t test. (B) The levels of guanosine and GMP in ALDHhigh and ALDHlow/− of PC3 cells were determined by metabolomics analysis. *, P < 0.05 by two-tailed uppaired t test. (C) Spheres from DU145 stably expressing shLuc or shIMPDH2 (#1 and #2) upon the treatment of vehicle (Veh) or 40 μM of inositol (Ins). Scale bar, 100 μm. (D) Quantification of the number of spheres from DU145 is shown in C. The data are shown as the mean ± SEM of three independent experiments for each group. **, P < 0.01; NS, non-significant by two-tailed unpaired t test. (E) Spheres from PC3 cells upon 500 μM of LiCl, 10 μM of MPA, or 25 μM of Ins treatment for 4 days. Scale bar, 100 μm. (F) Quantification of sphere number from PC3 by ImageJ shown in E. The data are shown as the mean ± SEM of three independent experiments for each group. **, P < 0.01; NS, non-significant by two-tailed unpaired t test. (G) 22RV1 cells stably expressing shLuc or shIMPDH2 (#1 and #2) incubated with ALDEFLUOR for 45 min. FACS profiles represent DEAB control and ALDH staining in each group. The gate (P3) was set according to DEAB control. (H) Quantification of relative ALDH positive cells normalized by DEAB control according to the gate (P3) is shown as the mean ± SEM of three independent experiments for each group. **, P < 0.01 by two-tailed unpaired t test. DEAB, ALDH inhibitor. (I) Cancer sphere formation in 22RV1 cells expressing shLuc and shIMPA1 #1 upon vehicle, 40 μM of inositol, 40 μM of guanosine, 100 μM of GTP, 100 μM of GDP, 50 μM of cGMP, 3 μM of xanthosine, 3 μM of xanthine and 40 μM of adenosine. The concentrations of treatment were close to the reported physiological ranges (Traut, 1994). Scale bar, 100 μm. (J) Quantification of the number of cancer sphere formations with over 50 μm of diameter from A. The data were shown as the mean ± SEM of three independent experiments for each group. ***, P < 0.001; NS, non-significant by two-tailed unpaired t test. (K and N) Immunoblotting of 22RV1 (N) stably expressing shLuc or shIMPA1 (#1 and #2) and DU145 (Q) stably expressing shLuc or shIMPDH2 (#1 and #2) with indicated antibodies. Immunoblotting data were verified in at least two independent experiments. (L and O) Spheres from 22RV1 (L) or DU145 (O) stably expressing shLuc, IMPA1-two specific shRNA lentivirus (#1 and #2), or IMPDH2-two specific shRNA lentivirus (#1 and #2) upon vehicle (Veh), 40 μM of inositol (Ins), 40 μM of guanosine (Gua) or 40 μM of adenosine (Ade) treatment for 4 days. Scale bar, 100 μm. (M and P) Quantification of the number of spheres from L and O for M and P, respectively, was shown. Data are shown as the mean ± SEM of three independent experiments for each group. **, P < 0.01; NS, non-significant by two-tailed unpaired t test. Source data are available for this figure: SourceData F7.
Figure 8.
Figure 8.
IMPA1/inositol/IMPDH2 maintains PCSCs with ARlow/− features. (A and B) Immunoblotting of ALDHlow/− and ALDHhigh cells sorted from LNCaP (A) and PC3 (B) cells stably expressing shLuc or shIMPA1 (#1 and #2) with indicated antibodies. Immunoblotting data were verified in at least two independent experiments. (C and D) Relative gene expression of reprogramming factors and epigenetic regulators in 22RV1 cells stably expressing shLuc, shIMPA1, or shIMPDH2 were determined by qRT-PCR analysis. Data are shown as the mean ± SEM of three independent experiments for each group. **, P < 0.01; ***, P < 0.001 by two-tailed unpaired t test. (E) Relative gene expression of AR and AR target genes in 22RV1 cells stably expressing shLuc or shIMPA1 upon 40 μM of inositol (Ins) treatment for 48 h were determined by qRT-PCR. Data are shown as the mean ± SEM of three independent experiments for each group. *, P < 0.05; **, P < 0.01; ***, P < 0.001 by two-tailed unpaired t test. (F) Relative gene expression of AR and AR target genes in 22RV1 cells stably expressing shLuc or shIMPDH2 (#1 and #2) were determined by qRT-PCR. Data are shown as the mean ± SEM of three independent experiments for each group. *, P < 0.05; **, P < 0.01 by two-tailed unpaired t test. (G) Relative gene expression of SOX2, Nanog, Oct4 and SYP in 22RV1 cells upon vehicle or 500 μM of LiCl treatment for 48 h were determined by qRT-PCR. Data are shown as the mean ± SEM of three independent experiments for each group. *, P < 0.05; **, P < 0.01; ***, P < 0.001 by two-tailed unpaired t test. (H) Immunoblotting of 22RV1 cells stably expressing shLuc or shIMPA1 (#1 and #2) with indicated antibodies. Immunoblotting data were verified in at least two independent experiments. (I) Immunoblotting of 22RV1 cells stably expressing shLuc or shIMPDH2 (#1 and #2) with indicated antibodies. Immunoblotting data were verified in at least two independent experiments. (J) Immunoblotting of tumor organoid from TRAMP mice expressing shLuc or shIMPA1 (#1, #2, and #3) with indicated antibodies. Immunoblotting data were verified in at least two independent experiments. (K) Immunoblotting of 22RV1 cells expressing shLuc or shIMPA1 upon 25 μM of inositol (Ins) treatment with indicated antibodies. Immunoblotting data were verified in at least two independent experiments. (L) IHC of 22RV1 xenograft tumors stably expressing shLuc or shIMPA1 with indicated antibodies. IHC data were verified in at least two independent experiments. Scale bar, 100 μm. (M) IHC of prostate tissue from TRAMP/PB-Cre4 and TRAMP/Impa1FL/FL/PB-Cre4 mice at the age of 7 mo with indicated antibodies. IHC data were verified in at least two independent experiments. Scale bar, 50 μm. (N and O) Relative gene expression of SOX2, Nanog, Oct4, and AR genes in 22RV1 cells upon the treatment of 40 μM of inositol (Ins), 40 μM of guanosine (Gua), or 40 μM of adenosine (Ade) for 48 h were determined by qRT-PCR. The data are shown as the mean ± SEM of three independent experiments for each group. *, P < 0.05; **, P < 0.01; ***, P < 0.001; NS, non-significant by two-tailed unpaired t test. (P) Relative gene expression of luminal markers in LNCaP cells upon the treatment of 40 μM of inositol (Ins), 40 μM of guanosine (Gua), or 40 μM of adenosine (Ade) for 48 h were determined by qRT-PCR. The data were shown as the mean ± SEM of three independent experiments for each group. *, P < 0.05; **, P < 0.01; NS, non-significant by two-tailed unpaired t test. (Q) Relative gene expression of lineage markers in 22RV1 cells upon the treatment of vehicle (Veh), 40 μM of inositol (Ins), 40 μM of guanosine (Gua), or 40 μM of adenosine (Ade) for 48 h, followed by qRT-PCR. (R) Relative gene expression of lineage markers in 22RV1 cells stably expressing shLuc or shIMPA1 upon the treatment of vehicle (Veh), 40 μM of inositol (Ins), or 40 μM of guanosine (Gua) for 48 h, followed by qRT-PCR. (S) Relative gene expression of lineage markers in 22RV1 cells stably expressing shLuc or shIMPDH2 upon the treatment of vehicle (Veh), 40 μM of inositol (Ins), or 40 μM of guanosine (Gua) for 48 h, followed by qRT-PCR. All data in Q–S are shown as the mean ± SEM of three independent experiments for each group. *, P < 0.05; **, P < 0.01; ***, P < 0.001, NS, non-significant by two-tailed unpaired t test. Source data are available for this figure: SourceData F8.
Figure S5.
Figure S5.
IMPA1/inositol/IMPDH2 axis maintains EZH2 expression and PCSCs with ARlow/ features and endows enzalutamide resistance. (A) Relative gene expression of IMPA1, EZH2, SOX2, and MYCN in 22RV1 cells stably expressing shLuc or shIMPA1 upon overexpression of Vec. (vector), EZH2, SOX2, and MYCN, followed by qRT-PCR. Data were shown as the mean ± SEM of three independent experiments for each group. *, P < 0.05; NS, non-significant by two-tailed unpaired t test. (B) Relative gene expression of IMPDH2, EZH2, SOX2, and MYCN in 22RV1 cells stably expressing shLuc or shIMPDH2 upon overexpression of Vec. (vector), EZH2, SOX2, and MYCN followed by qRT-PCR. The data are shown as the mean ± SEM of three independent experiments for each group. *, P < 0.05; NS, non-significant by two-tailed unpaired t test. (C) Spheres from 22RV1 stably expressing shLuc or shIMPA1 (#1 and #2) upon overexpression of Vec. (vector), EZH2, SOX2, and MYCN are shown. Scale bar, 100 μm. (D) Quantification of the number of spheres from C is shown as the mean ± SEM of three independent experiments for each group for 22RV1. *, P < 0.05; NS, non-significant by two-tailed unpaired t test. (E) Cell viability was determined by CCK-8 assay upon indicated doses of enzalutamide treatment for 48 h in LNCaP EnzaS and EnzaR cells. (F) Immunoblotting of LNCaP EnzaS and EnzaR cell lines with indicated antibodies. (G) The levels of inositol in LNCaP EnzaS and EnzaR cell lines was determined by K-INOSL assay kit. The inositol levels were normalized by protein concentration in each experimental group. Three independent experiments were performed for the statistic of a two-tailed unpaired t test. **, P < 0.01. (H) Immunoblotting of LNCaP EnzaS and EnzaR cell lines expressing scramble (Scram.) and CRISPR/Cas9 IMPA1 knockout (IMPA1 KO) with indicated antibodies. Immunoblotting data were verified in at least two independent experiments. (I) Colony formation assay of LNCaP cells upon vehicle (Veh), 2 or 5 μM of enzalutamide (Enza), 40 μM of inositol (Ins), 40 μM of guanosine (Gua), or 40 μM of adenosine (Ade) treatment every 2 days for 14 days. (J) MTT assay of LNCaP cells upon vehicle (Veh), 40 μM of inositol (Ins), 40 μM of guanosine (Gua), or 40 μM of adenosine (Ade) treatment for 72 h. The data are shown as the mean ± SEM of three independent experiments for each group. NS, non-significant by two-tailed unpaired t test. (K) MTT assay of LNCaP cells upon vehicle (Veh), 10 μM of enzalutamide (Enza), 40 μM of inositol (Ins), 40 μM of guanosine (Gua), or 40 μM of adenosine (Ade) treatment for 72 h. The data were shown as the mean ± SEM of three independent experiments for each group. *, P < 0.05; **, P < 0.01; NS, non-significant by two-tailed unpaired t test. (L) Colony formation of LNCaP cells upon vehicle (Veh), 10 μM of enzalutamide (Enza), 40 μM of inositol (Ins), 40 μM of guanosine (Gua), or 40 μM of adenosine (Ade) treatment every 2 days for 14 days. (M) Quantification of the number of colonies from L–M by using ImageJ software. The data are shown as the mean ± SEM of three independent experiments for each group. **, P < 0.01; ***, P < 0.001; NS, non-significant by two-tailed unpaired t test. (N) Colony formation assay of LNCaP cells by seeding 4,000 cells upon pLKO vector or pLKO-IMPA1 stably expression in response to vehicle (Veh) and 10 μM of enzalutamide (Enza) treatment every 2 days for 14 days. (O) Quantification of number of colonies from N was shown. The data were shown as the mean ± SEM of three independent experiments for each group. **, P < 0.01; NS, non-significant by two-tailed unpaired t test. (P) Immunoblotting of LNCaP stably expressing pLKO or pLKO-IMPA1 with indicated antibodies. Immunoblotting data were verified in at least two independent experiments. (Q) PNT1A cells were treated with the concentration of MPA, MZB, and LiCl as indicated for 72 h, followed by CCK-8 assay. The data are shown as the mean ± SEM of three independent experiments for each group. NS, non-significant by two-tailed unpaired t test. (R) Colony formation assay of PDX tumor cells isolated from PDX tumors or LNCaP cells by seeding 2,000 cells upon vehicle (Veh), 5, 10, and 20 μM of enzalutamide (Enza) treatment for 14 days. (S) Relative cell viability of EnzaS LNCaP cells and PDX cells upon vehicle (Veh), 10 or 50 μM of enzalutamide (Enza) treatment for 48 h were determined by CCK-8. The data were shown as the mean ± SEM of three independent experiments for each group. ***, P < 0.001; NS, non-significant by two-tailed unpaired t test. (T) Working model for the role of IMPA1/inositol/IMPDH2 axis with PCSC properties to promote CRPC progression and ABT resistance. In the prostate hierarchical model, IMPA1/inositol/IMPDH2 axis maintains PCSC properties with ARlow/− features leading to CRPC progression and ABT resistance. Mechanistically, inositol directly binds to and activates IMPDH2 activity to promote guanylate purine metabolism. Notably, IMPA1/inositol/IMPDH2/guanosine axis serves as an upstream signal critical for maintaining PCSCs with ARlow/− features leading to CRPC and ABT resistance. Hence, pharmacological inhibition of IMPA1 or IMPDH2 eradicates PCSCs with ARlow/− features while it enhances AR+ luminal cell identity, leading to resensitizing ABT treatment. Thus, the combination of the IMPA1 inhibitor (LiCl) or IMPDH2 inhibitors (MZB or MPA) with ABT, enzalutamide (Enza), is a promising therapeutic strategy for targeting CRPC and overcoming ABT resistance. We therefore identify the critical role of the IMPA1/inositol/IMPDH2/guanosine axis as a master metabolic pathway for driving CRPC and ABT resistance. Source data are available for this figure: SourceData FS5.
Figure 9.
Figure 9.
IMPA1/inositol/IMPDH2 confers enzalutamide resistance. (A and G) Relative cell viability of 22RV1 cells stably expressing shLuc, shIMPA1 (#1 and #2) (A), or shIMPDH2 (#1, #2 and #3) (G) upon vehicle (Veh), 5, or 10 μM of enzalutamide (Enza) treatment for 48 h were determined by CCK-8. The data are shown as the mean ± SEM of three independent experiments for each group. *, P < 0.05; **, P < 0.01; ***, P < 0.001; non-significant by two-tailed unpaired t test. (B) Colony formation assay of 22RV1 cells stably expressing shLuc or shIMPA1 upon vehicle (Veh), 5 or 10 μM of enzalutamide (Enza) treatment every 2 days for 14 days. (C) Quantification of colony number from B by ImageJ was shown. The data were shown as the mean ± SEM of three independent experiments for each group. *, P < 0.05; **, P < 0.01; non-significant by two-tailed unpaired t test. (D) Cancer sphere formation in 22RV1 cells stably expressing shLuc and shIMPA1 #1 upon vehicle (Veh) and 10 μM of enzalutamide (Enza) treatment. Scale bar, 100 μm. (E and K) Quantification of the number of cancer sphere formations with over 50 μm of diameter from D and J to E and K. The data are shown as the mean ± SEM of three independent experiments for each group. **, P < 0.01; ***, P < 0.001; NS, non-significant by two-tailed unpaired t test. (F) Immunoblotting of 22RV1 cells stably expressing IMPDH2 (#1, #2, and #3) with indicated antibodies. (H) Colony formation assay of 22RV1 cells stably expressing shLuc or shIMPDH2 (#1 and #2) upon vehicle (Veh), 5, 10, or 20 μM of enzalutamide (Enza) treatment every 2 days for 14 days. (I) Quantification of colony number from H by ImageJ was shown. (J) Cancer sphere formation in 22RV1 cells stably expressing shLuc and shIMPDH2 #1 upon vehicle (Veh) and 10 μM of enzalutamide (Enza) treatment. Scale bar, 100 μm. (L) Colony formation assay of 22RV1 scramble (Scram.) or IMPA1 knockout (KO) cells by CRISPR/Cas9 upon Flag vector, Flag-IMPA1 (WT) and Flag-IMPA1 D220A (D220A) overexpression in response to vehicle (Veh), 5 or 10 μM of enzalutamide (Enza) treatment every 2 days for 14 days. (M) Quantification of colony number from L by ImageJ was shown. The data were shown as the mean ± SEM of three independent experiments for each group. **, P < 0.01; ***, P < 0.001; non-significant by two-tailed unpaired t test. (N) Cancer sphere formation in 22RV1 cells upon Scramble (Scram.) with Flag, IMPA1 knockout (KO) with Flag, Flag-IMPA1WT (WT), and Flag-IMPA1D220A (D220A) in response to the treatment of vehicle (Veh) and 10 μM of enzalutamide (Enza) treatment. Scale bar, 100 μm. (O) Quantification of the number of cancer sphere formations with over 50 μm of diameter from N–O. The data are shown as the mean ± SEM of three independent experiments for each group. **, P < 0.01; ***, P < 0.001; NS, non-significant by two-tailed unpaired t test. (P) Male nude mice subcutaneously injected with 22RV1 cells stably expressing shLuc or shIMPA1 were intraperitoneally injected with vehicle (Veh) or 5 mg/kg of enzalutamide (Enza) every 2 days for 40 days, and tumor volume was measured with indicated days. Five mice were included in each experimental group. (Q) Surgically castrated NOD/SCID mice subcutaneously injected with 22RV1 cells upon shLuc and shIMPA1 were intraperitoneally injected with vehicle or 5 mg/kg of enzalutamide (Enza) three times a week for 6 wk and tumor volume was measured with indicated days. Five mice were included in each experimental group. (R) Relative cell viability of 22RV1 cells stably expressing shLuc or shIMPA1 upon vehicle (Veh), 5 μM of enzalutamide (Enza), 80 μM of inositol (Ins), or 80 μM of guanosine (Gua) for 72 h treatment was determined by CCK-8. The data are shown as the mean ± SEM of three independent experiments for each group. *, P < 0.05; NS, non-significant by two-tailed unpaired t test. (S) Relative cell viability of 22RV1 cells stably expressing shLuc or shIMPDH2 upon vehicle (Veh), 5 μM of enzalutamide (Enza), 80 μM of inositol (Ins), or 80 μM of guanosine (Gua) for 72 h treatment was determined by Cell Counting Kit-8 (CCK-8). The data are shown as the mean ± SEM of three independent experiments for each group. *, P < 0.05; **, P < 0.01; NS, non-significant by two-tailed unpaired t test. Source data are available for this figure: SourceData F9.
Figure 10.
Figure 10.
Pharmacological inhibition of IMPA1 or IMPDH2 in combination with enzalutamide efficiently eradicates CRPC progression. (A) Colony formation assay of 22RV1 cells upon vehicle (Veh), 2 or 5 μM of enzalutamide (Enza), 0.5 or 1 μM of MPA, 0.5 or 1 μM of MZB, and 20 or 40 μM of LiCl treatment for 14 days. (B) Quantification of the number of colonies from 22RV1 by ImageJ is shown in A. (C) MTT assay of 22RV1 cells upon vehicle (Veh), 10 μM of enzalutamide (Enza); 250 nM, 500 nM, or 1 μM of MPA treatment for 24 h. (D) MTT assay of TRAMP-C2 cells upon vehicle (Veh), 10 μM of enzalutamide (Enza); 250 nM, 500 nM, or 1 μM of MPA treatment for 24 h. (E) MTT assay of 22RV1 cells upon vehicle (Veh), 10 μM of enzalutamide (Enza); 2, 5, or 10 μM of MZB treatment for 24 h. (F) MTT assay of TRAMP-C2 cells upon vehicle (Veh), 10 μM of enzalutamide (Enza); 2, 5, or 10 μM of MZB treatment for 24 h. All statistical data are shown as the mean ± SEM of three independent experiments for each group. *, P < 0.05; **, P < 0.01; ***, P < 0.001; NS, non-significant by two-tailed unpaired t test. (G) Male nude mice subcutaneously injected with 22RV1 cells were intraperitoneally injected with vehicle (Veh), 5 mg/kg of enzalutamide (Enza) daily for 21 days, 200 mg/kg of MZB daily for 7 days; no treatment for 4 days; 100 mg/kg of MZB daily for 10 days or 200 mg/kg of LiCl daily for 21 days, and tumor volume was measured with indicated days. Five mice were included in each experimental group. (H) Male NSG mice subcutaneously injected with PDX prostate tumor were intraperitoneally injected with vehicle (Veh), 5 mg/kg of enzalutamide (Enza) daily for 21 days, 200 mg/kg of MZB daily for 7 days; no treatment for 4 days; 100 mg/kg of MZB daily for 10 days or 200 mg/kg of LiCl daily for 21 days, and tumor volume was measured with indicated days. Five mice were included in each experimental group. (I) Surgically castrated NOD/SCID mice subcutaneously injected with 22RV1 cells were intraperitoneally injected with vehicle or 5 mg/kg of enzalutamide (Enza), 200 mg/kg of LiCl, 100 mg/kg of MZB, 5 mg/kg of enzalutamide (Enza) in combination with 200 mg/kg of LiCl and 5 mg/kg of enzalutamide (Enza) in combination with 100 mg/kg of MZB three times a week for 6 wk and tumor volume was measured with indicated days. Five mice were included in each experimental group. (J) Tumor weight from I was measured on day 57. At least three xenograft tumors in each group were quantified. **, P < 0.01; ***, P < 0.001 by two-tailed unpaired t test. (K) Body weight from I was measured as indicated days. Five mice were included in each experimental group. (L) H&E staining of prostate tissues from surgically castrated TRAMP mice at the age of 6 mo administrated with 5 mg/kg of enzalutamide (Enza), 100 mg/kg of MZB, 200 mg/kg of LiCl, 5 mg/kg of Enza combination with 100 mg/kg of MZB and 5 mg/kg of Enza combination with 200 mg/kg of LiCl three times a week for 18 wk. Five mice were included in each experimental group. Scale bar, 100 μm. (M) Histological analysis for the phenotype of carcinoma in surgical castrated TRAMP mice upon the administration of indicated inhibitors. Each group includes 5 mice. (N) Tumor organoids from TRAMP mice upon Veh, 5 μM of Enza, 1 μM of MPA, 1 μM of MZB, or 500 μM of LiCl treatment for 4 days. Scale bar, 100 μm. (O) Quantification of organoid number from N by Image J was shown as the mean ± SEM of three independent experiments for each group. *, P < 0.05; **, P < 0.01; ***, P < 0.001 by two-tailed unpaired t test. (P) Tumor organoids from PDX tumors with Veh, 5 μM of Enza, 1 μM of MZB, or 500 μM of LiCl treatment for 4 days. Scale bar, 50 μm. (Q) Quantification of organoid number from P by ImageJ was shown as the mean ± SEM of three independent experiments for each group. *, P < 0.05; **, P < 0.01; ***, P < 0.001 by two-tailed unpaired t test.

References

    1. Aggarwal, R., Huang J., Alumkal J.J., Zhang L., Feng F.Y., Thomas G.V., Weinstein A.S., Friedl V., Zhang C., Witte O.N., et al. . 2018. Clinical and genomic characterization of treatment-emergent small-cell neuroendocrine prostate cancer: A multi-institutional prospective study. J. Clin. Oncol. 36:2492–2503. 10.1200/JCO.2017.77.6880 - DOI - PMC - PubMed
    1. Beltran, H., Rickman D.S., Park K., Chae S.S., Sboner A., MacDonald T.Y., Wang Y., Sheikh K.L., Terry S., Tagawa S.T., et al. . 2011. Molecular characterization of neuroendocrine prostate cancer and identification of new drug targets. Cancer Discov. 1:487–495. 10.1158/2159-8290.CD-11-0130 - DOI - PMC - PubMed
    1. Berlin, R.D., and Oliver J.M.. 1975. Membrane transport of purine and pyrimidine bases and nucleosides in animal cells. Int. Rev. Cytol. 42:287–336. 10.1016/S0074-7696(08)60983-3 - DOI - PubMed
    1. Burrell, A.L., and Kollman J.M.. 2022. IMPDH dysregulation in disease: A mini review. Biochem. Soc. Trans. 50:71–82. 10.1042/BST20210446 - DOI - PMC - PubMed
    1. Carey, B.W., Finley L.W., Cross J.R., Allis C.D., and Thompson C.B.. 2015. Intracellular α-ketoglutarate maintains the pluripotency of embryonic stem cells. Nature. 518:413–416. 10.1038/nature13981 - DOI - PMC - PubMed

MeSH terms