. 2024 Oct 29:13:RP94242.
doi: 10.7554/eLife.94242.

Longitudinal transcriptional changes reveal genes from the natural killer cell-mediated cytotoxicity pathway as critical players underlying COVID-19 progression

Affiliations

Longitudinal transcriptional changes reveal genes from the natural killer cell-mediated cytotoxicity pathway as critical players underlying COVID-19 progression

Matias A Medina et al. Elife. .

Abstract

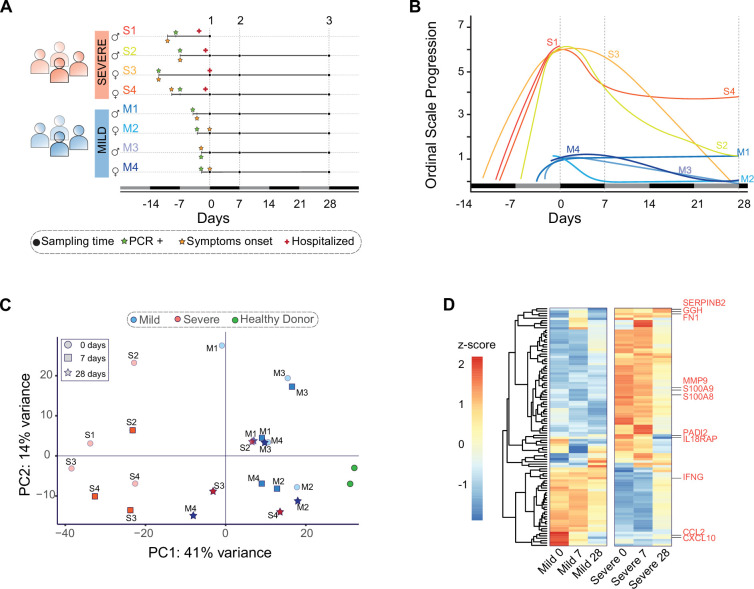
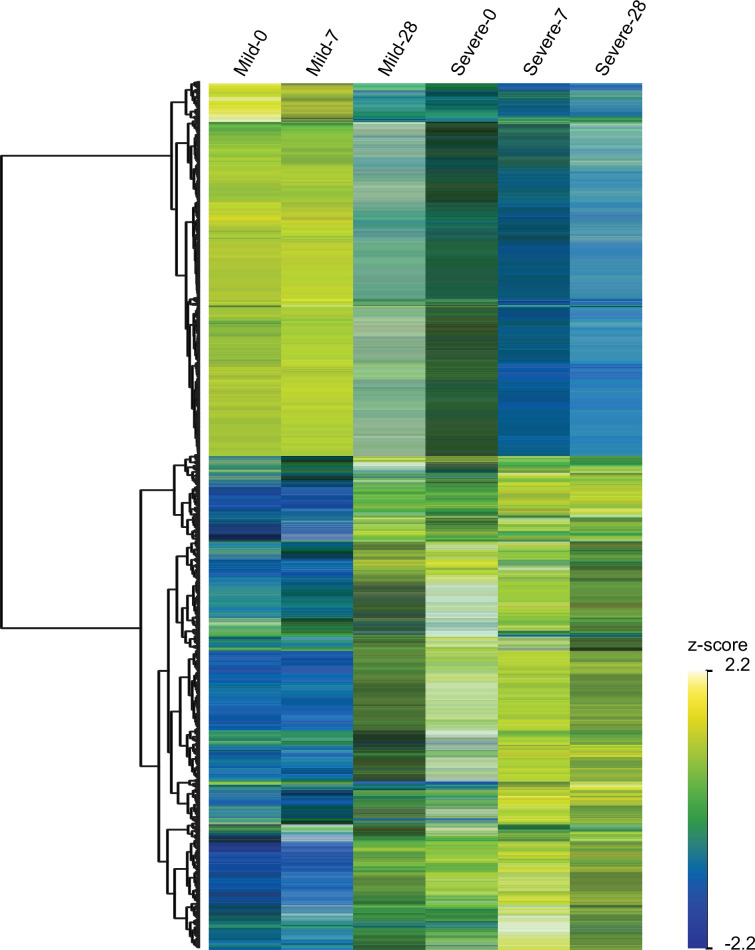
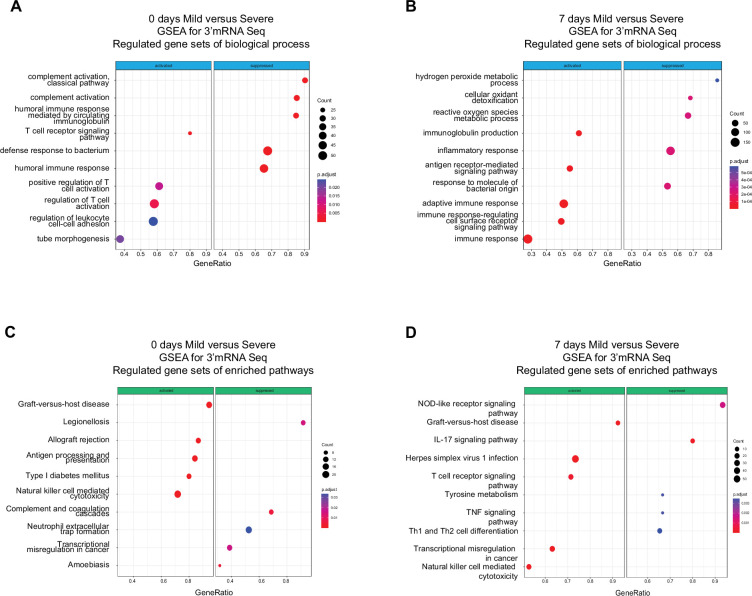
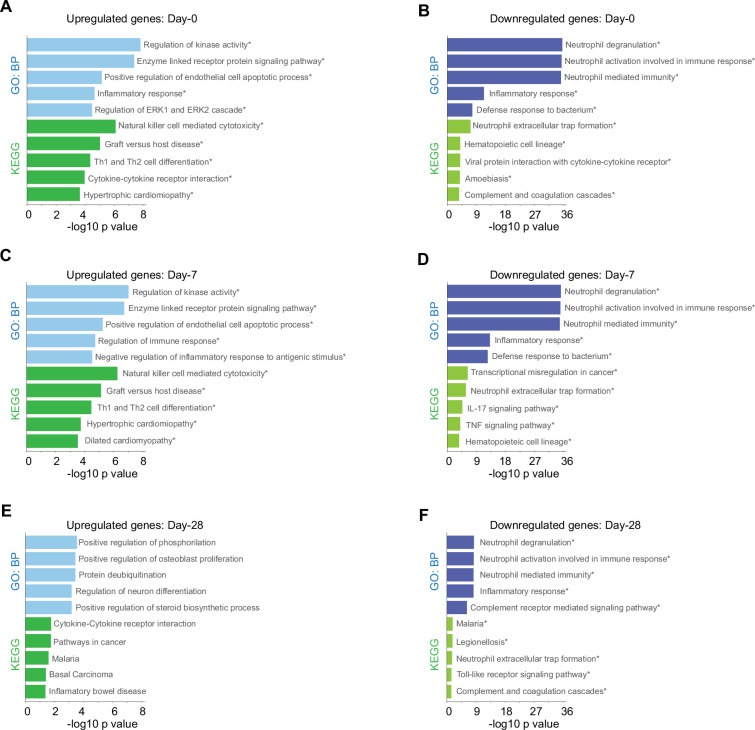
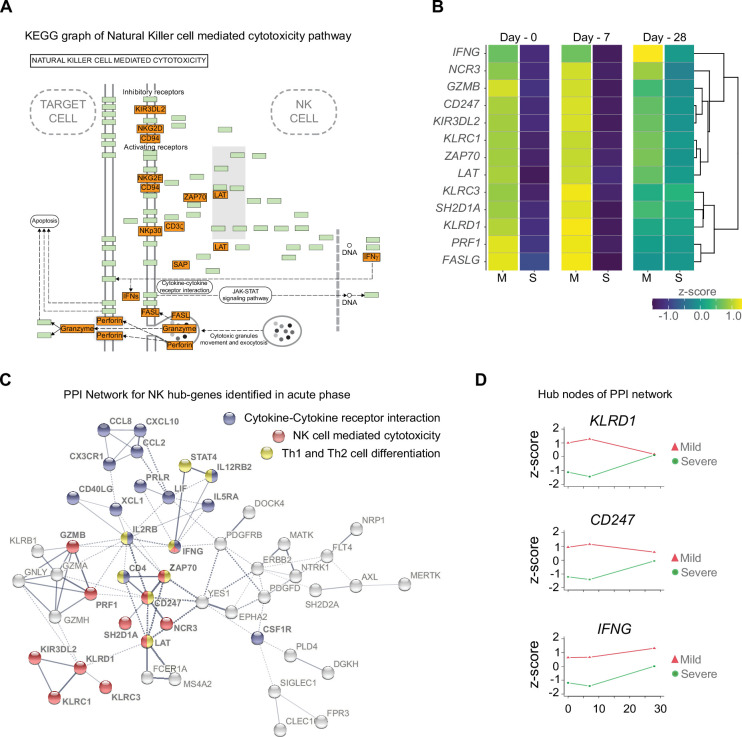
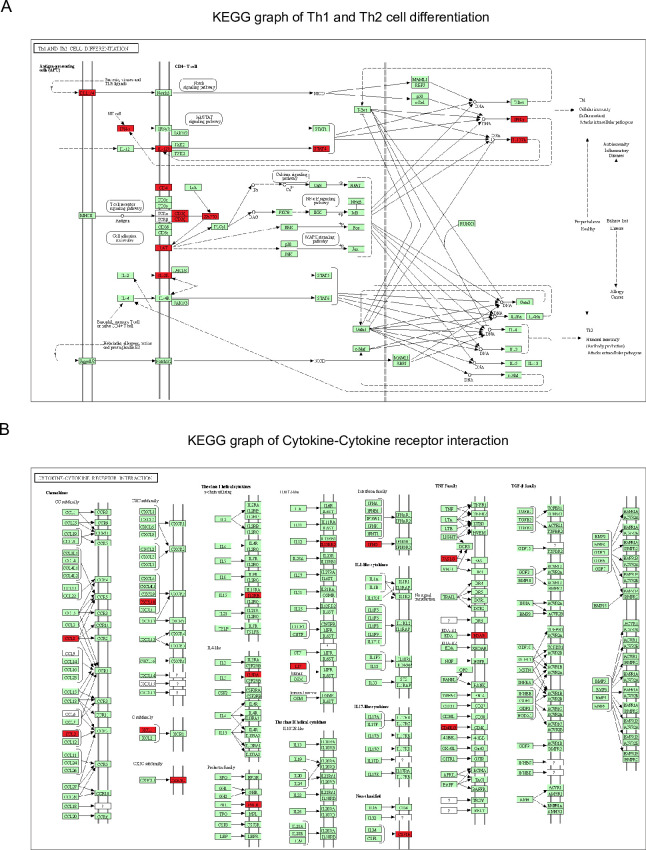
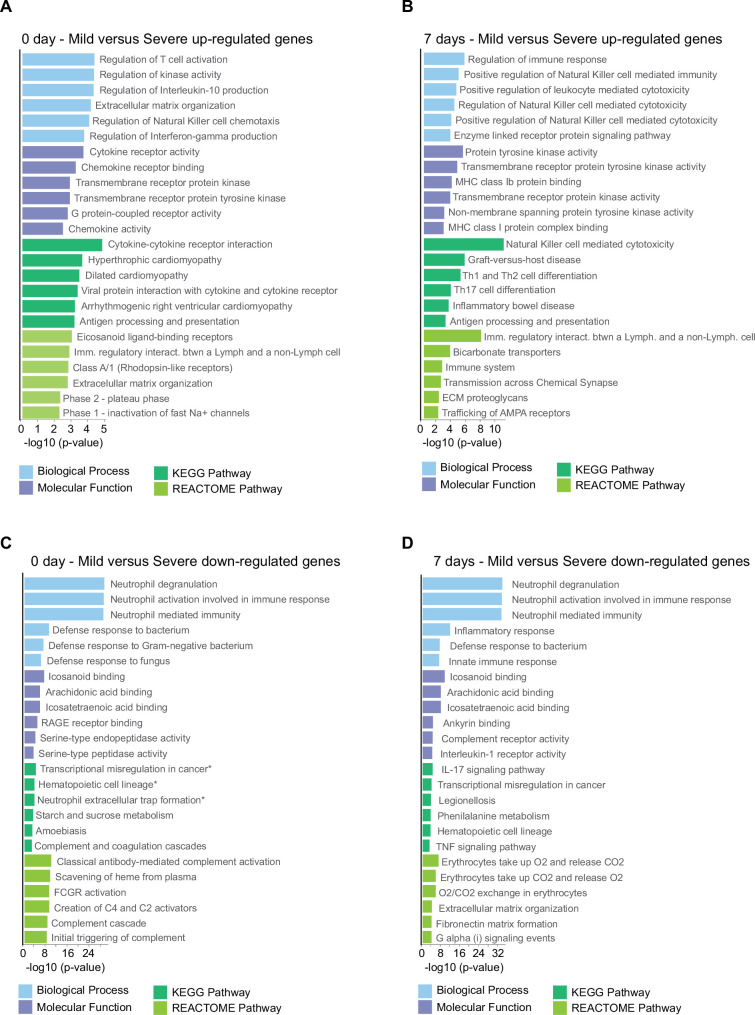
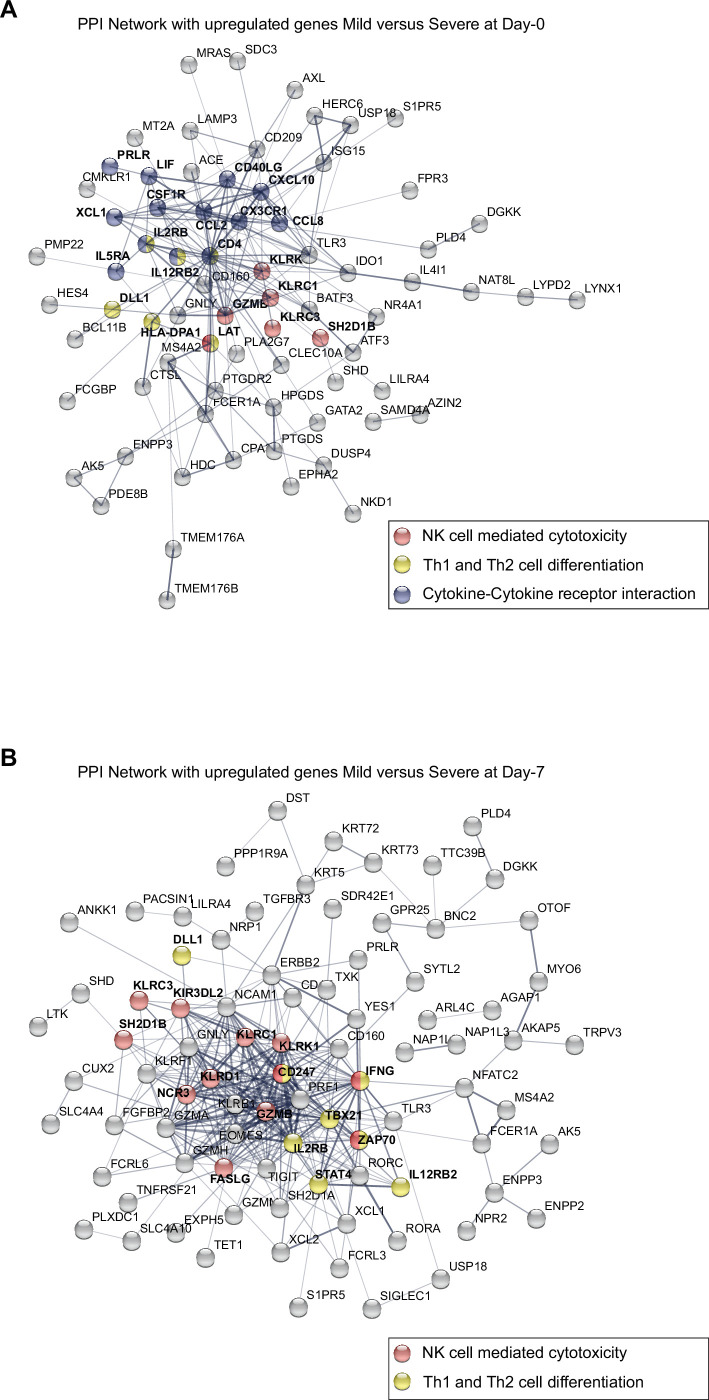
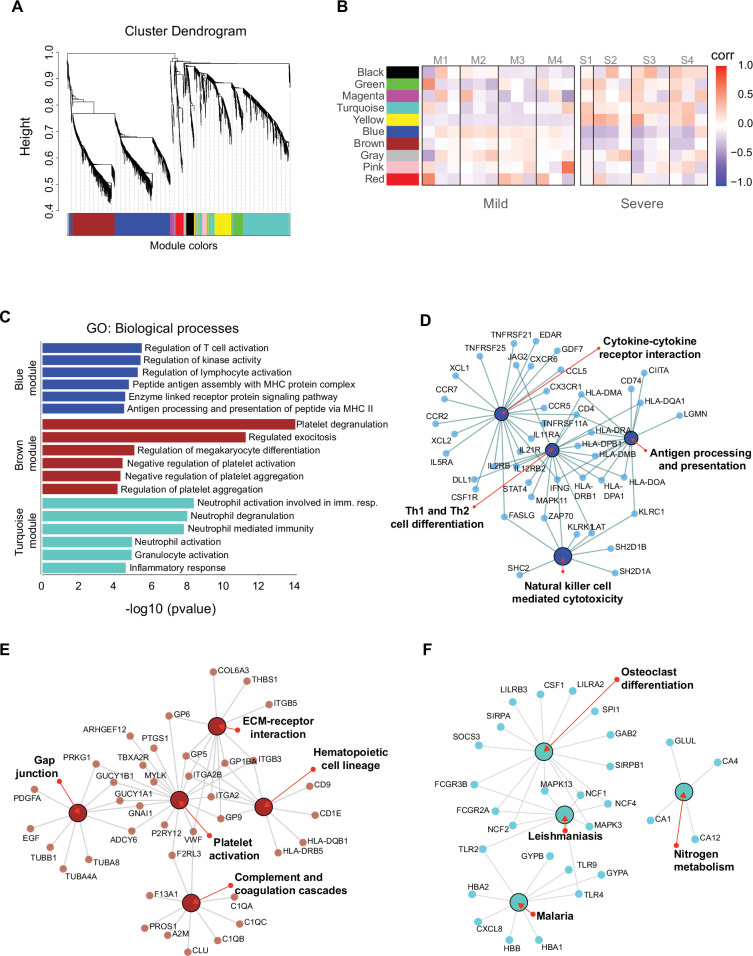
Patients present a wide range of clinical severities in response severe acute respiratory syndrome coronavirus 2 infection, but the underlying molecular and cellular reasons why clinical outcomes vary so greatly within the population remains unknown. Here, we report that negative clinical outcomes in severely ill patients were associated with divergent RNA transcriptome profiles in peripheral immune cells compared with mild cases during the first weeks after disease onset. Protein-protein interaction analysis indicated that early-responding cytotoxic natural killer cells were associated with an effective clearance of the virus and a less severe outcome. This innate immune response was associated with the activation of select cytokine-cytokine receptor pathways and robust Th1/Th2 cell differentiation profiles. In contrast, severely ill patients exhibited a dysregulation between innate and adaptive responses affiliated with divergent Th1/Th2 profiles and negative outcomes. This knowledge forms the basis of clinical triage that may be used to preemptively detect high-risk patients before life-threatening outcomes ensue.

Keywords: COVID-19; NK; PBMC RNA-seq; human; infectious disease; microbiology.


Conflict of interest statement

MM, FF, CQ, FA, RR, MR, SB, YP, MC, IB, CK, RA, JG, MB No competing interests declared

Figures

Figure 1.
Figure 1.. Clinical profile and gene expression patterns for mild and severe COVID-19 patients during 28 days.
(A) Longitudinal sampling schedule for severe and mild COVID-19 donors of peripheral blood (22 samples in total from 8 donors). Three sampling times (black dots) are displayed with respect to the recruitment day (D0). In addition, panel A shows the diagnosis day with positive PCR (green star), symptoms onset day (orange star), and hospitalization day (red cross). (B) The COVID-19 progression according to the WHO ordinal scale describes the temporal disease severity for each donor. Severe patients (S1–S4) are displayed in lines with colors scaling from green to red, while mild patients (M1–M4) are shown in blue line colors. The X-axis represents the days relative to the recruitment day. The vertical dot lines indicate the three sampling times used in this study (days 0, 7, and 28). (C) Principal component analysis plot based on gene expression profiles for mild (blue) and severe (red) COVID-19 patients and grouped by their sampling time (0, 7, and 28 days after recruitment). In addition, peripheral blood samples from two healthy donors are shown in green. PC = principal component. (D) Heatmap of the 100 most significant differentially expressed genes related to the COVID-19 disease progression. At the bottom, each column corresponds to the sampling points (0, 7, and 28 days since recruitment) of mild and severe patients. Genes are displayed as horizontal rows and are clustered by the similarity of expression profiles, represented by the dendrogram to the left of the heatmap. Red indicates higher expression, while blue means lower expression represented by the z-score of normalized read counts. Some COVID-19 severity-associated genes previously reported are indicated to the right of the heatmap in red.
Figure 1—figure supplement 1.
Figure 1—figure supplement 1.. Heatmap of temporally and differentially expressed genes over the course of COVID-19 progression.
At the top, each column corresponds to the sampling points (0, 7, and 28 days since recruitment) of mild and severe patients. Genes are displayed as horizontal rows and are clustered by the similarity of expression profiles, represented by the dendrogram to the left of the heatmap. To the right of the heatmap, yellowish color indicates higher expression, while bluish color means lower expression represented by the z-score of normalized read counts.
Figure 1—figure supplement 2.
Figure 1—figure supplement 2.. Volcano plot depicting pairwise gene expression comparisons for detected differentially expressed genes (DEGs) between mild and severe COVID-19 patients at D0, D7, and D28 (A, B, and C, respectively).
Red or blue indicates genes that were significantly over- or sub-expressed at a particular sampling time, based on filtering by FDR ≤0.05 and the absolute value of −log10 (FC) (≥2.0). The remaining genes that do not show differential expression are indicated in gray. FDR = false discovery rate; FC = fold change.
Figure 2.
Figure 2.. Gene set enrichment analysis (GSEA) shows biological processes and enriched pathways associated to innate and adaptive immune response after severe acute respiratory syndrome coronavirus 2 (SARS-CoV-2) infection.
(A, B) Bubble plots show the biological processes (BP) of enriched genes for differentially expressed genes (DEGs) between mild and severe for D0 and D7 after recruitment, respectively. (C, D) Bubble plots show the Kyoto encyclopedia of gene and genomes (KEGG) enriched pathways of enriched genes for DEGs between mild and severe for D0 and D7, respectively. The Count (black circles) represents the number of genes included on each set. Generatio is the ratio between number of genes found in the set and total genes of set. The scale-color bar indicates the p-adjustment of each BP or KEGG pathway.
Figure 3.
Figure 3.. Biological processes and Kyoto encyclopedia of gene and genomes (KEGG) pathway for genes with differential expression levels over time in mild versus severe patients.
Bar plots show gene ontology analysis for biological processes in light-blue/dark-blue and KEGG pathway in light-green/dark-green, using upregulated genes (A, C, E) and downregulated genes (B, D, F). The size of each bar is according to its −log10 p-value, and name pathways with asterisk indicates a q-value ≤0.05.
Figure 4.
Figure 4.. Gene function network for natural killer (NK) cell hub-genes with differential expression levels between mild and severe patients during acute phase of COVID-19.
(A) Kyoto encyclopedia of gene and genomes (KEGG) pathway of NK cell-mediated cytotoxicity represents the set NK cell hub-genes upregulated (red-boxes) in mild versus severe patients. The green boxes correspond to genes without differential expression. (B) Heatmap shows the differential expression levels of NK cell hub-genes over time (D0, D7, and D28 after recruitment) separated by mild and severe groups. The expression levels are represented by the z-score of normalized counts. Dendrogram shows the hierarchical clustering of genes. (C) Protein–protein interaction (PPI) network for upregulated genes during the acute phase in mild patients. The network corresponds to the principal clusters with more interaction between proteins and highlights the three most represented pathways: Cytokine–cytokine receptor interaction (blue); NK cell-mediated cytotoxicity (red); and Th1 and Th2 cell differentiation (yellow). (D) Time course expression levels for the main protein nodes identified in PPI network during the acute phase of COVID-19. The trajectories of these genes are graphed as days after recruitment (D0, D7, and D28) for mild (red triangle) and severe (green circle) groups and their enrichment is represented by the z-score of normalized counts.
Figure 4—figure supplement 1.
Figure 4—figure supplement 1.. Kyoto encyclopedia of gene and genomes (KEGG) graphs show genes differentially expressed over time of the Th1 and Th2 cell differentiation pathway (A) and the cytokine–cytokine receptor interaction pathway (B).
Red boxes depict upregulated genes in mild COVID-19 patients during the acute phase of the disease, whereas green boxes depict genes without significant differential gene expression within the KEGG pathways.
Figure 4—figure supplement 2.
Figure 4—figure supplement 2.. Gene ontology (GO) and Kyoto encyclopedia of gene and genomes (KEGG) and REACTOME pathway analyses of differentially expressed genes (DEGs) found in the pairwise comparison between D0 and D7 of COVID-19 infection.
Bar graphs showing the enrichment of GO biological processes (in blue color), GO molecular functions (in purple color), KEGG pathways (in dark green color), and Reactome pathways (in light green color) between mild and severe COVID-19 patients. Enrichment results are sorted by −log10(p-value) (higher on top) with a cut-off for DEGs ≥4 fold-change considering the upregulated genes at D0 (A), upregulated genes at D7 (B), downregulated genes at D0 (C), and downregulated genes at D7 (D).
Figure 4—figure supplement 3.
Figure 4—figure supplement 3.. Protein–protein interaction (PPI) network graphs show the upregulated genes found in the pairwise comparison (D0 and D7) in mild versus severe COVID-19 patients.
(A) Topological representation of the PPI network of upregulated genes in mild patients on D0. (B) Topological representation of the PPI network of upregulated genes in mild patients on D7. Some nodes are color-coded to highlight proteins involved in the following pathways: Cytokine–cytokine receptor interaction (blue), natural killer (NK) cell-mediated cytotoxicity (red); and Th1 and Th2 cell differentiation (yellow).
Figure 4—figure supplement 4.
Figure 4—figure supplement 4.. Gene ontology (GO) and networks of enriched pathway analyses of differentially expressed genes (DEGs) found in the pairwise comparison between D7 of mild patients and D0 of severe patients with COVID-19.
Bar graphs show the enrichment of GO terms for biological processes while the networks reveal Kyoto encyclopedia of gene and genomes (KEGG) enriched pathways for upregulated genes (A, B) and downregulated genes (C, D) in mild patients, respectively. The size of each bar is according to its −log10 p-value, and name GO terms with asterisk indicates a q-value ≤0.05.
Figure 5.
Figure 5.. Gene co-expression network analysis among the longitudinal transcriptomic profiling.
(A) Gene hierarchical clustering dendrogram of 10 detected modules based on Topological Overlap Matrices (TOM) measure. The branches and color bands represent the assigned module. (B) Module–trait relationships (MTRs) between detected modules and disease severity of COVID-19. MTRs are obtained by calculating Pearson correlation between the traits and the module eigengenes. The red and blue colors indicate strong positive or negative correlations, respectively. Rows represent module eigengene (ME) and columns indicate the disease severity of COVID-19, where correlations from each patient are shown from left to right according to their sampling time (D0, D7, and D28). (C) Gene ontology (GO) enrichment analysis of genes in the blue, brown, and turquoise modules. The color in the bar graphs refers to the module eigengene (ME). Enrichment results are sorted by −log10(p-value) (higher on top) of each biological process GO term. (D–F) Network visualization of enriched pathways based on co-expression genes from blue, brown, and turquoise modules, respectively.
Figure 5—figure supplement 1.
Figure 5—figure supplement 1.. Gene ontology (GO) analysis of the seven smallest modules of co-expression.
The genes from the modules red, black, magenta, green, pink, yellow, and gray were used to study GO biological process terms. GO terms with statistically significant q-values are marked with an asterisk.
Figure 5—figure supplement 2.
Figure 5—figure supplement 2.. Network for genes of enriched pathways from the seven smallest modules of co-expression.
Genes from modules red (A), black (B), pink (C), yellow (D), green (E), magenta (F), and gray (G) were used for analysis and the networks show the most enriched pathways.

Update of

  • doi: 10.1101/2024.01.02.573936
  • doi: 10.7554/eLife.94242.1
  • doi: 10.7554/eLife.94242.2

References

    1. Ahern DJ, Ai Z, Ainsworth M, Allan C, Allcock A, Angus B, Ansari MA, Arancibia-Cárcamo CV, Aschenbrenner D, Attar M, Baillie JK, Barnes E, Bashford-Rogers R, Bashyal A, Beer S, Berridge G, Beveridge A, Bibi S, Bicanic T, Blackwell L, Bowness P, Brent A, Brown A, Broxholme J, Buck D, Burnham KL, Byrne H, Camara S, Candido Ferreira I, Charles P, Chen W, Chen Y-L, Chong A, Clutterbuck EA, Coles M, Conlon CP, Cornall R, Cribbs AP, Curion F, Davenport EE, Davidson N, Davis S, Dendrou CA, Dequaire J, Dib L, Docker J, Dold C, Dong T, Downes D, Drakesmith H, Dunachie SJ, Duncan DA, Eijsbouts C, Esnouf R, Espinosa A, Etherington R, Fairfax B, Fairhead R, Fang H, Fassih S, Felle S, Fernandez Mendoza M, Ferreira R, Fischer R, Foord T, Forrow A, Frater J, Fries A, Gallardo Sanchez V, Garner LC, Geeves C, Georgiou D, Godfrey L, Golubchik T, Gomez Vazquez M, Green A, Harper H, Harrington HA, Heilig R, Hester S, Hill J, Hinds C, Hird C, Ho L-P, Hoekzema R, Hollis B, Hughes J, Hutton P, Jackson-Wood MA, Jainarayanan A, James-Bott A, Jansen K, Jeffery K, Jones E, Jostins L, Kerr G, Kim D, Klenerman P, Knight JC, Kumar V, Kumar Sharma P, Kurupati P, Kwok A, Lee A, Linder A, Lockett T, Lonie L, Lopopolo M, Lukoseviciute M, Luo J, Marinou S, Marsden B, Martinez J, Matthews PC, Mazurczyk M, McGowan S, McKechnie S, Mead A, Mentzer AJ, Mi Y, Monaco C, Montadon R, Napolitani G, Nassiri I, Novak A, O’Brien DP, O’Connor D, O’Donnell D, Ogg G, Overend L, Park I, Pavord I, Peng Y, Penkava F, Pereira Pinho M, Perez E, Pollard AJ, Powrie F, Psaila B, Quan TP, Repapi E, Revale S, Silva-Reyes L, Richard J-B, Rich-Griffin C, Ritter T, Rollier CS, Rowland M, Ruehle F, Salio M, Sansom SN, Sanches Peres R, Santos Delgado A, Sauka-Spengler T, Schwessinger R, Scozzafava G, Screaton G, Seigal A, Semple MG, Sergeant M, Simoglou Karali C, Sims D, Skelly D, Slawinski H, Sobrinodiaz A, Sousos N, Stafford L, Stockdale L, Strickland M, Sumray O, Sun B, Taylor C, Taylor S, Taylor A, Thongjuea S, Thraves H, Todd JA, Tomic A, Tong O, Trebes A, Trzupek D, Tucci FA, Turtle L, Udalova I, Uhlig H, van Grinsven E, Vendrell I, Verheul M, Voda A, Wang G, Wang L, Wang D, Watkinson P, Watson R, Weinberger M, Whalley J, Witty L, Wray K, Xue L, Yeung HY, Yin Z, Young RK, Youngs J, Zhang P, Zurke Y-X. A blood atlas of COVID-19 defines hallmarks of disease severity and specificity. Cell. 2022;185:916–938. doi: 10.1016/j.cell.2022.01.012. - DOI - PMC - PubMed
    1. Andrews S. FastQC. GPL v3Github. 2010 https://www.bioinformatics.babraham.ac.uk/projects/fastqc/
    1. Babatunde KA, Adenuga OF. Neutrophils in malaria: A double-edged sword role. Frontiers in Immunology. 2022;13:922377. doi: 10.3389/fimmu.2022.922377. - DOI - PMC - PubMed
    1. Bastard P, Rosen LB, Zhang Q, Michailidis E, Hoffmann H-H, Zhang Y, Dorgham K, Philippot Q, Rosain J, Béziat V, Manry J, Shaw E, Haljasmägi L, Peterson P, Lorenzo L, Bizien L, Trouillet-Assant S, Dobbs K, de Jesus AA, Belot A, Kallaste A, Catherinot E, Tandjaoui-Lambiotte Y, Le Pen J, Kerner G, Bigio B, Seeleuthner Y, Yang R, Bolze A, Spaan AN, Delmonte OM, Abers MS, Aiuti A, Casari G, Lampasona V, Piemonti L, Ciceri F, Bilguvar K, Lifton RP, Vasse M, Smadja DM, Migaud M, Hadjadj J, Terrier B, Duffy D, Quintana-Murci L, van de Beek D, Roussel L, Vinh DC, Tangye SG, Haerynck F, Dalmau D, Martinez-Picado J, Brodin P, Nussenzweig MC, Boisson-Dupuis S, Rodríguez-Gallego C, Vogt G, Mogensen TH, Oler AJ, Gu J, Burbelo PD, Cohen JI, Biondi A, Bettini LR, D’Angio M, Bonfanti P, Rossignol P, Mayaux J, Rieux-Laucat F, Husebye ES, Fusco F, Ursini MV, Imberti L, Sottini A, Paghera S, Quiros-Roldan E, Rossi C, Castagnoli R, Montagna D, Licari A, Marseglia GL, Duval X, Ghosn J, HGID Lab. NIAID-USUHS Immune Response to COVID Group. COVID Clinicians. COVID-STORM Clinicians. Imagine COVID Group. French COVID Cohort Study Group. Milieu Intérieur Consortium. CoV-Contact Cohort. Amsterdam UMC Covid-19 Biobank. COVID Human Genetic Effort. Tsang JS, Goldbach-Mansky R, Kisand K, Lionakis MS, Puel A, Zhang S-Y, Holland SM, Gorochov G, Jouanguy E, Rice CM, Cobat A, Notarangelo LD, Abel L, Su HC, Casanova J-L. Autoantibodies against type I IFNs in patients with life-threatening COVID-19. Science. 2020;370:eabd4585. doi: 10.1126/science.abd4585. - DOI - PMC - PubMed
    1. Bernal E, Gimeno L, Alcaraz MJ, Quadeer AA, Moreno M, Martínez-Sánchez MV, Campillo JA, Gomez JM, Pelaez A, García E, Herranz M, Hernández-Olivo M, Martínez-Alfaro E, Alcaraz A, Muñoz Á, Cano A, McKay MR, Muro M, Minguela A. Activating killer-cell immunoglobulin-like receptors are associated with the severity of coronavirus disease 2019. The Journal of Infectious Diseases. 2021;224:229–240. doi: 10.1093/infdis/jiab228. - DOI - PMC - PubMed