. 2024 Dec 6;9(23):e173665.
doi: 10.1172/jci.insight.173665.

Comprehensive analysis of mesenchymal cells reveals a dysregulated TGF-β/WNT/HOXB7 axis in patients with myelofibrosis

Affiliations

Comprehensive analysis of mesenchymal cells reveals a dysregulated TGF-β/WNT/HOXB7 axis in patients with myelofibrosis

Saravanan Ganesan et al. JCI Insight. .

Abstract

Despite the advances in the understanding and treatment of myeloproliferative neoplasm (MPN), the disease remains incurable with the risk of evolution to acute myeloid leukemia or myelofibrosis (MF). Unfortunately, the evolution of the disease to MF remains poorly understood, impeding preventive and therapeutic options. Recent studies in solid tumor microenvironment and organ fibrosis have shed instrumental insights on their respective pathogenesis and drug resistance, yet such precise data are lacking in MPN. In this study, through a patient sample-driven transcriptomic and epigenetic description of the MF microenvironment landscape and cell-based analyses, we identify homeobox B7 (HOXB7) overexpression and more precisely a potentially novel TGF-β/WNT/HOXB7 pathway as associated to a pro-fibrotic and pro-osteoblastic biased differentiation of mesenchymal stromal cells (MSCs). Using gene-based and chemical inhibition of this pathway, we reversed the abnormal phenotype of MSCs from patients with MF, providing the MPN field a potentially novel target to prevent and manage evolution to MF.

Keywords: Bone marrow; Fibrosis; Hematology.


Figures

Figure 1
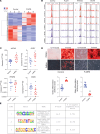
Figure 1. Expanded bone marrow MSCs from patients with MPN MF show an inflammatory profile and a biased osteoblast differentiation.
(A) Experimental workflow of this study (illustration created using BioRender). ATAC-Seq, assay for transposase-accessible chromatin using sequencing. (B) Representative phase contrast images of expanded bone marrow MSCs from either patients with MPN MF patients or healthy age-matched controls. The spindle shape morphology of control MSCs (left) shifts to a stellar morphology in F-MPNs (right). Pictures were taken on passage 2. Scale bar = 20× original magnification. (C) Immunophenotypic characterization of expanded F-MPNs and control MSCs. All markers were present but differentially expressed in F-MPNs compared with controls. P values (*<0.05, **<0.01, ***<0.001) were calculated using unpaired t test. (D) Cytokine secretion profile of expanded MSCs. Day 3 supernatants at passage 2 were analyzed using a multiplexed Luminex assay. F-MPNs show a significant increase in inflammatory cytokine levels. P values (*<0.05, **<0.01, ***<0.001) were calculated using unpaired t test. (E) Heatmap and unsupervised hierarchical clustering by sample and gene were performed using the 300 genes (RNA-Seq data) that had the largest coefficients of variation based on DESeq2 analysis. The data are based on samples from the F-MPNs (n = 7) and control (n = 4) MSC group. (F) Volcano plot showing the relationship between the P values and the log2 fold-change in normalized expression (DESeq2) between F-MPNs (n = 7) and control MSCs (n = 4). Genes found to be the most differentially expressed are shown in the plot by P value. (G) Gene set enrichment analysis (GSEA) of RNA-Seq data between F-MPNs (n = 7) and control MSCs (n = 4) demonstrates an enrichment of gene sets of the fibrosis pathway. (H) Bar graph showing the pathways differentially expressed in the RNA-Seq analysis from control MSCs versus F-MPNs identified by DAVID pathway analysis. (I) Bar graph showing upregulation of osteoblast-associated genes and downregulation of adipocyte-associated genes in RNA-Seq data of F-MPNs.
Figure 2
Figure 2. ATAC-Seq and in vitro differentiation assays verify the osteoblast bias of F-MPN MSCs.
(A) Heatmap of ATAC-Seq peak intensity shows different accessible chromatin regions of the top 200 most variable genes (accessible chromatin — rows) across F-MPNs (n = 3) and control MSCs (n = 3) (columns). The color indicates scaled accessibility score. (B) Genome tracks around the loci of genes involved in fibrosis (ACTA2), osteoblast differentiation (PLZF), chondrocyte differentiation (SOX9), or adipocyte differentiation (PPARG) show an increased accessibility for ACTA2 and PLZF genes and a decreased accessibility for SOX9 and PPARG genes in F-MPNs. The genome tracks are from representative F-MPNs (n = 3) and control (n = 3) MSCs. (C) qRT-PCR validation of the ATAC-Seq and RNA-Seq findings in F-MPNs (n = 10) and control MSCs (n = 13). Both the fibrotic (ACTA2) and osteoblast markers (PLZF) are verified as upregulated in F-MPN samples while chondrocyte or adipocyte differentiation markers (SOX9, PPARG) are also verified as significantly decreased or at least show a trend toward significance. P values (*<0.05) were calculated using unpaired t test. (D) Representative differentiation induction profile of expanded MSCs (left panel: microscopy images after respective lineage staining for osteoblastic and adipocyte lineage Original magnification is ×10; right panel: arbitrary quantification of osteoblast and adipocyte differentiation). F-MPN MSCs show a biased differentiation profile toward the osteoblast lineage with a decrease in adipocyte lineage. **P value < 0.01 calculated using unpaired t test. Of note, F-MPN-1, 2, 3 and control 1, 2, 3 are from the same patients whom we analyzed in Figures 1 and 3. (E) HOMER DNA motif enrichment analyses of differentially accessible peaks (F-MPN versus control) show the enrichment of binding motifs for osteoblast differentiation transcription factors.
Figure 3
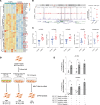
Figure 3. ATAC-Seq, RNA-Seq, and coculture studies highlight HOXB7 upregulation in F-MPN samples.
(A) Heatmap showing the top 50 differentially regulated genes from RNA-Seq data. Unsupervised hierarchical clustering by sample and gene were performed. The data are based on samples from the F-MPN (n = 7) and control (n = 4) MSC groups. In the top 50 genes, boxed genes are associated with either fibrosis or osteoblast differentiation pathways. (B) Gene accessibility tracks of HOXB genes (ATAC-Seq) show a statistically significant increased accessibility in F-MPNs (example of the HOXB-AS3-HOXB7 region is quantified in the right panel). P value *< 0.02 calculated using unpaired t test. (C) qRT-PCR validation of the ATAC-Seq and RNA-Seq findings in control (n = 13) and F-MPN (n = 10) samples. Several HOXB genes are upregulated in F-MPN MSCs. P values (*<0.05, **<0.01) were calculated using unpaired t test. (D) In vitro coculture of normal human mesenchymal cells from the HS-5 cell line with either cells or conditioned media from human hematopoietic cell line UT-7 bearing either the wild-type JAK2 gene (WT) or the mutated JAK2 V617F gene (VF) or with TGF-β (10 ng/mL). (E) After 7 days’ coculture, an increased expression of HOXB7 and ACTA2 genes is noted in the MSCs after exposure to TGF-β or JAK2-mutated cells (VF). P values (*<0.05) were calculated using unpaired t test.
Figure 4
Figure 4. Knockdown of HOXB7 gene alters the potential of MSCs for osteodifferentiation.
(A) Knockdown of HOXB7 by shRNA in the HS-5 mesenchymal cell line. The reduced expression of HOXB7 is validated in an shRNA-transfected cell line by qRT-PCR. (B) Knockdown of HOXB7 by shRNA in the HS-5 mesenchymal cell line. Western blot showing absence of HOXB7 in 2 shRNA-transfected cell lines results in downregulation of the downstream target α-SMA (protein encoded by the ACTA2 gene). (C) Gene accessibility tracks of 2 osteoblast-associated genes, ACTA2 and TAGLN, by ATAC-Seq. HS-5 cells with reduced expression of HOXB7 (HOXB7-KD3) show reduced chromatin accessibility of the ACTA2 and TAGLN genes even after incubation with TGF-β (10 ng/mL for 3 days). (D) qRT-PCR validation of the ATAC-Seq findings showing significantly reduced expression of the ACTA2 and TAGLN genes in the HOXB7-KD3 cells in the presence of TGF-β. P values *<0.05, **<0.02 calculated using unpaired t test. (E) qRT-PCR results showing the downregulation of HOXB7 and TAGLN even in the presence of TGF-β upon doxycycline (Dox) addition, and the same is restored when the Dox is withdrawn from the same cells after 3 days (n = 3). (F) Osteoblast differentiation induction assay of HS-5 cells after transfection with either scramble (SCR) or HOXB7 shRNA (HOXB7 KD3) alone or after treatment with TGF-β for 21 days. (Left panel: microscopy images after osteoblast lineage staining; original magnification is ×10; right panel: arbitrary quantification of osteoblast differentiation.) Absence of HOXB7 reduces osteoblast differentiation even in the presence of TGF-β. P values were calculated using 1-way ANOVA test.
Figure 5
Figure 5. TGF-β–induced WNT signaling drives the HOXB7-mediated pro-osteogenic profile of MSCs.
(A) Treatment of normal human mesenchymal cells (HS-5) with TGF-β (2 and 10 ng/mL) stabilizes β-catenin levels (immunoblot). (B) Treatment of normal human mesenchymal cells (HS-5) with TGF-β (10 ng/mL) induces translocation of β-catenin to the nucleus (red arrows). Microscopy images after staining with mAb-β-catenin (green) and DAPI (blue nucleus) (representative of 3 experiments). Original magnification, ×100. (C) ChIP assay of the HOXB7 promoter. Incubation with TGF-β (10 ng/mL) drives increased chromatin accessibility (reduced H3K9me3 marks) and binding of β-catenin (n = 3) to the HOXB7 promoter. P value *<0.05, unpaired t test. (D) Knockdown of β-catenin in HS-5 cell line by a β-catenin shRNA (β-Cat KD), validated by Western blot (right), induces reduced expression of HOXB7 and its downstream target α-SMA (protein encoded by ACTA2) in the absence or presence of TGF-β. (E) Osteoblast and adipocyte differentiation induction assay of normal mesenchymal HS-5 cells after transfection with scramble (SCR) or β-catenin shRNA (β-Cat KD). Microscopy images after respective lineage staining show that absence of β-catenin decreases osteoblast differentiation and increases adipocyte differentiation. Original magnification, ×10. (F) Pretreatment of HS-5 cells with WNT inhibitor (cardamonin 20 μM) followed by treatment with TGF-β reduces the expression of HOXB7 and α-SMA along with other WNT pathway genes such as c-MYC and Cyclin-D1 (n = 3). (G) Treatment of HS-5 cells with TGF-β and WNT inhibitor reduces the expression of ACTA2 and TAGLN genes validated by qRT-PCR (n = 3). P value **<0.02, unpaired t test. (H) Osteodifferentiation induction of HS-5 cells shows a decreased osteoblast differentiation profile upon treatment by cardamonin (n = 3). Original magnification, ×10. P value *<0.05, unpaired t test.
Figure 6
Figure 6. Graphical diagram describing the role of the WNT/TGF-β/HOXB7 axis in MPN patients’ MSC deregulation.
Illustration created using BioRender.com.

References

    1. Zahr AA, et al. Bone marrow fibrosis in myelofibrosis: pathogenesis, prognosis and targeted strategies. Haematologica. 2016;101(6):660–671. doi: 10.3324/haematol.2015.141283. - DOI - PMC - PubMed
    1. Mughal TI, et al. Myelofibrosis-associated complications: pathogenesis, clinical manifestations, and effects on outcomes. Int J Gen Med. 2014;7:89–101. - PMC - PubMed
    1. Passamonti F, et al. A clinical-molecular prognostic model to predict survival in patients with post polycythemia vera and post essential thrombocythemia myelofibrosis. Leukemia. 2017;31(12):2726–2731. doi: 10.1038/leu.2017.169. - DOI - PubMed
    1. Cerquozzi S, Tefferi A. Blast transformation and fibrotic progression in polycythemia vera and essential thrombocythemia: a literature review of incidence and risk factors. Blood Cancer J. 2015;5(11):e366. doi: 10.1038/bcj.2015.95. - DOI - PMC - PubMed
    1. Shammo JM, Stein BL. Mutations in MPNs: prognostic implications, window to biology, and impact on treatment decisions. Hematology Am Soc Hematol Educ Program. 2016;2016(1):552–560. doi: 10.1182/asheducation-2016.1.552. - DOI - PMC - PubMed