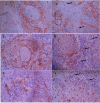
The Expression of PDL-1 and PD1 in the Microenvironment of Oral Squamous Cell Carcinoma
- PMID: 39471013
- PMCID: PMC11711342
- DOI: 10.31557/APJCP.2024.25.10.3471
The Expression of PDL-1 and PD1 in the Microenvironment of Oral Squamous Cell Carcinoma
Abstract
Objective: Immune checkpoint proteins, especially PD-1/PD-L1, play a vital role in controlling the intensity and duration of the immune response. However, cancer cells often over-expression PDL-1 on their surfaces, which leads to the permanent activation of the PD-1/PDL-1 pathway and exhaustion of T cells and creates a resistant tumor microenvironment. This study aimed to analyze PD-1, PD-L1 expression in tumor cells (PDL-1/TC) and in Tumor-Infiltrating Lymphocytes (PDL-1/TILS) of OSCC patients and associated with and to correlate it with histologic grade of malignancy and clinicopathologic parameters.
Methods: The sample consisted of 43 archived specimens of 43 patients of OSCC with Clinical features (gender, age, smoking, clinical stage) collected from medical records between 2014-2021. The intensity of PD-1, PDL-1/TC, PDL-1/TILS, positive cells were assessed by immunohistochemistry.
Result: PDL-1/TILS and PDL-1/TC were observed in all specimens except two cases in well-differentiated were negative. PDL-1/TILS was significant between histological grades(P=0.004<0.05). There was no significant between PDL-1/TC and PDL-1/TILS and between poorly differentiated and moderately differentiated groups' ROC P values (P=0.133, 0.340>0.05) respectively. There is a difference between PDL-1/TC and PDL-1/TILS between poorly differentiated and well-differentiated groups ROC P value (0.005, 0.028), Sensitivity (0.857, 0.857), specificity (0.765, 0.824) respectively and there is a difference between and PDL-1/TILS moderate differentiated and well-differentiated groups ROC P value (0.133,) Sensitivity (0.737), specificity (0.765). No differences between PDL-1/TC and moderate and well-differentiated groups P value (0.173). There is a significant correlation between PDL-1/TC and PDL-1/TILS with an age P>65 value (0.032) in the well-differentiated group. PDL-1/TC and PDL-1/TILS with the depth of invasion (DOI) in the well-differentiated group. No significant correlation was obtained between PDL-1/TC and PDL-1/TILS and smoking, clinical stage, and gender. No significant correlation was obtained between PD1 and the histological grades or clinicopathologic characteristics.
Conclusion: PDL-1/TILS and PDL-1/TC are independent prognostic factors in OSCC and PDL1-/TILS has an important role.
Keywords: immune checkpoints; programmed cell death protein 1; programmed death ligand 1; tumor-infiltrating lymphocytes.
Conflict of interest statement
All patients have consented to all clinical data included in this study according to the ethical approval of the research (number 2650 on the date of 2/8/2021 ,Scientific Research Committee /Damascus university )
Figures


References
-
- Sung H, Ferlay J, Siegel RL, Laversanne M, Soerjomataram I, Jemal A, Bray F. Global Cancer Statistics 2020: GLOBOCAN Estimates of Incidence and Mortality Worldwide for 36 Cancers in 185 Countries. CA Cancer J Clin. 2021;71(3):209–249. - PubMed
-
- Ng JH, Iyer NG, Tan MH, Edgren G. Changing epidemiology of oral squamous cell carcinoma of the tongue: A global study. Head Neck. 2017;39(2):297–304. - PubMed
MeSH terms
Substances
LinkOut - more resources
Full Text Sources
Medical
Research Materials

