. 2024 Nov 26;43(11):114919.
doi: 10.1016/j.celrep.2024.114919. Epub 2024 Oct 30.

Highly neurogenic glia from human and mouse myenteric ganglia generate functional neurons following culture and transplantation into the gut

Affiliations

Highly neurogenic glia from human and mouse myenteric ganglia generate functional neurons following culture and transplantation into the gut

Jessica L Mueller et al. Cell Rep. .

Abstract

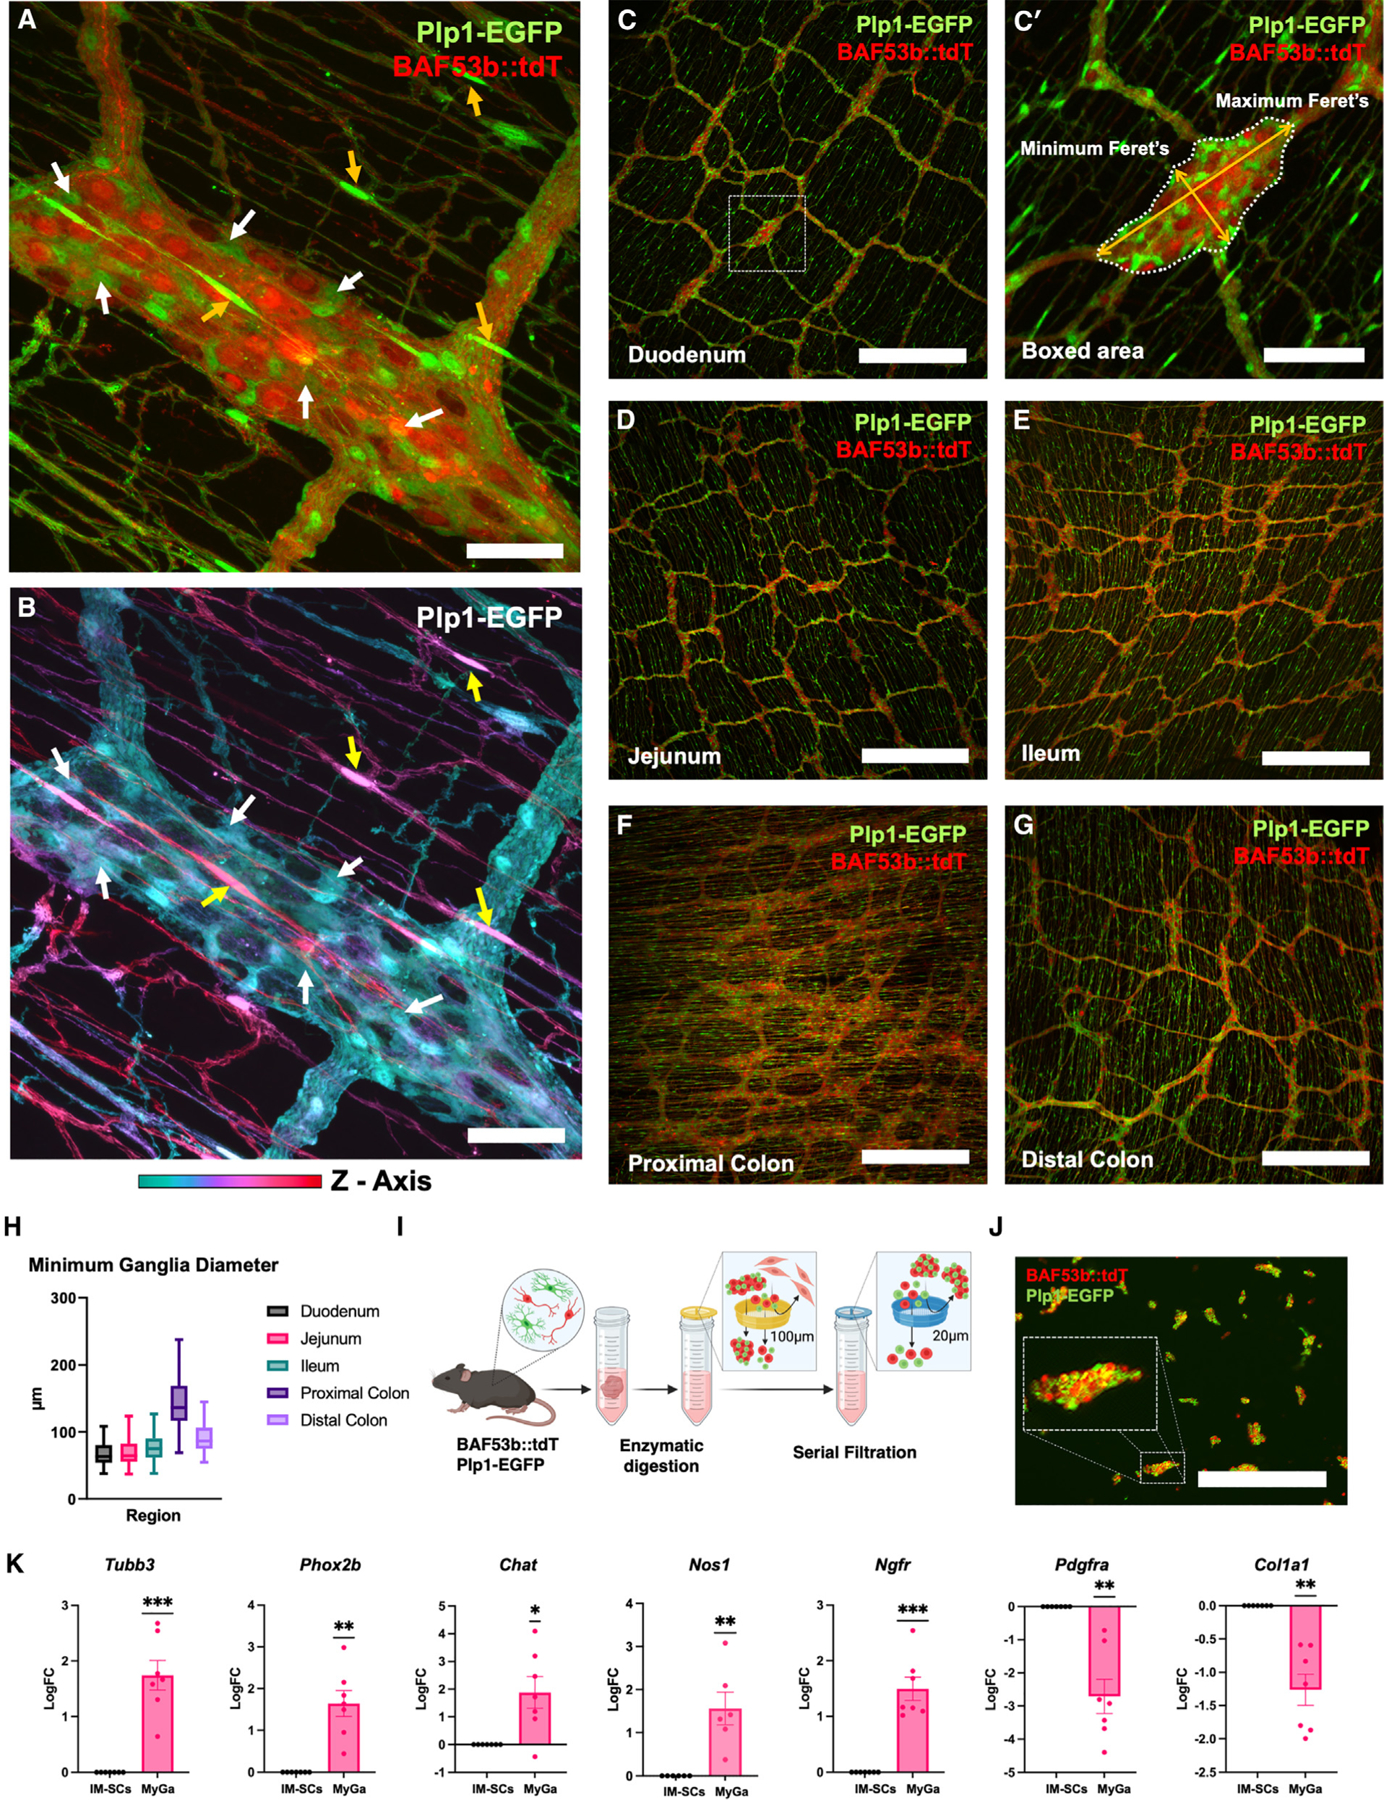
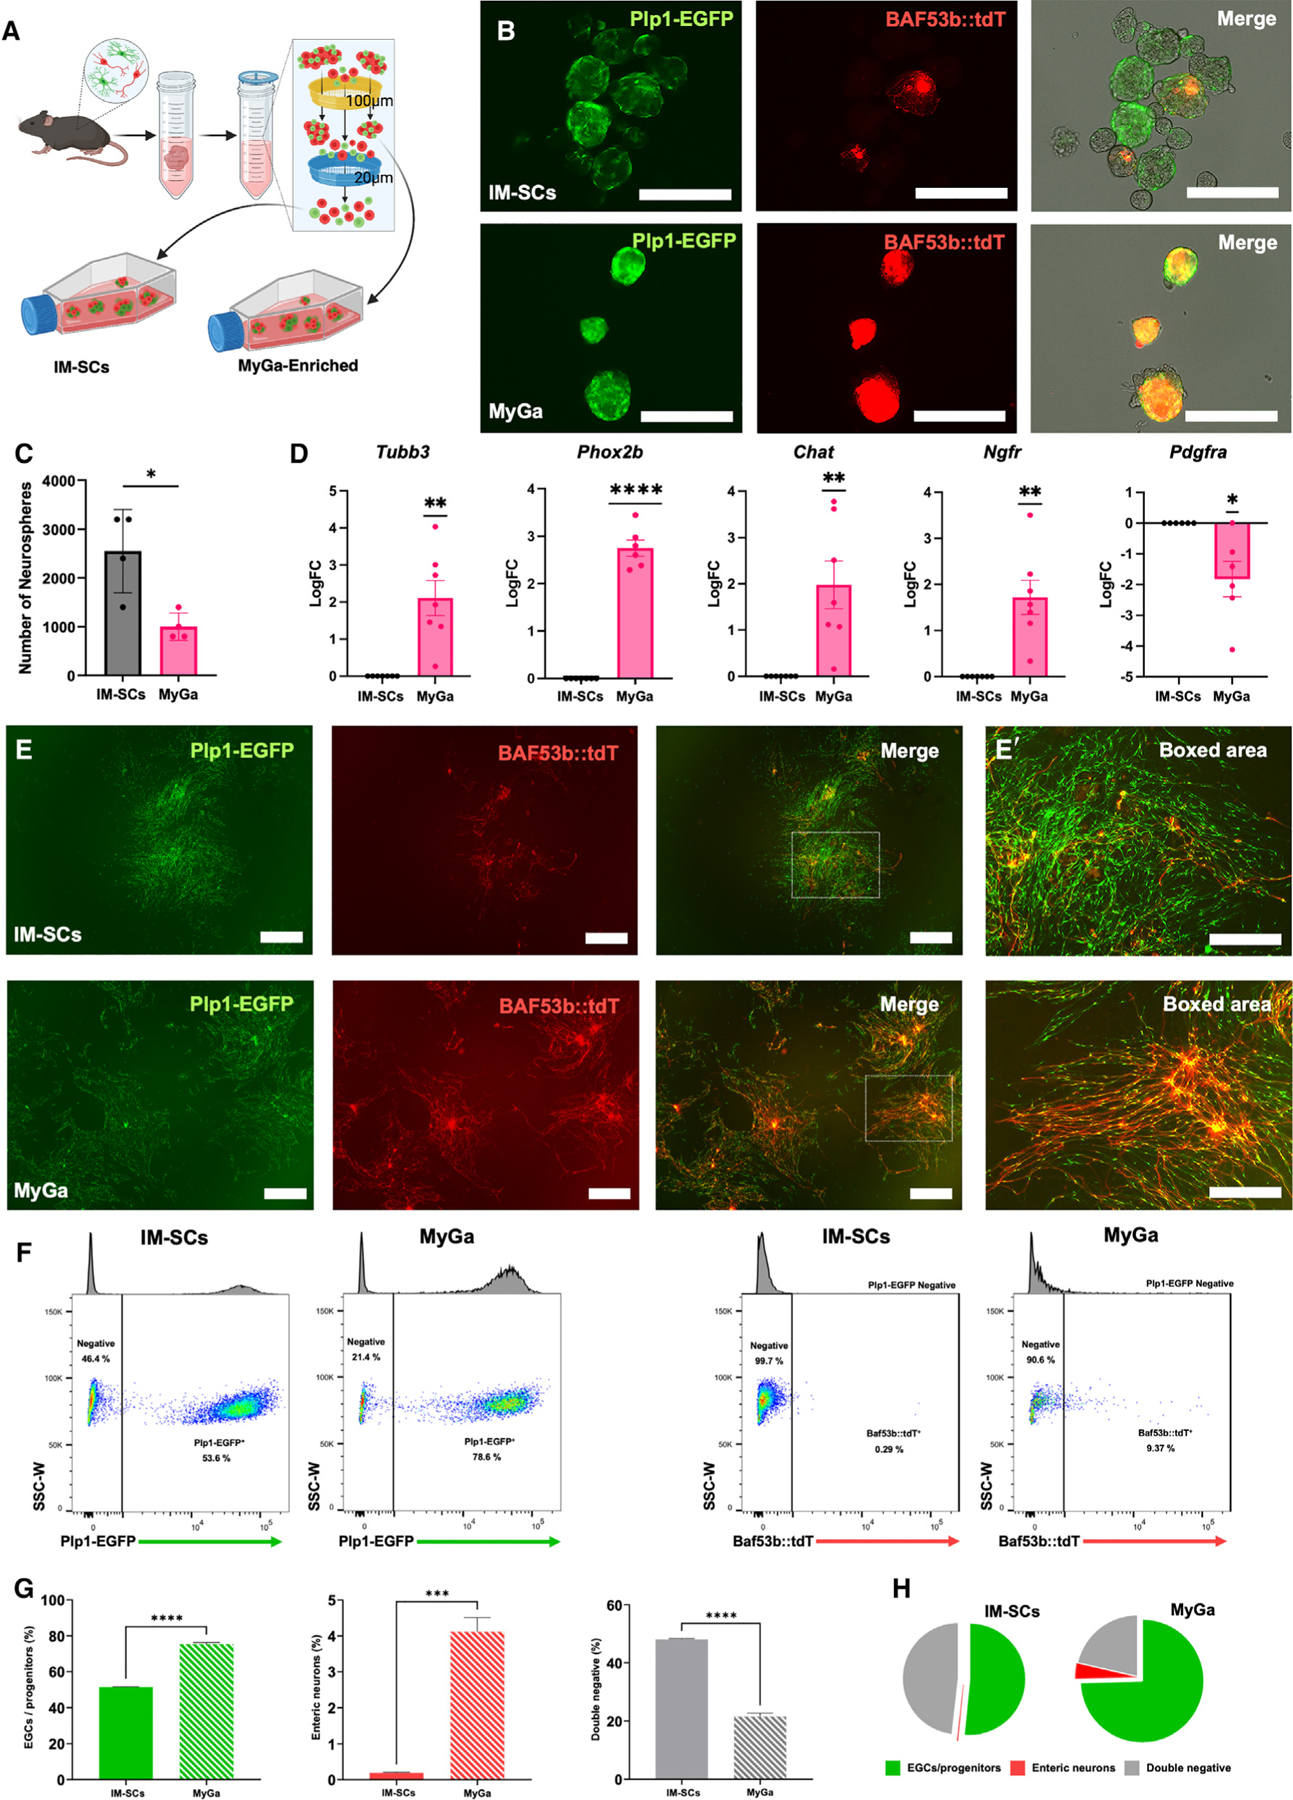
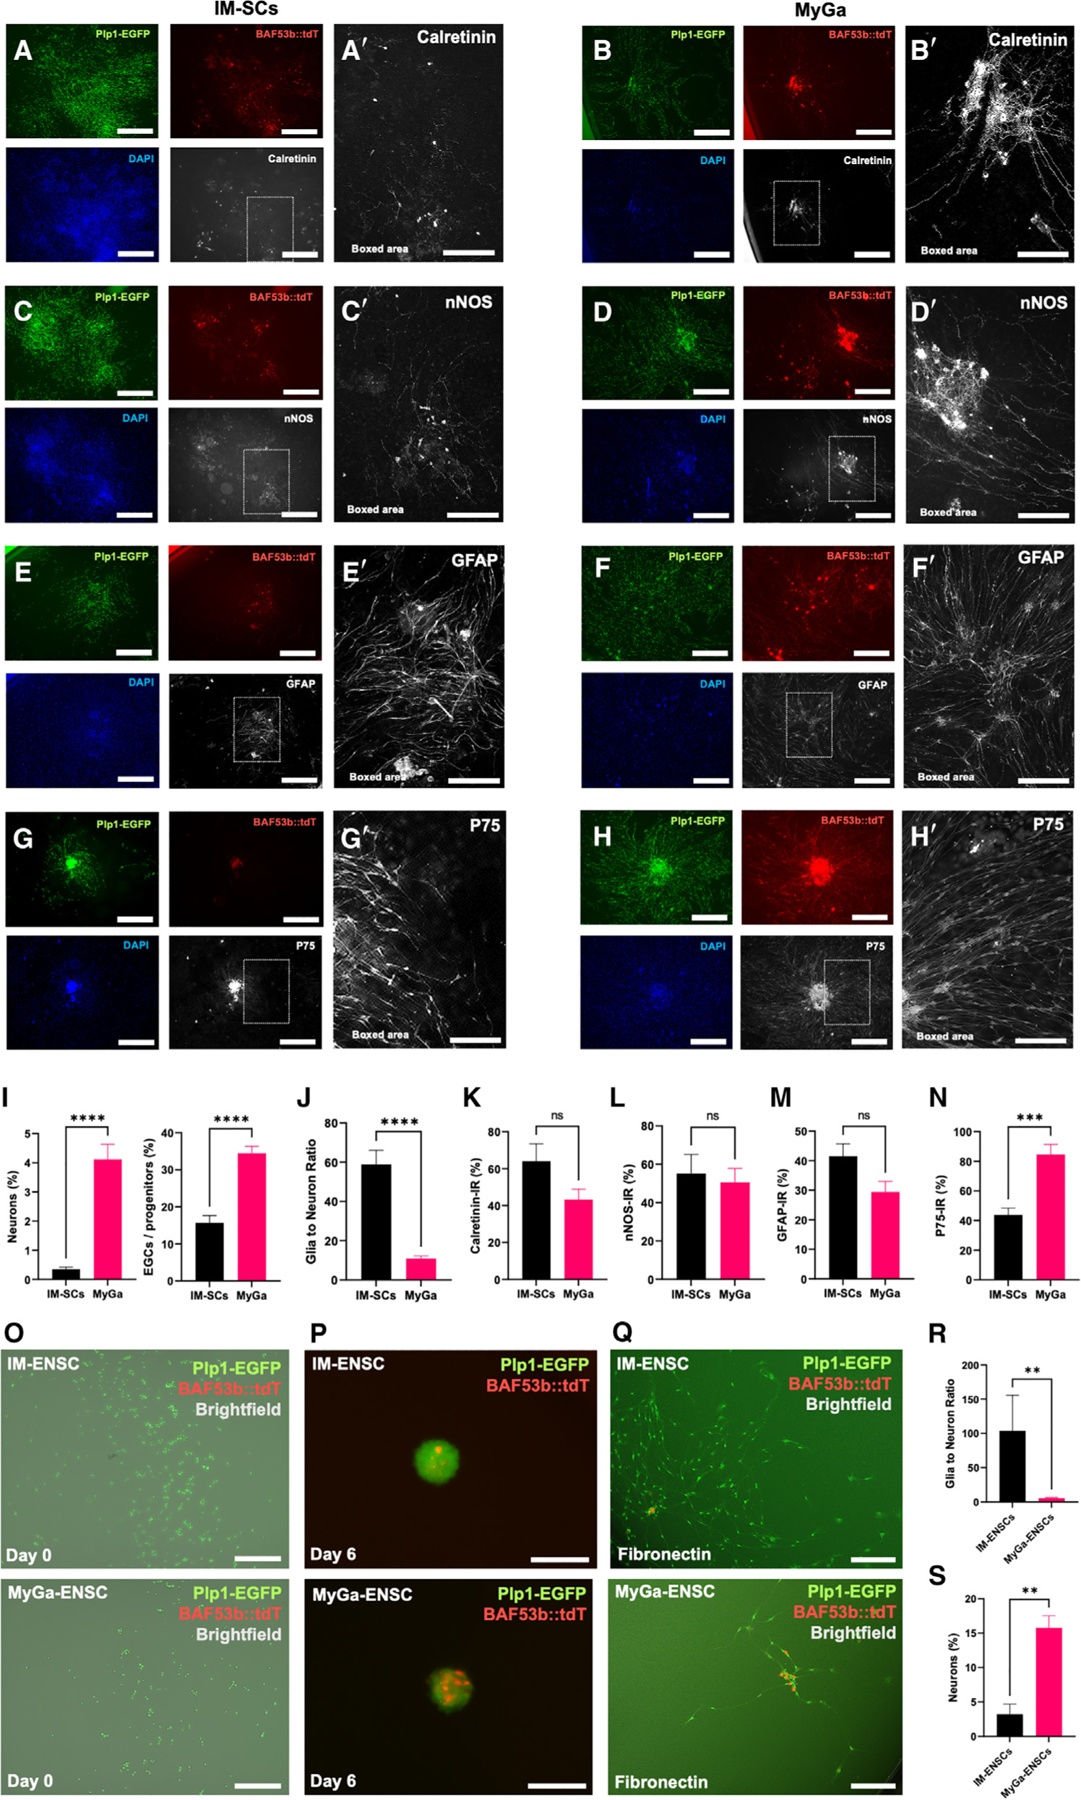
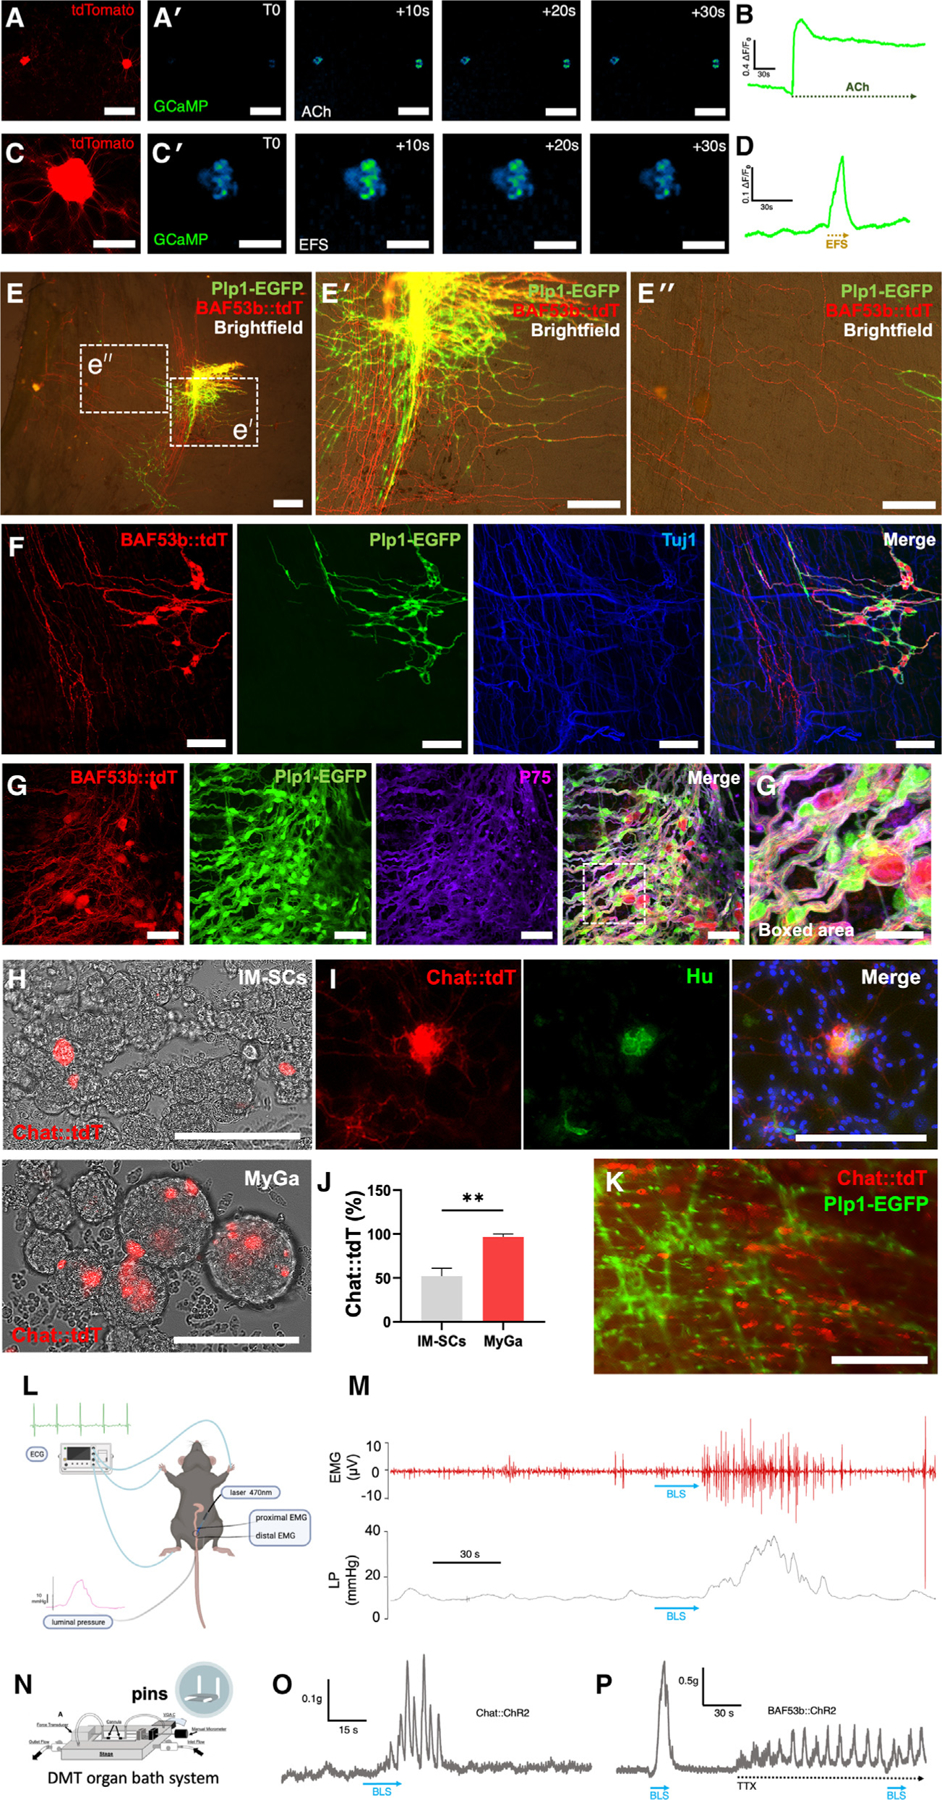
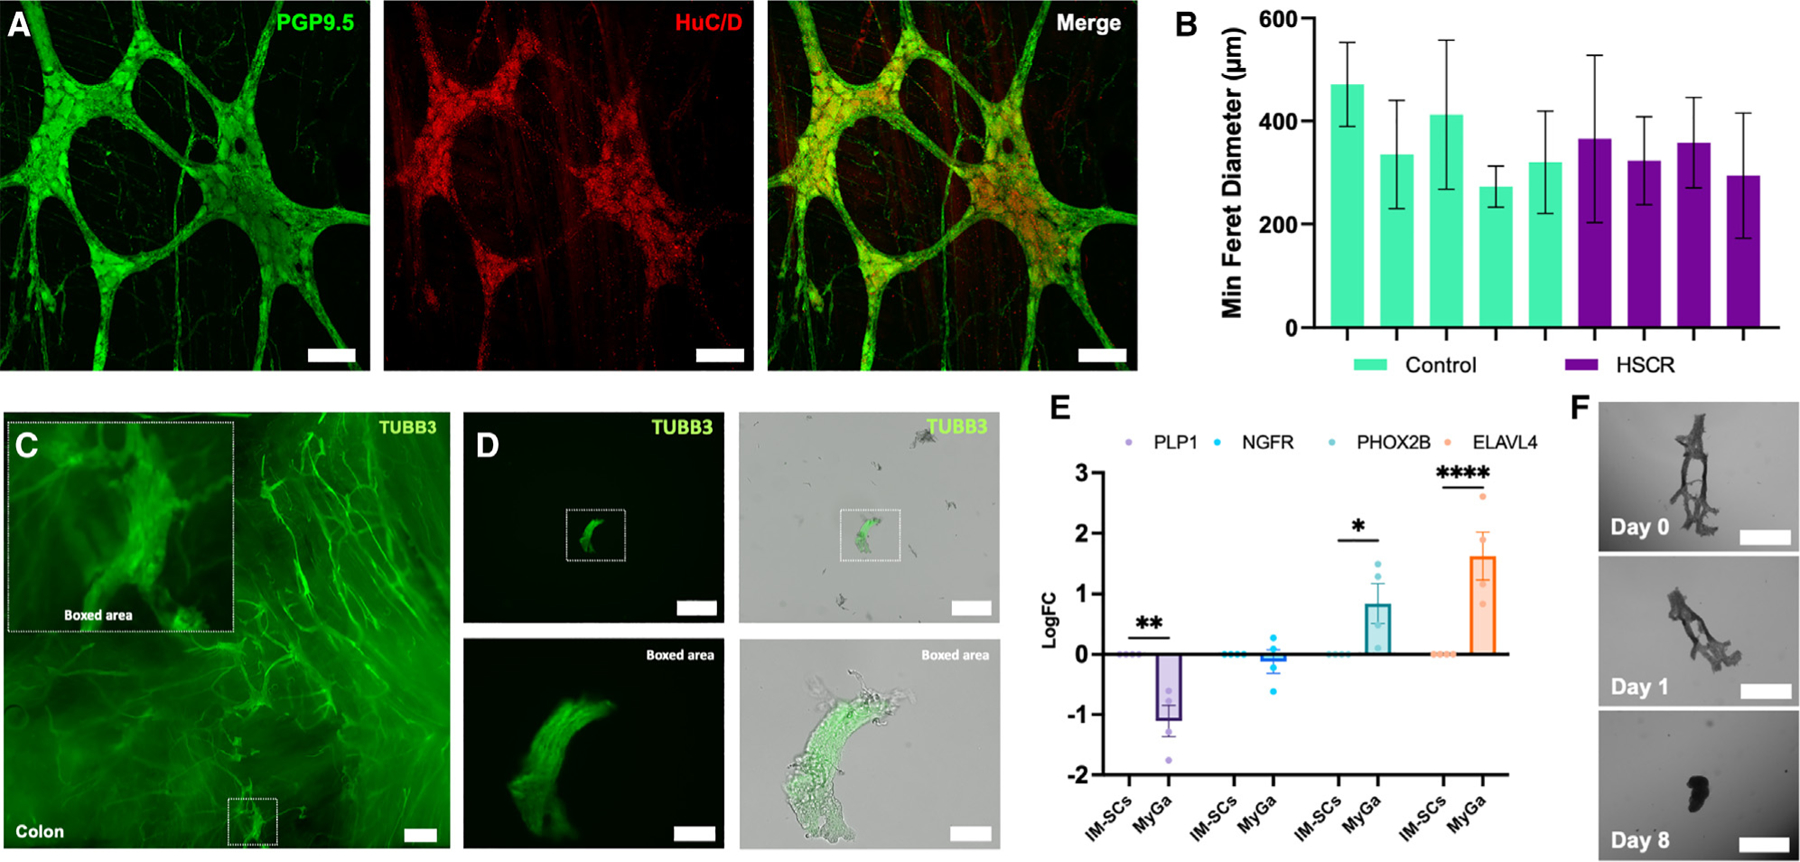
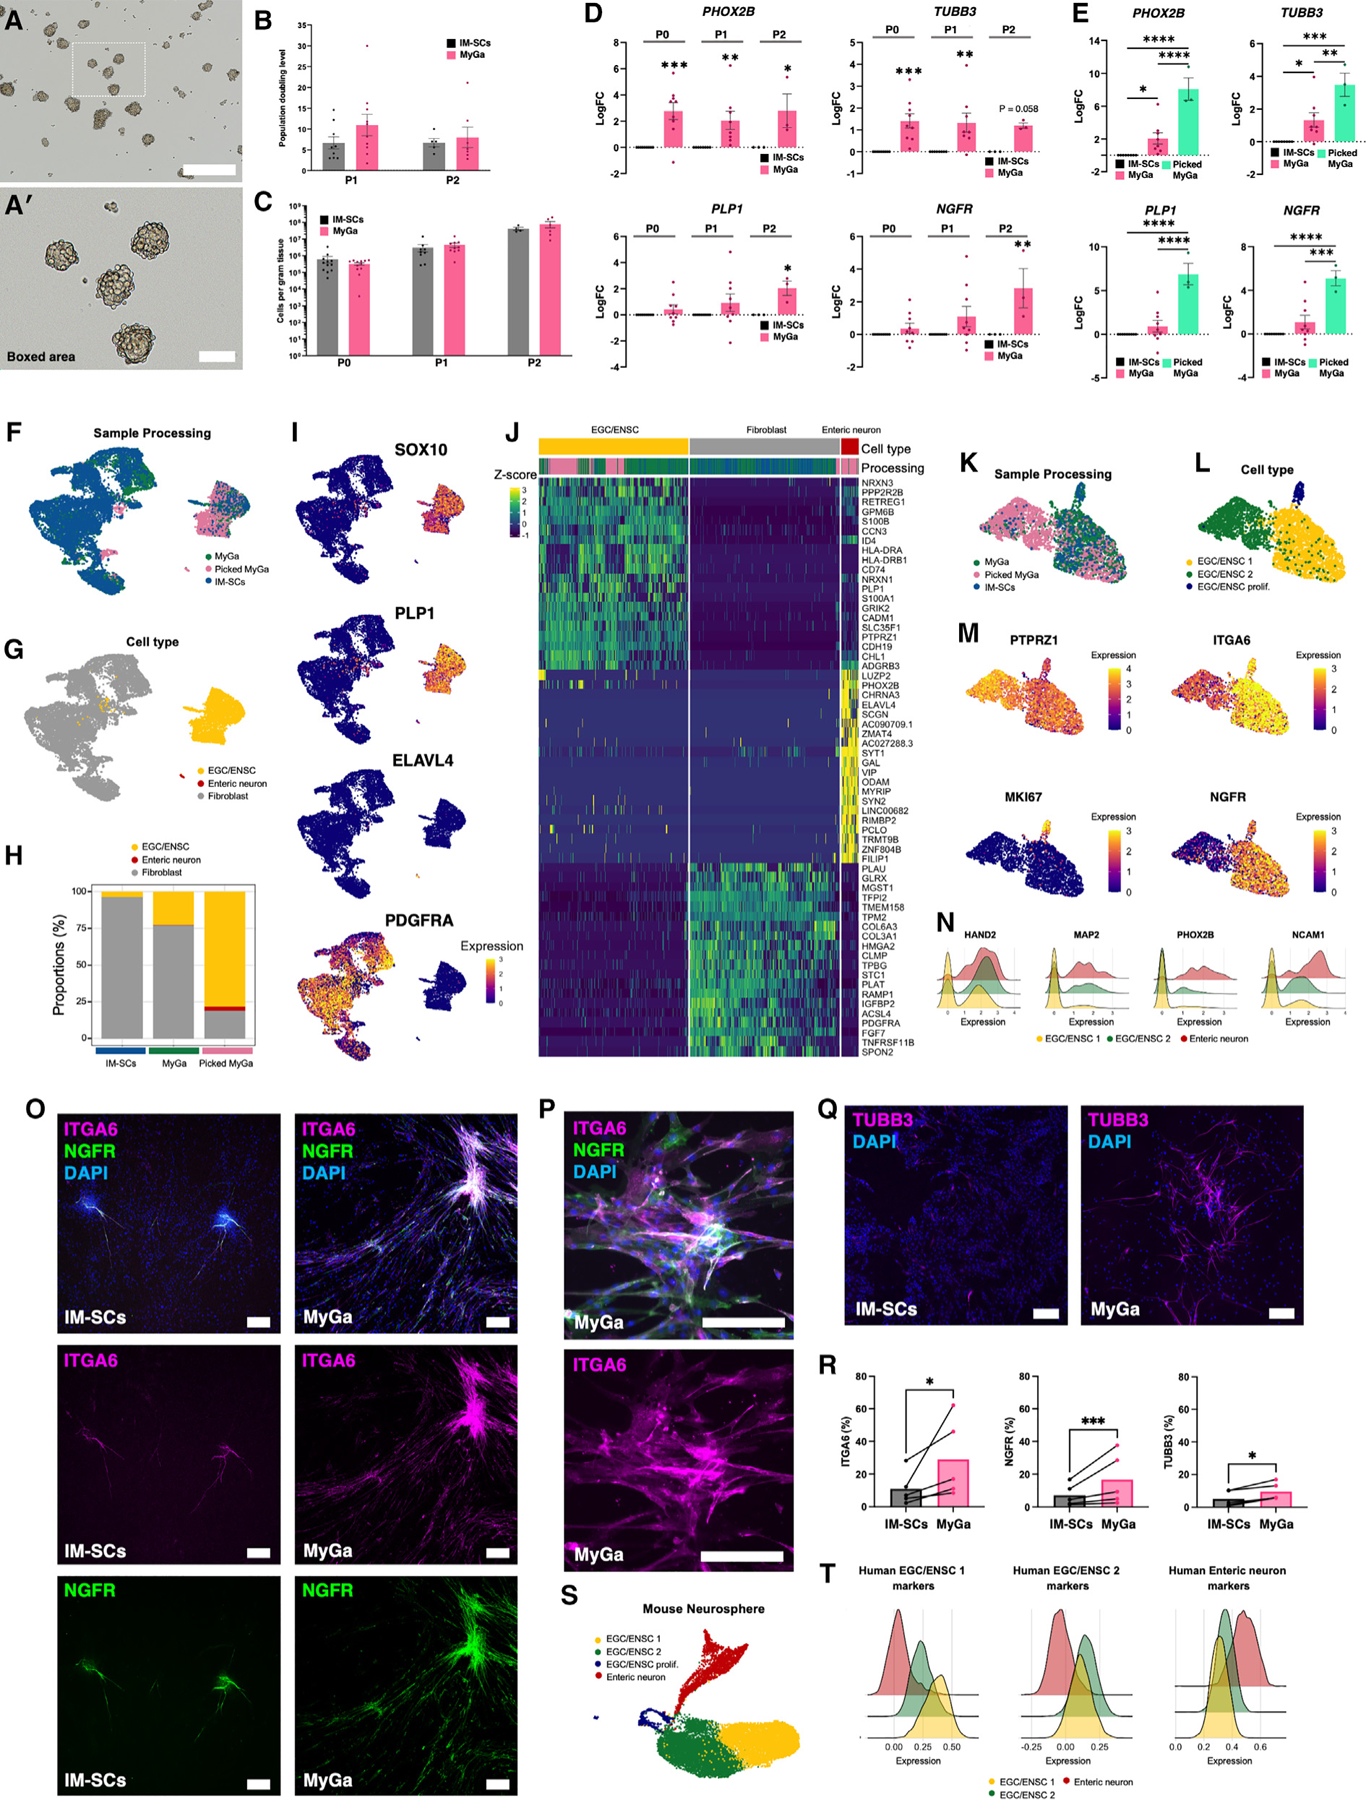
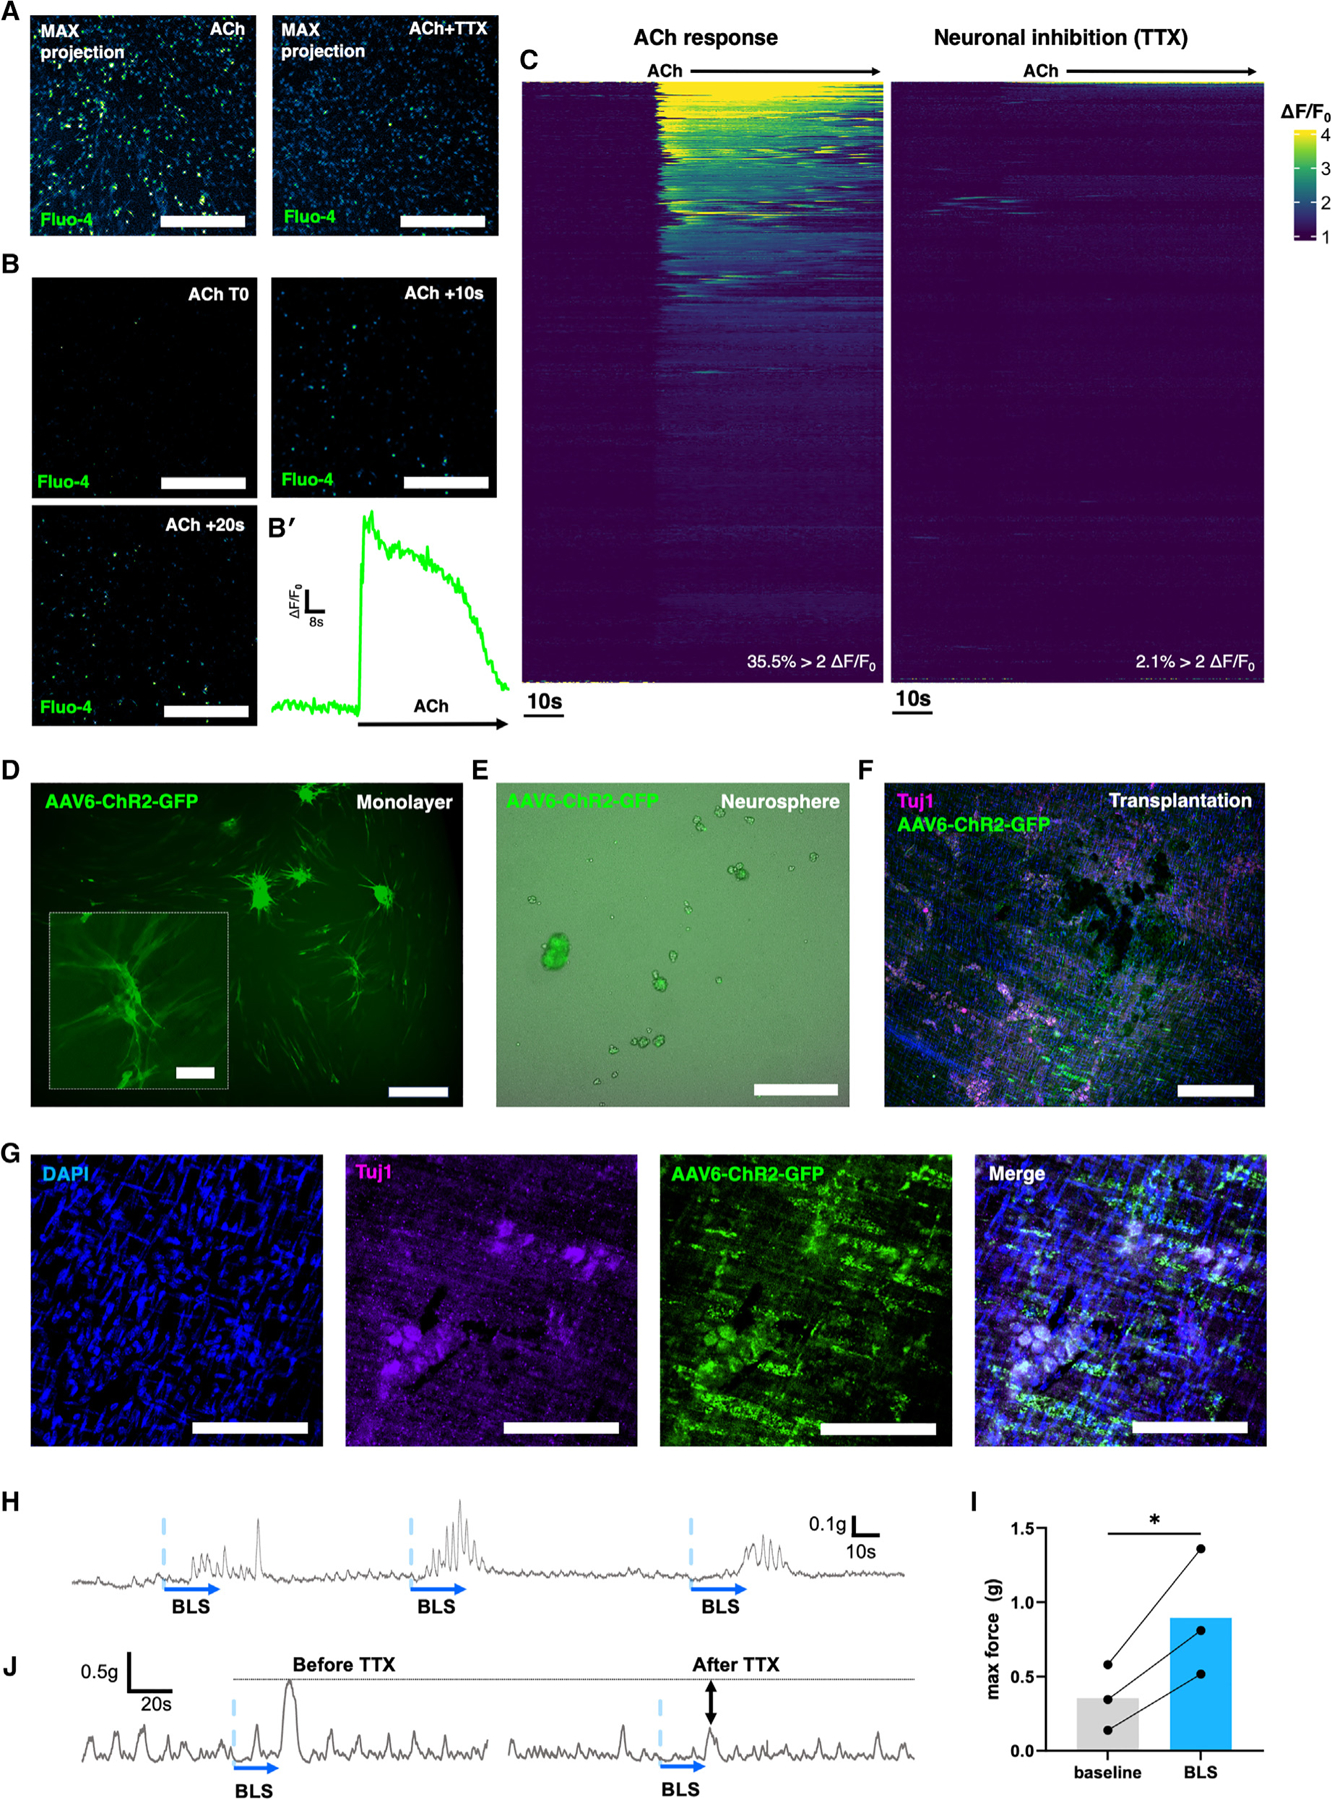
Enteric neural stem cell (ENSC) therapy offers great promise for neurointestinal diseases; however, current isolation methods yield insufficient neurons for regenerative applications. Multiomic profiling of enteric glial cells (EGCs) suggests that subpopulations within myenteric ganglia (MyGa) are a reservoir of highly neurogenic ENSCs. Here, we describe protocols to enrich for intraganglionic EGCs by isolating intact fragments of MyGa, generating cultures with higher neuronal purity than traditional methodologies isolating intramuscular single cells (IM-SCs). MyGa-derived EGCs transdifferentiate into more neurons than IM-SC-derived EGCs do, confirming their neurogenic predisposition. Following transplantation to the mouse intestine, MyGa-derived neurons generate calcium transients and activate smooth muscle in response to optogenetic stimulation. In the human intestine, MyGa-derived cells are similarly highly neurogenic, are enriched for a distinct progenitor population identified by single-cell RNA sequencing (scRNA-seq), and exhibit neuromuscular connectivity following xenogeneic transplantation into mice. Highly neurogenic ENSCs are preferentially located within the MyGa, and their selective isolation offers considerable potential for therapy.

Keywords: CP: Neuroscience; CP: Stem cell research; cell therapy; enteric glial cell; enteric nervous system; enteric neural stem cell; enteric neuron; myenteric ganglia; neurogenesis; neuroregeneration; postnatal; regeneration.


Conflict of interest statement

Declaration of interests R.S., A.M.G., and R.H. are inventors on US provisional patent application 63/659,137 submitted by The General Hospital Corporation that covers “Isolation of enteric neurons and progenitors from the enteric ganglia for cell therapy.”

Figures

Figure 1.
Figure 1.. Intact MyGa can be isolated from the mouse intestine
(A) Representative images of the myenteric ganglia (MyGa) of BAF53b::tdT; Plp1-EGFP mice, with Plp1-EGFP serving as a EGC marker and BAF53b::tdT as a neuronal marker. Scale bar: 50 μm. (B) Depth-coded projection of the z axis of Plp1-EGFP fluorescence, showing EGCs within the MyGa (white arrows) and EGCs in the IM space above (yellow arrows). Also see Video S1. Scale bar: 50 μm. (C–G) Representative images of the myenteric plexus from intestinal regions of BAF53b::tdT; Plp1-EGFP mice. Scale bars: 500 μm. (Cʹ) Minimum and maximum Feret’s diameters of a MyGa. Scale bar: 100 μm. (H) Quantification of the minimum Feret’s diameter of MyGa in intestinal regions. Boxplots are reported as mean ± 95% confidence interval (CI). n = 24 ganglia/segment. (I) Schematic overview of MyGa enrichment from the enzymatically digested bowel using counter filtration. (J) Representative image of the MyGa-enriched fraction after digestion from the gut of BAF53b::tdT; Plp1-EGFP mice. The inset shows a high-magnification view of a MyGa within the digested material. Scale bar: 500 μm. (K) Quantitative PCR of Tubb3, Phox2b, Chat, Nos1, Ngfr, Pdgfra, and Col1a1 in digested single-cell suspensions and the MyGa-enriched fractions. One-sample t test to log fold change (LogFC) of 0, *p < 0.05, **p < 0.01, ***p < 0.001; n = 6–7 mice per group.
Figure 2.
Figure 2.. Neurospheres generated from the MyGa-enriched fraction have a higher purity of enteric neurons, EGCs, and progenitor cells
(A) Generation of neurospheres from MyGa and the single-cell flowthrough. (B) Representative images of neurospheres generated from single-cell suspensions (IM-SCs) and the MyGa-enriched fractions from the small intestine of BAF53b::tdT; Plp1-EGFP mice. Scale bars: 250 μm. (C) Quantification of the number of neurospheres generated from single-cell suspensions and the MyGa-enriched fractions. Data are mean ± SEM. Unpaired t test, *p < 0.05, n = 3 mice per group. (D) Quantitative PCR of Tubb3, Phox2b, Chat, Ngfr, Pdgfra, and Col1a1 in neurospheres generated from IM-SCs and the MyGa-enriched fractions. One-sample t test to LogFC of 0, *p < 0.05, **p < 0.01, n = 6–7 mice per group. (E and Eʹ) Cells from neurospheres after 1 week of migration, forming monolayers on fibronectin. Samples were originally generated from IM-SCs and the MyGa-enriched fractions as above. Scale bars: 1,000 μm (E) and 500 μm (Eʹ). (F) Flow cytometry data for EGCs/progenitors (Plp1-EGFP) and enteric neurons (BAF53b::tdT) derived from monolayer cultures. (G) Quantification of the number of EGCs/progenitors (Plp1-EGFP), enteric neurons (BAF53b::tdT), and double-negative cells from flow cytometry on monolayer cultures originally derived from IM-SCs and the MyGa-enriched fractions. Data are mean ± SEM. Unpaired t test, ***p < 0.001, ****p < 0.0001, n = 3 mice per group. (H) Pie chart representation of the proportions of EGCs/progenitors (Plp1-EGFP), enteric neurons (BAF53b::tdT), and double-negative cells from flow cytometry analysis.
Figure 3.
Figure 3.. Neurospheres generated from MyGa retain neuronal subtypes important for the recapitulation of the ENS, and MyGa-derived ENSCs exhibit higher rates of enteric neurogenesis
(A–Hʹ) Representative images of monolayer cultures originally derived from intramuscular single cells (IM-SCs) or the MyGa-enriched fractions immunohistochemically labeled for calretinin (A–Bbʹ), nNOS (C–Dʹ), GFAP (E–Fʹ), and P75 (G–Hʹ). Scale bars: 1,000 μm (A–H) and 250 μm (Aʹ–Hʹ). (I) Quantification of the percentage of EGCs/progenitors (Plp1-EGFP) and enteric neurons (BAF53b::tdT) in monolayer cultures, determined by fluorescent imaging. (J) EGC-to-neuron ratios in the same samples, determined by Plp1-EGFP and BAF53b::tdT fluorescence. Data are mean ± SEM. Unpaired t test, ****p < 0.0001, n = 19–20 independent cultures per group. (K–N) Quantification of the percentage of neurons (BAF53b::tdT) immunoreactive (IR) for calretinin (K) and nNOS (L) as well as the percentage of EGCs/progenitors (Plp1-GFP) IR for GFAP (M) and P75 (N). Data are mean ± SEM. Unpaired t test, ***p < 0.001, n = 5–7 independent cultures per group. (O) Plp1-EGFP cells immediately after purification by FACS of cultures derived from IM-SCs or MyGa-enriched fractions yielding IM-ENSCs and MyGa-ENSCs. Scale bars: 250 μm. (P) Expression of the neuronal marker BAF53b::tdT in neurospheres generated from IM-ENSCs and MyGa-ENSCs after 6 days in culture. Scale bars: 100 μm. (Q) IM-ENSC and MyGa-ENSC cultures after migration for 4 days on fibronectin. Scale bars: 200 μm. (R and S) EGC to neuron ratios (R) and the percentage of neurons to the total number of cells (S) in the same samples, determined by Plp1-EGFP and BAF53b::tdT fluorescence. Data are mean ± SEM. Mann-Whitney test, **p < 0.01, n = 6 independent cultures per group.
Figure 4.
Figure 4.. MyGa-derived cells generate calcium transients in vitro and show functional competency following transplantation to the intestine in vivo
(A and Aʹ) Enteric neurons derived from MyGa cultures generated from BAF53b::tdT-GCaMP mice. Shown is expression of tdT in enteric neurons (A) and calcium transients in response to ACh (Aʹ). See also Video S2. Scale bars: 300 μm. (B) Representative traces of calcium transients (ΔF/F0) in response to ACh stimulation. (C and Cʹ) Enteric neurons derived from MyGa cultures from BAF53b::tdT-GCaMP mice as above with BAF53b::tdT expression (C) and calcium transients in response to electric field stimulation (EFS) (Cʹ). See also Video S3. Scale bars: 100 μm. (D) Representative traces of ΔF/F0 in response to EFS stimulation. (E) MyGa-derived neurospheres from BAF53b::tdT; Plp1-EGFP mice transplanted to the colonic muscularis propria of a colorless recipient. Scale bar: 500 μm. (Eʹ and Eʹʹ) High-magnification images of the cell transplantation site (Eʹ) and the extension of nerve fiber processes from the transplant (Eʹʹ). Scale bars: 250 μm. (F) Integration of transplanted BAF53b::tdT; Plp1-EGFP cells with the endogenous myenteric plexus of the recipient labeled by Tuj1. Scale bars: 100 μm. (G) BAF53b::tdT; Plp1-EGFP cell transplants expressing the progenitor marker P75. Scale bars: 50 μm. (Gʹ) Interconnected network formed between transplanted cells. Scale bars: 25 μm. (H) Neurospheres generated from IM-SCs and the MyGa-enriched fractions from Chat-tdT-ChR2 mice. Scale bars: 200 μm. (I) Chat-tdT expression in Hu IR enteric neurons in cultures of MyGa-derived cells. Scale bars: 200 μm. (J) Percentage of neurospheres from IM-SCs and MyGa-enriched fractions containing Chat-tdT neurons. Data are mean ± SEM. Unpaired t test, **p < 0.01, n = 3 independent cultures per group. (K) Chat-tdT cells from MyGa-derived neurospheres transplanted into the muscularis propria of a Plp1-EGFP recipient mouse. Scale bar: 200 μm. (L) Experimental setup for simultaneous recordings of luminal pressure and electromyography (EMG) in vivo. (M) In vivo EMG in the smooth muscle and intraluminal pressure of the colon in response to blue light stimulation (BLS) of transplanted Chat-tdT-ChR2 cells. (N) Experimental setup for colonic ring force contraction recordings ex vivo. (O) Force of contraction produced by colonic smooth muscle in response to BLS of transplanted Chat-tdT-ChR2 cells in ex vivo organ bath experiments. (P) Trace of the above with BLS of transplanted BAF53b::tdT-ChR2 cells and TTX inhibition of neural activity.
Figure 5.
Figure 5.. Intact MyGa can be isolated from the intestinal muscularis propria in resected human specimens
(A) Representative images of the myenteric plexus in the muscularis propria from a resected colon immunohistochemically labeled with the pan-neuronal markers PGP9.5 and HuC/D. Scale bars: 100 μm. (B) Average minimum Feret’s diameter of MyGa from subjects with a normal ENS and the ganglionated segment of those with Hirschsprung disease (enteric neurocristopathy). Data are shown as mean ± 95% CI, n = 3–10 ganglia per sample (Data S1). (C) Immunohistochemical labeling of TUBB3 in whole-mount preparations of the muscularis propria and high-magnification image of the MyGa (boxed area). Scale bar: 1 μm. (D) Labeling of TUBB3 after enzymatic digestion of the muscularis propria. Scale bars: 500 μm. The boxed area shows higher magnification of a MyGa. Scale bars: 100 μm. (E) Quantitative PCR of PLP1, NGFR, PHOX2B, and ELAVL4 in digested single-cell suspensions (IM-SCs) and the MyGa-enriched fractions of resected specimens. Data are shown as mean ± SEM. two-way ANOVA with Holm-Sidak post hoc test, *p < 0.05, **p < 0.01, ****p < 0.0001, n = 4 individuals per group. (F) Representative images of neurosphere formation from manually selected fragment of MyGa. Scale bars: 500 μm.
Figure 6.
Figure 6.. Neurospheres generated from human MyGa are highly neurogenic and contain ENSC subpopulations with distinct transcriptional profiles
(A and Aʹ) Free-floating neurospheres generated from the MyGa-enriched fraction (counter filtered) of human specimens. Scale bars: 500 μm (A) and 100 μm (Aʹ). (B) Population doubling levels of cultures generated from IM-SCs and counter-filtered fragments enriched for MyGa at the first passage (P1) and second passage (P2). n = 5–10 individuals per group. (C) Total cell counts before cells were passaged (P0) and estimated total yield of cells from proliferation assays at the first and second passages normalized per gram of starting tissue. n = 4–12 individuals per group. (D) Quantitative PCR of PHOX2B, TUBB3, PLP1, and NGFR prior to passaging and at P1 and P2 in neurospheres generated from IM-SCs and the MyGa-enriched fractions of resected specimens. two-way ANOVA with Holm-Sidak post hoc test, *p < 0.05, **p < 0.01, ***p < 0.001, n = 3–9 individuals per group. (E) Quantitative PCR in neurospheres at P1 generated from IM-SCs, the MyGa-enriched fractions (MyGa), and pure hand-picked MyGa (picked MyGa). One-way ANOVA with Holm-Sidak post hoc test, *p < 0.05, **p < 0.01, ***p < 0.001, ****p < 0.0001, n = 3–9 individuals per group. (F and G) Uniform manifold approximation and projection (UMAP) representation of cells from cultures of IM-SCs, the MyGa-enriched fractions, and pure hand-picked MyGa (F) and unsupervised clustering (G) of cell populations. (H) Proportion of cell populations in cells generated from IM-SCs, the MyGa-enriched fractions, and pure hand-picked MyGa, defined by unsupervised clustering. (I) UMAP visualization of bona fide markers for EGC/ENSCs (SOX10 and PLP1), enteric neurons (ELAVL4), and enteric mesenchymal cells (PDGFRA). (J) Heatmap visualization of the top 10 markers by LogFC (>60% of cells) for each cell population. Data are presented as Z scores. (K and L) UMAP representation of EGC/ENSC subpopulations from cultures of IM-SCs, the MyGa-enriched fractions, and pure hand-picked MyGa (K) and unsupervised clustering (L) of populations. (M) UMAP visualization of gene expression markers for human EGC/ENSCs and their subpopulations. (N) Ridge plot of the expression of neuronal markers and pro-neurogenic factors in EGC/ENSCs and enteric neurons. (O–Q) Representative images of immunocytochemical labeling of ITGA6, NGFR (O and P), and TUBB3 (Q) in monolayer cultures. Scale bars, 200 μm. (R) Quantification of the proportion of cells expressing ITGA6, NGFR, and TUBB3. n = 5 subjects per group, ratio paired t test, *p < 0.05, ***p < 0.001, n = 5 individuals per group. (S) Clustering of cells from cultures of mouse neurospheres. (T) Expression module scores for human enteric neuron and EGC/ENSC 1 and 2 population markers in mouse neurosphere cell populations.
Figure 7.
Figure 7.. Human MyGa-derived cells demonstrate functional competency and have utility for cell therapy applications
(A) Maximum-intensity projections of calcium responses over time using the Fluo-4 calcium indicator in human MyGa-derived cultures stimulated with ACh or with ACh stimulation following pretreatment with tetrodotoxin (TTX). Scale bars: 500 μm. See also Video S4. (B) Still images of calcium transients using the Fluo-4 calcium indicator following the application of ACh (T0) after 10 and 20 s. Scale bars: 500 μm. (Bʹ) Representative trace of a calcium response (ΔF/F0) to ACh in an individual cell. (C) Heatmap of ΔF/F0, with the y axis representing individual cells and the x axis representing time. (D) Expression of the GFP reporter after transduction of MyGa-derived cells with AAV6-ChR2-GFP in monolayer cultures on fibronectin. Scale bar: 500 μm. Inset scale bar: 100 μm. (E) Expression of GFP in AAV6-ChR2-GFP-transduced cells after reformation of neurospheres under free floating conditions. Scale bar: 500 μm. (F) Representative image of transplanted MyGa-derived cells to the muscularis propria of NOD-SCID IL-2Rgammanull (NSG) mice after 3 weeks of engraftment. Samples were labeled for the neuronal marker Tuj1 and stained with DAPI. Scale bar: 200 μm. (G) High-magnification images of transplanted cells defined by GFP expression and overlapping expression of Tuj1. Scale bar: 100 μm. (H) Force of contraction produced by colonic smooth muscle in response to BLS of transplanted cells expressing AAV6-ChR2-GFP in ex vivo organ bath experiments. (I) Quantification of contractile force in colonic smooth muscle in response to BLS compared to baseline measurements in the same sample. Paired t test, *p < 0.05, n = 3 mice per group. (J) Representative traces of smooth muscle contractions in the presence of TTX.

Similar articles

Cited by

References

    1. Furness JB (2012). The enteric nervous system and neurogastroenterology. Nat. Rev. Gastroenterol. Hepatol 9, 286–294. - PubMed
    1. Furness JB (2006). The Enteric Nervous System (Blackwell Publishing; ).
    1. Goldstein AM, Thapar N, Karunaratne TB, and De Giorgio R (2016). Clinical aspects of neurointestinal disease: pathophysiology, diagnosis, and treatment. Dev. Biol 417, 217–228. - PubMed
    1. Nagy N, and Goldstein AM (2017). Enteric nervous system development: a crest cell’s journey from neural tube to colon. Semin. Cell Dev. Biol 66, 94–106. - PMC - PubMed
    1. Goldstein AM, Hofstra RMW, and Burns AJ (2013). Building a brain in the gut: development of the enteric nervous system. Clin. Genet 83, 307–316. - PMC - PubMed

Publication types