. 2024 Dec;103(12):104438.
doi: 10.1016/j.psj.2024.104438. Epub 2024 Oct 18.

Transcriptome analyses of shell color and egg production traits between the uteruses of blue-green eggshell chickens and Hy-Line brown layers

Affiliations

Transcriptome analyses of shell color and egg production traits between the uteruses of blue-green eggshell chickens and Hy-Line brown layers

Huanhuan Wang et al. Poult Sci. 2024 Dec.

Abstract

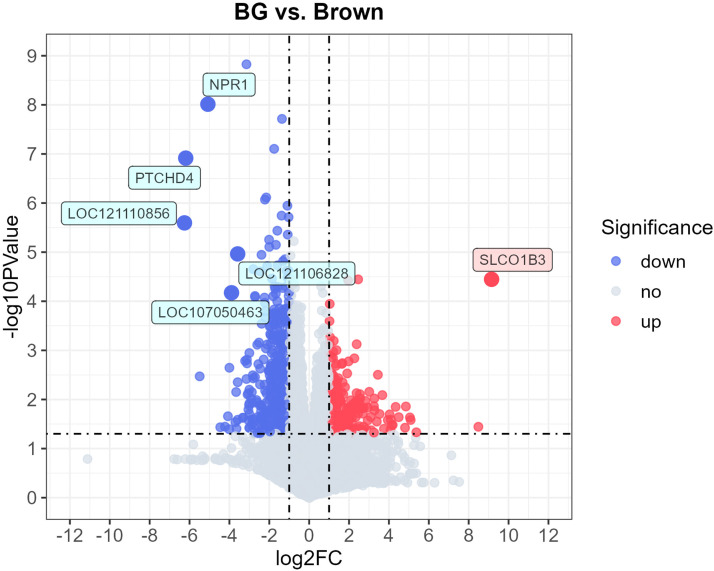
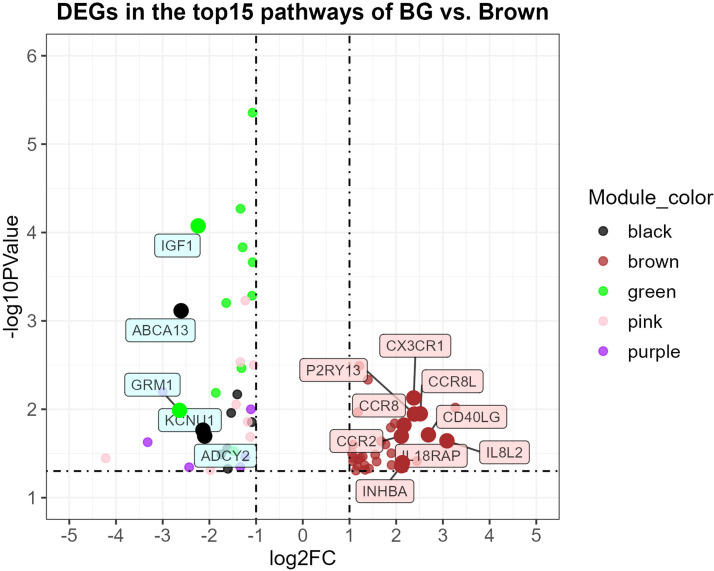
Blue-green eggs exhibit unique shell color; however, compared to commercial layers, blue-green eggshell chickens have lower egg production and lack uniform shell colors. Aiming to confirm the molecular mechanisms that affect shell color and egg production, this study collected the uteruses of 12 blue-green eggshell chickens (BG group) and six Hy-Line layers (Brown group), which had significantly different shell color indexes (SCI) and egg numbers at 300 days of age (EN300). Transcriptome sequencing and comparative analyses were subsequently performed. BG hens were divided into two groups for comparative analysis (BGblue vs. BGgreen and BGlow vs. BGhigh, respectively), based on the differences in SCI and EN300, respectively. The result of weighted gene co-expression network (WGCNA) analysis showed that the sequenced and mapped 16,785 genes were clustered into 18 modules, among which six modules with a total of 4270 genes were highly correlated with SCI and EN300 traits. Five hundred and eleven differentially expressed genes (DEGs) belonged to the six key modules. Through KEGG mapping, GO enrichment, and Cytoscape network analysis, nine Hub genes were tightly associated with SCI and EN300. The up-regulated genes were CCR2, CCR8, CD40LG, IL18RAP, INHBA, and P2RY13, while the down-regulated genes were ABCA13, ADCY2, and GRM1. Co-analyses with the results of comparisons between the BG subgroups revealed that the expression of solute carrier (SLC) proteins and ABC transporters were highly related to eggshell color, while cytokine-cytokine receptor interactions and neuroactive ligand-receptor interactions were key pathways affecting egg production. The expression of extracellular cytokines and membrane receptors were significantly up-regulated in low-yield chickens. The candidate DEGs and pathways found in the study will assist in clarifying the molecular mechanisms affecting shell color and egg production, and improve the breeding of blue-green eggshell chickens.

Keywords: Blue-green eggshell chicken; Egg production; Shell color; Transcriptome; Uterus.


Conflict of interest statement

Declaration of competing interest The authors declare that they have no known competing financial interests or personal relationships that could have appeared to influence the work reported in the present study.

Figures

Fig 1
Fig. 1
Bar plot of the SCI and EN300 values of the groups. (A) The mean and standard deviation of SCI and EN300 traits in the BG group and Brown group. (B) The mean and standard deviation of SCI and EN300 traits in subgroups of the BGblue and BGgreen, and in subgroups of the BGlow and BGhigh. BG: the BG group; Brown: the Brown group; BGblue: the blue egghell subgroup of the BG group; BGgreen: the green eggshell subgroup of the BG group; BGlow: the low egg production subgroup of the BG group; BGhigh: the high egg production subgroup of the BG group; SCI: shell color index; EN300: egg number until the age of 300 days. ⁎⁎ Double-asterisks between groups represent highly-significant differences (p < 0.01). ⁎⁎⁎ Triple-asterisks between groups represent extremely highly-significant differences (p < 0.001).
Fig 2
Fig. 2
Cluster dendrogram of genes and modules by WGCNA analysis, according to the 16,785 mapped genes and the traits (SCI and EN300) of total 18 experimental chickens. Eighteen modules obtained are represented by different colors in the horizontal bar.
Fig 3
Fig. 3
Heat map of the correlations between modules and traits (SCI and EN300). Each column represents a trait, and each row exhibits the eigengene of a certain module with the representative color. The corresponding correlation, followed with the p-value in parentheses, are included in each cell. The shade of red or blue in each cell represents the magnitude of the positive or negative correlation, respectively. SCI: shell color index; EN300: egg number until the age of 300 days.
Fig 4
Fig. 4
Volcano plot of DEGs in BG vs. Brown chickens. The two vertical dash lines represent two-fold changes, and the horizontal dash line indicates a p-value less than 0.05. Blue, red, and grey dots represent significantly down-regulated, up-regulated, or non-significantly expressed genes, respectively. BG: the BG group; Brown: the Brown group; LOC107050463: serine-aspartate repeat-containing protein F-like; LOC121106828: uncharacterized; LOC121110856: uncharacterized; NPR1: natriuretic peptide receptor A; PTCHD4: patched domain containing 4; SLCO1B3: solute carrier organic anion transporter family member 1B3.
Fig 5
Fig. 5
The top 15 pathways enriched in KEGG analysis of BG vs. Brown chickens. The X-axis represents the rich factor calculated from the input gene number divided by the background gene number. The Y-axis indicates the KEGG pathways ordered by their corrected p-values (qvalue). The dot colors transmitted from red to green indicate the change in qvalue from low to high, while the dot size indicates the number of input genes.
Fig 6
Fig. 6
GO enrichment terms of BG vs. Brown chickens, selected according to their corrected p-values (qvalue < 0.05). The X-axis represents the number of input genes. The Y-axis indicates the selected pathways belonging to biological process, cellular component, and molecular function, represented by different colors.
Fig 7
Fig. 7
Volcano plot of differentially expressed genes (DEGs) that were in the top 15 KEGG pathways of BG vs. Brown chickens. The two vertical dashed lines represent two-fold changes, while the horizontal dashed line indicates an adjusted p-value less than 0.05. Black, brown, green, pink, and purple dots represent the DEGs belonging to the module with the corresponding color. BG: the BG group; Brown: the Brown group; ABCA13: ATP binding cassette subfamily A member 13; ADCY2: adenylate cyclase 2; CCR2: C-C motif chemokine receptor 2; CCR8: C-C motif chemokine receptor 8; CCR8L: C-C chemokine receptor 8 like; CD40LG: CD40 ligand; CX3CR1: C-X3-C motif chemokine receptor 1; GRM1: glutamate metabotropic receptor 1; IGF1: insulin like growth factor 1; IL18RAP: interleukin 18 receptor accessory protein; IL8L2: interleukin 8-like 2; INHBA: inhibin beta A subunit; KCNU1: potassium calcium-activated channel subfamily U member 1; P2RY13: purinergic receptor P2Y13.
Fig 8
Fig. 8
Cytoscape network of differentially expressed genes (DEGs) that belong to the seven key pathways of BG vs. Brown chickens. Each circle represents a gene, the circle colors (i.e., black, brown, and green) indicate the corresponding colors of the modules, the circle size indicates the | log2FC| value, and the blue and red gene names indicate down- and up-regulated genes, respectively. The thickness of the line connecting two circles represents the association weight between the two genes. BG: the BG group; Brown: the Brown group.
Fig 9
Fig. 9
The KEGG pathways chosen based on comparisons of BGblue vs. BGgreen and BGlow vs. BGhigh. The X-axis represents the rich factor calculated from the input gene number divided by the background gene number. The Y-axis represents the selected pathways ordered by the corrected p-value (qvalue). The dot colors from red to green indicate the changes in qvalues from low to high. The dot size indicates the number of input genes. BGblue: the blue eggshell subgroup of the BG group; BGgreen: the green eggshell subgroup of the BG group; BGlow: the low egg production subgroup of the BG group; BGhigh: the high egg production subgroup of the BG group.
Fig 10
Fig. 10
Bar plot of the mRNA expressions of the 11 validated DEGs between the BG and Brown groups, and their count values in RNA-Seq. The gene name is shown in the title of each plot. The left Y-axis indicates the expression level, while the right Y-axis represents the gene counts. The two left histograms of each plot show the means and standard deviations of gene expression in BG and Brown groups, respectively. The two right histograms show the means and standards deviations of the gene counts in the BG and Brown groups, respectively. BG: the BG group; Brown: the Brown group; ABCA13: ATP binding cassette subfamily A member 13; ADCY2: adenylate cyclase 2; CCR2: C-C motif chemokine receptor 2; CCR8: C-C motif chemokine receptor 8; CD40LG: CD40 ligand; GRM1: glutamate metabotropic receptor 1; IL18RAP: interleukin 18 receptor accessory protein; INHBA: inhibin beta A subunit; NPR1: natriuretic peptide receptor A; P2RY13: purinergic receptor P2Y13; SLCO1B3: solute carrier organic anion transporter family member 1B3. ns “ns” between groups represent not significant differences (p > 0.05). * Single-asterisks between groups represent significant differences (p < 0.05). ⁎⁎ Double-asterisks between groups represent highly-significant differences (p < 0.01). ⁎⁎⁎ Triple-asterisks between groups represent extremely highly-significant differences (p < 0.001).

References

    1. Bello S.F., Xu H.P., Guo L.J., Li K., Zhen M., Xu Y.B., Zhang S.Y., Bekele E.J., Bahareldin A.A., Zhu W.J., Zhang D.X., Zhang X.Q., Ji C.L., Nie Q.H. Hypothalamic and ovarian transcriptome profiling reveals potential candidate genes in low and high egg production of white Muscovy ducks (Cairina moschata) Poult. Sci. 2021;100 - PMC - PubMed
    1. Bhavana K., Foote D.J., Srikanth K., Balakrishnan C.N., Prabhu V.R., Sankaralingam S., Singha H.S., Gopalakrishnan A., Nagarajan M. Comparative transcriptome analysis of Indian domestic duck reveals candidate genes associated with egg production. Sci. Rep. 2022;12:10943. - PMC - PubMed
    1. Bordini M., Zappaterra M., Soglia F., Petracci M., Davoli R. Weighted gene co-expression network analysis identifies molecular pathways and hub genes involved in broiler White Striping and Wooden Breast myopathies. Sci. Rep. 2021;11(1):1776. - PMC - PubMed
    1. Brady K., Porter T.E., Liu H.C., Long J.A. Characterization of the hypothalamo-pituitary-gonadal axis in low and high egg producing turkey hens. Poult. Sci. 2020;99(2):1163–1173. - PMC - PubMed
    1. Cavero D., Schmutz M., Icken W., Preisinger R. Attractive eggshell color as a breeding goal. Lohmann Inf. 2012;47(2):15–21.