. 2024 Oct;14(10):240178.
doi: 10.1098/rsob.240178. Epub 2024 Oct 30.

Internal regulation between constitutively expressed T cell co-inhibitory receptors BTLA and CD5 and tolerance in recent thymic emigrants

Affiliations

Internal regulation between constitutively expressed T cell co-inhibitory receptors BTLA and CD5 and tolerance in recent thymic emigrants

Adeolu O Adegoke et al. Open Biol. 2024 Oct.

Abstract

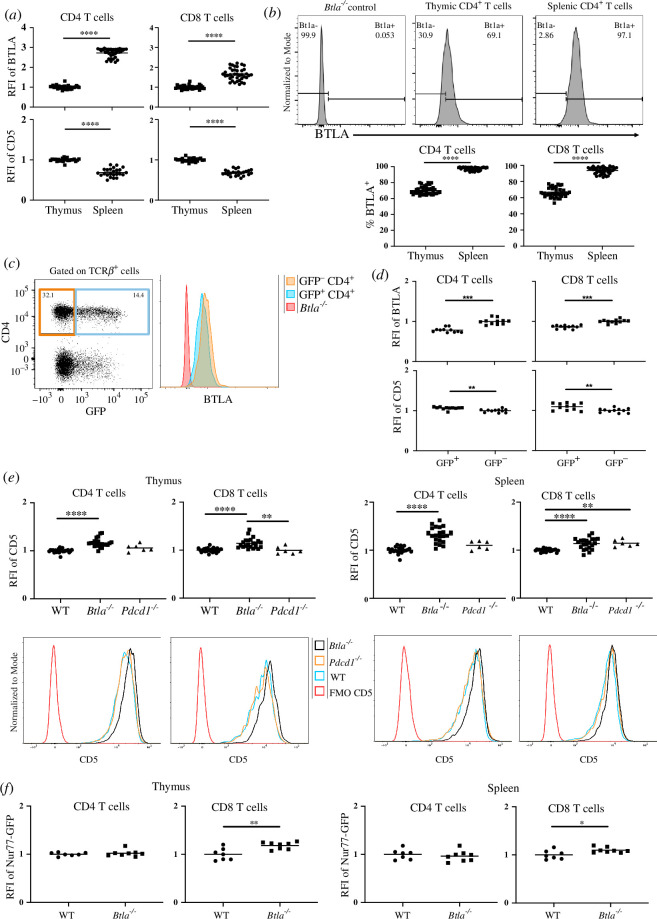
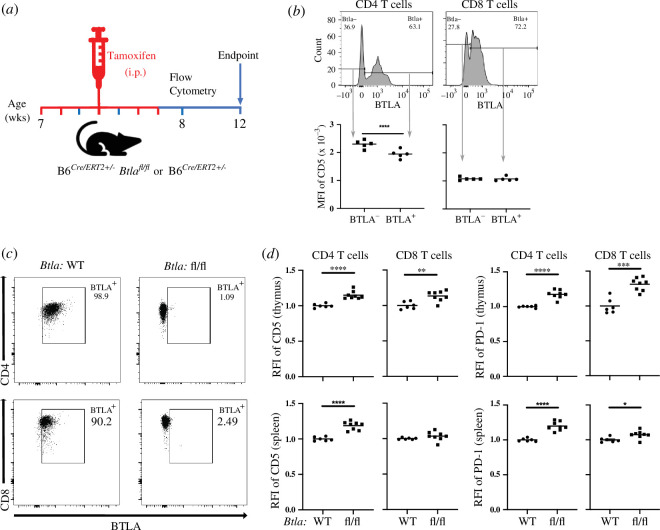
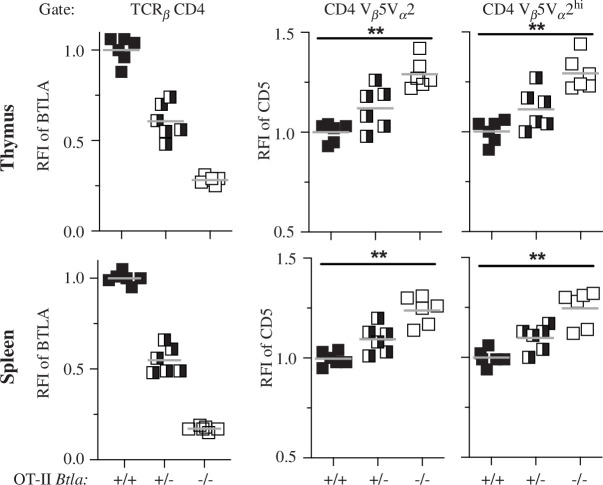
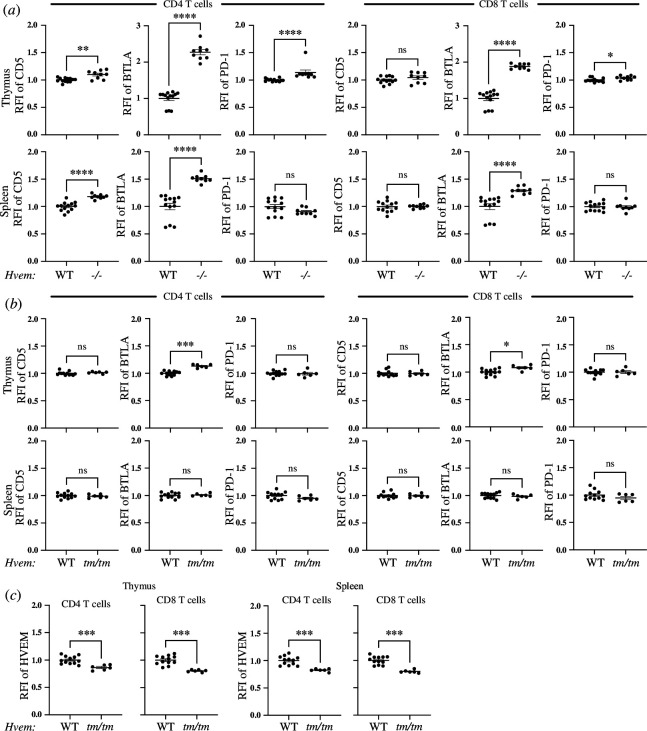
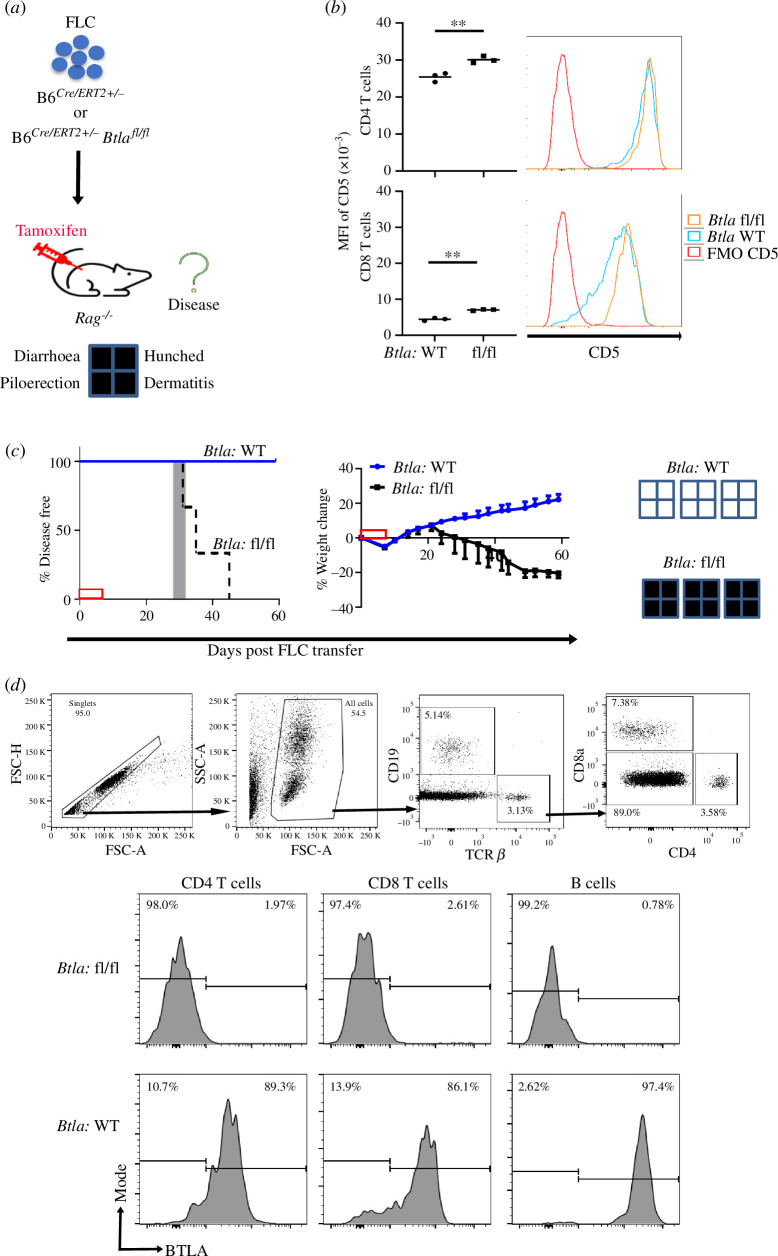
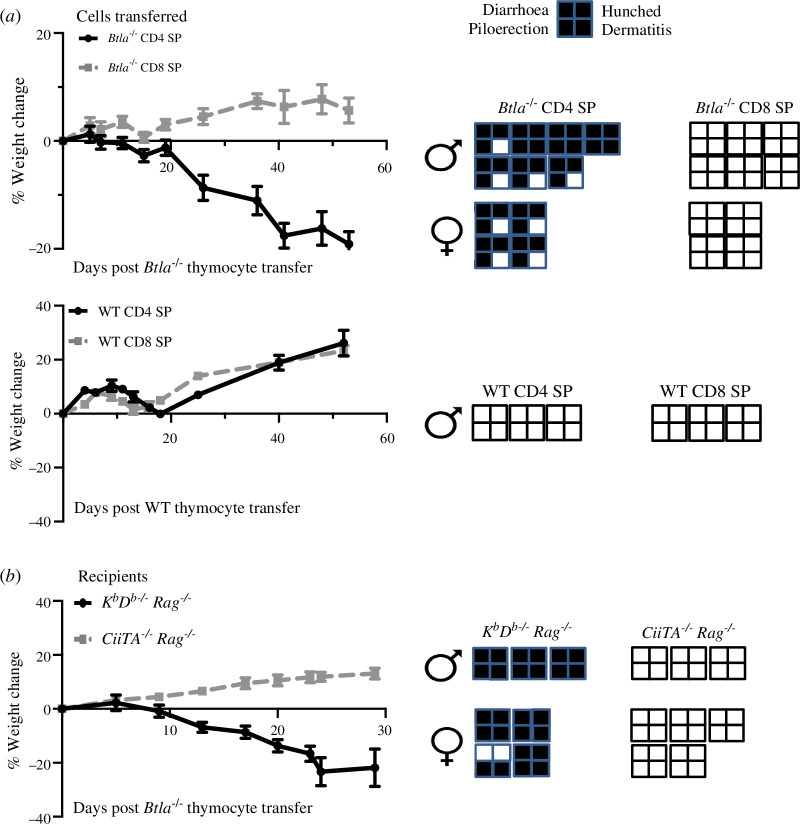
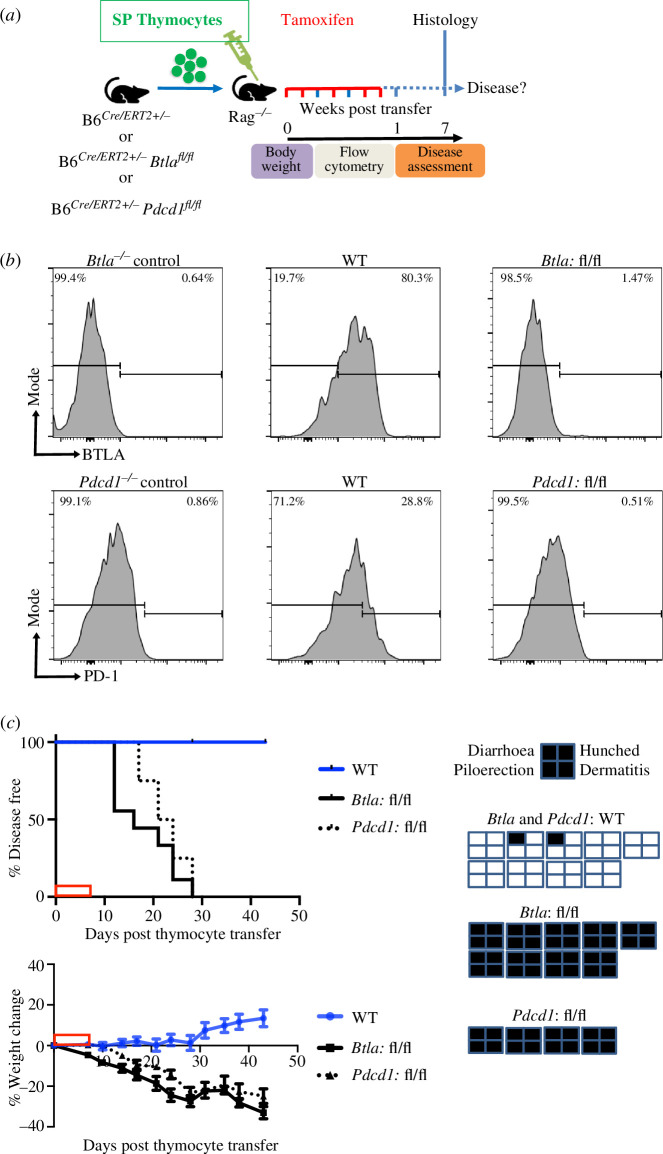
Immunologic self-tolerance involves signals from co-inhibitory receptors. Several T cell co-inhibitors, including PD-1, are expressed upon activation, whereas CD5 and BTLA are expressed constitutively. The relationship between constitutively expressed co-inhibitors and when they are needed is unknown. Deletion of Btla demonstrated BTLA regulates CD5 expression. Loss of BTLA signals, but not signalling by its ligand, HVEM, leads to increased CD5 expression. Higher CD5 expression set during thymic selection is associated with increased self-recognition, suggesting that BTLA might be needed early to establish self-tolerance. We found that BTLA and PD-1 were needed post-thymic selection in recent thymic emigrants (RTE). RTE lacking BTLA caused a CD4 T cell and MHC class II dependent multi-organ autoimmune disease. Together, our findings identify a negative regulatory pathway between two constitutively expressed co-inhibitors, calibrating their expression. Expression of constitutive and induced co-inhibitory receptors is needed early to establish tolerance in the periphery for RTE.

Keywords: BTLA; CD5; T cells; autoimmunity; recent thymic emigrants; tolerance.


Conflict of interest statement

L.B. is CSO and board member at JJP Biologics, a company developing HVEM targeting approaches in oncology.

Figures

BTLA expression in the thymus and spleen is inversely related to CD5 expression.
Figure 1.
BTLA expression in the thymus and spleen is inversely related to CD5 expression. (a) Relative fluorescent intensities (RFIs) of BTLA (upper row) or CD5 (lower row) in CD4 SP T cells (left column) and CD8 SP T cells (right column) in the thymus and spleen (BTLA, n = 39; CD5, n = 24). To calculate the RFI of BTLA or CD5, mean fluorescence intensity (MFI) data were normalized to the average MFI of BTLA or CD5 of the thymic SP T cells in each individual experiment. (b) Representative histograms showing the proportion of BTLA+ CD4 SP T cells (upper row) in the thymus and spleen. Lower row shows the proportion of BTLA+ CD4 SP T cells (lower left) and BTLA+ CD8 SP T cells (lower right) in the thymus and spleen (n = 39). (c) Representative flow cytometry dot plot (left) and histogram (right) of the indicated markers in splenic TCRβ+ cells from 7 to 10 week old B6.Rag2pGFP mice. (d) RFIs of BTLA (top panels) and CD5 (lower panels) on mature (GFP) or newly generated (GFP+) SP T cells in the spleen (n = 11). Data are normalized to the average BTLA MFI or CD5 MFI of the GFP negative splenic SP T cells in each individual experiment. (e) CD5 expression on CD4 SP T cells and CD8 SP T cells from thymus (left) or spleen (right) and their corresponding representative histograms (lower rows) from WT (n = 24; B6.Foxp3GFP and B6.Nur77GFP), Btla−/− (n = 22; B6.Foxp3GFP Btla−/− and B6.Nur77GFP Btla−/−) and Pdcd1−/− (n = 6; B6.Foxp3EGFP Pdcd1−/−) mice. (f) Nur77-GFP expression. Dots indicate individual mice from six to nine independent experiments (a,b,e) or two independent experiments (c,d,f). *p < 0.05, **p < 0.01, ***p < 0.001, ****p < 0.0001.
Loss of BTLA in adult mice leads to increased T cell CD5 and PD−1 expression.
Figure 2.
Loss of BTLA in adult mice leads to increased T cell CD5 and PD1 expression. (a) Adult B6Cre/ERT2+/− or B6Cre/ERT2+/− Btlafl/fl mice received five doses of tamoxifen on days 0, 1, 3, 5 and 6 (highlighted in red). (b) Representative histograms (top) of BTLA expression and the MFI of CD5 (bottom) of BTLA+ and BTLA cells in the CD4 gated (left) and CD8 gated (right) T cells in the peripheral blood at one week post-tamoxifen. (c) Representative dot plots of BTLA expression in the splenic CD4 SP T cells (top) and CD8 T cells (bottom) in the B6Cre/ERT2+/− mice (left) and B6Cre/ERT2+/− Btlafl/fl mice (right) at two weeks post-tamoxifen. (d) RFI of CD5 and PD-1 in the thymic (top row) CD4 and CD8 or splenic (bottom row) CD4 and CD8 T cells of B6Cre/ERT2+/− (WT) and B6Cre/ERT2+/− Btlafl/fl (fl/fl) mice at four weeks post-tamoxifen. Dots indicate individual mice from two independent experiments. *p < 0.05, **p < 0.01, ****p < 0.0001.
BTLA deficiency increases CD5 levels in TCR transgenic OT-II CD4 T cells in thymus and spleen.
Figure 3.
BTLA deficiency increases CD5 levels in TCR transgenic OT-II CD4 T cells in thymus and spleen. RFI of BTLA gated on TCRβ+ CD4+ SP cells (left) and RFI of CD5 in all CD4+ TCR-Vβ5Vα2+ cells (middle) and RFI of CD5 in CD4+ SP cells expressing high levels TCR-Vβ5Vα2 (right; gate included only the top approximately 50% of TCR-Vβ5Vα2 expressing cells). Analysis of T cells from the thymus (top) and spleen (bottom) of OT-II.Btla+/+ (WT OT-II; n = 6), OT-II.Btla+/ (n = 6) and OT-II.Btla−/− mice (n = 6). The grey line is the mean of the RFI. CD5 expression on OT-II.Btla+/+ T cells was significantly lower than on BTLA-deficient (Btla−/−) OT-II T cells, **p < 0.01.
HVEM dependent control of CD5 and PD-1 expression from early in CD4 T cell ontogeny does not require HVEM signalling.
Figure 4.
HVEM dependent control of CD5 and PD-1 expression from early in CD4 T cell ontogeny does not require HVEM signalling. Thymocytes and splenocytes from WT and Hvem−/− (a) or Hvemtm/tm mice (b,c), gated on SP CD4 and SP CD8 T cells, were examined by flow cytometry for expression of CD5, BTLA, PD-1 and HVEM. *p <0.05, **p < 0.01, ***p < 0.001, ****p < 0.0001.
Loss of BTLA early in T cell ontogeny generates autoimmune disease.
Figure 5.
Loss of BTLA early in T cell ontogeny generates autoimmune disease. (a) We adoptively transferred 20 × 106 FLC pooled from 8 to 10 embryonic day 14–16 B6Cre/ERT2+/− (WT) or B6Cre/ERT2+/− Btlafl/fl (fl/fl) foetuses to 7 week old Rag–/– mice on day 0 (n = 3 recipients per group), followed by tamoxifen injection on days 0, 1, 3, 5 and 6. Recipient mice were monitored for signs of disease for eight weeks post-FLC transfer. (b) MFI of CD5 in CD4 T cells (top) and CD8 T cells (bottom) with respective representative histograms of peripheral T cells in the recipients of FLC from B6Cre/ERT2+/− and B6Cre/ERT2+/− Btlafl/fl at eight weeks post-tamoxifen. Dots indicate data from individual mice; **p < 0.01. (c) Left panel: disease incidence in recipients of B6Cre/ERT2+/− (blue line) B6Cre/ERT2+/− Btlafl/fl (black dashed line) FLC. Survival curves were significantly different, p = 0.02. The grey rectangle indicates the range, in days, at which the first T cells were detected in the peripheral blood after FLC transfer. Right panel: weight changes in recipients of B6Cre/ERT2+/− Btlafl/fl FLC or B6Cre/ERT2+/− FLC. The red box on the X-axes indicates the tamoxifen treatment period. The presence (filled) or absence (empty) of disease signs is depicted on the far-right panel. (d) Flow cytometry gating (top). A representative histogram of BTLA expression in the T and B cells populating the periphery of B6Cre/ERT2+/− Btlafl/fl FLC recipient mice (middle) or B6Cre/ERT2+/− Btlafl/fl FLC recipient mice (bottom) at four weeks post-FLC transfer is shown.
Autoimmune disease in Btla–/– thymocyte recipients requires CD4+ T cells and MHC II.
Figure 6.
Autoimmune disease in Btla–/– thymocyte recipients requires CD4+ T cells and MHC II. (a) We adoptively transferred 3 × 10⁶ MACS-sorted CD4 or CD8 SP thymocytes pooled from seven 8–10 week old B6.Foxp3EGFP × Btla−/− (left column) or B6.Foxp3EGFP (right column) mice i.v. to 8–10 week old Rag−/− mice (Btla–/– thymocyte recipients, n = 10–11 mice/group; WT thymocyte recipients, n = 3 mice/group) and monitored for several weeks or after losing ≥ 20% of baseline body weight, whichever came first. Body weight change of the Btla–/– SP thymocyte recipients (data were from three independent experiments) or WT SP thymocyte recipients is shown, and the presence (shaded) or absence (unshaded) of disease signs is depicted to the right of the graphs. (b) Thymocytes containing 3 × 10⁶ SP cells (i.e. non-sorted) pooled from seven 8–10 week old B6.Foxp3EGFP × Btla−/− mice were injected via tail vein to 8–10 week old KbDb–/– Rag–/– mice (n = 7) or CiiTA–/– Rag–/– (n = 8) mice, which were then monitored for several weeks or until after losing ≥ 20% of baseline body weight, whichever came first. Body weight change of recipient mice is shown. Data are from two independent experiments. The presence (shaded) or absence (unshaded) of disease signs is depicted to the right of the graph. Cell donors and recipients were of the sex indicated.
BTLA and PD-1 are needed post-thymic selection in newly generated T cells to block autoimmune disease.
Figure 7.
BTLA and PD1 are needed post-thymic selection in newly generated T cells to block autoimmune disease. (a) We adoptively transferred thymocytes containing 5 × 10⁶ SP (non-pooled) from 7 to 12 week-old B6Cre/ERT2+/− (WT) or B6Cre/ERT2+/− Btlafl/fl (fl/fl) mice or B6Cre/ERT2+/− Pdcd1fl/fl (fl/fl) mice to 7–12 week-old Rag–/– mice on day 0, followed by tamoxifen injection on days 0, 1, 3, 5 and 6. Mice were then monitored for signs of disease for seven weeks. (b) Flow cytometry gated on TCRβ+ cells. Representative histograms of BTLA (top row) or PD-1 (lower row) expression in the T cells of germline gene knockout control mice and B6Cre/ERT2+/− or B6Cre/ERT2+/− Btlafl/fl or B6Cre/ERT2+/− Pdcd1fl/fl thymocyte recipients at two weeks post-thymocyte transfer (i.e. seven days post-tamoxifen) is shown. (c) Top left panel: disease incidence in recipients of B6Cre/ERT2+/− (n = 9) or B6Cre/ERT2+/− Btlafl/fl (n = 9) or B6Cre/ERT2+/− Pdcd1fl/fl (n = 4) thymocytes. Disease-free survival curve comparison demonstrated a significant difference between both fl/fl groups and the WT, with p < 0.0001. Data are combined from three independent experiments (two for Btla: fl/fl and one for Pdcd1: fl/fl; WT were included in all three experiments). Bottom left panel: weight changes in the indicated of B6Cre/ERT2+/− Btlafl/fl or B6Cre/ERT2+/− Pdcd1fl/fl or B6Cre/ERT2+/− thymocyte recipients. The presence (shaded) or absence (unshaded) of disease signs is depicted on the far-right panels. The red box on the X-axis indicates the tamoxifen treatment period.

Similar articles

References

    1. Chien YH, Gascoigne NR, Kavaler J, Lee NE, Davis MM. 1984. Somatic recombination in a murine T-cell receptor gene. Nature 309, 322–326. (10.1038/309322a0) - DOI - PubMed
    1. Forsdyke DR. 2022. Positive selection of immune repertoires: a short further history. Scand. J. Immunol. 95, e13144. (10.1111/sji.13144) - DOI - PubMed
    1. Sinclair NR, Anderson CC. 1996. Co-stimulation and co-inhibition: equal partners in regulation. Scand. J. Immunol. 43, 597–603. (10.1046/j.1365-3083.1996.d01-267.x) - DOI - PubMed
    1. Ellestad KK, Lin J, Boon L, Anderson CC. 2017. PD-1 controls tonic signaling and lymphopenia-induced proliferation of T lymphocytes. Front. Immunol. 8, 1289. (10.3389/fimmu.2017.01289) - DOI - PMC - PubMed
    1. Ishida Y, Agata Y, Shibahara K, Honjo T. 1992. Induced expression of PD-1, a novel member of the immunoglobulin gene superfamily, upon programmed cell death. EMBO J. 11, 3887–3895. (10.1002/j.1460-2075.1992.tb05481.x) - DOI - PMC - PubMed