. 2024 Oct 30;15(1):9361.
doi: 10.1038/s41467-024-53717-0.

Heterogeneous enhancer states orchestrate β cell responses to metabolic stress

Affiliations

Heterogeneous enhancer states orchestrate β cell responses to metabolic stress

Liu Wang et al. Nat Commun. .

Abstract

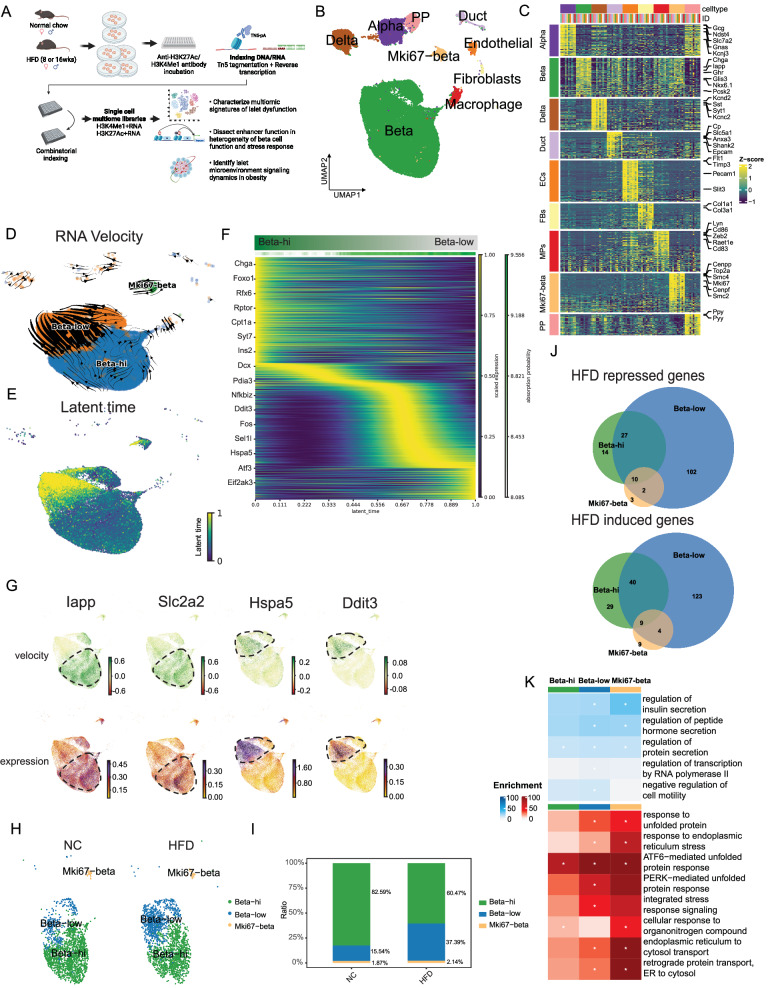
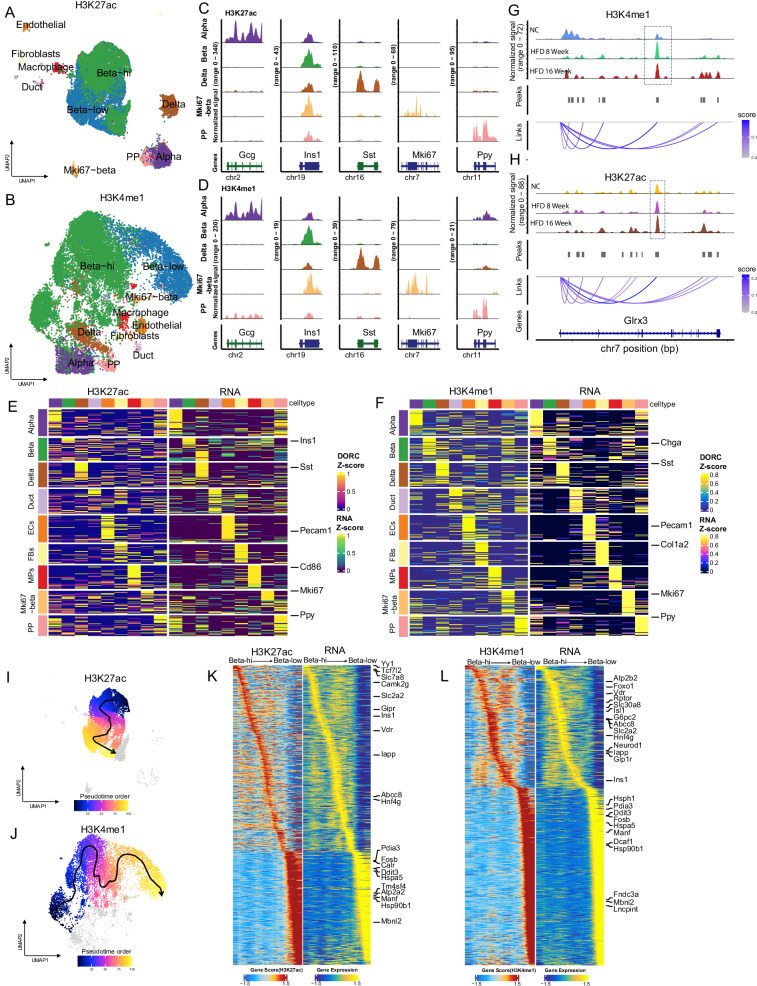
Obesity-induced β cell dysfunction contributes to the onset of type 2 diabetes. Nevertheless, elucidating epigenetic mechanisms underlying islet dysfunction at single cell level remains challenging. Here we profile single-nuclei RNA along with enhancer marks H3K4me1 or H3K27ac in islets from lean or obese mice. Our study identifies distinct gene signatures and enhancer states correlating with β cell dysfunction trajectory. Intriguingly, while many metabolic stress-induced genes exhibit concordant changes in both H3K4me1 and H3K27ac at their enhancers, expression changes of specific subsets are solely attributable to either H3K4me1 or H3K27ac dynamics. Remarkably, a subset of H3K4me1+H3K27ac- primed enhancers prevalent in lean β cells and occupied by FoxA2 are largely absent after metabolic stress. Lastly, cell-cell communication analysis identified the nerve growth factor (NGF) as protective paracrine signaling for β cells through repressing ER stress. In summary, our findings define the heterogeneous enhancer responses to metabolic challenges in individual β cells.


Conflict of interest statement

The authors declare no competing interests.

Figures

Fig. 1
Fig. 1. Define heterogeneous β cell states in islets from normal chow and high-fat diet mice.
A Schematic experimental design. Created in BioRender. Wei, Z. (2022) BioRender.com/n56g182. B Uniform manifold approximation and projection (UMAP) embedding showing the clustering of 56,748 single nuclei by single nuclei RNA profile. C Row-normalized expression of top enriched genes for each islet cell type (MPs: macrophages, FBs: Fibroblasts, ECs: Endothelial cells). Color bars in ID represent individual biological samples. D RNA velocity flow projected in the UMAP space. E RNA velocity-based latent time of the nuclei shown in D. F Smoothed gene expression trends of the top 1,000 genes whose expression values correlate best with β cell state probabilities (from beta-hi to beta-low), sorted according to peak in pseudotime. G The RNA velocity (upper panel) and the expression (lower panel) for representative genes (Iapp, Slc2a2, Hspa5, Ddit3) in each cluster by scVelo. Positive velocity: up-regulated; negative velocity: down-regulated. H UMAP of 3 states of mouse β cells (high, low, and proliferating (Mki67+)) density from NC or HFD mice, showing the relative proportion of beta-low cells are increased in HFD islets. I The percentage of cells in each state (high, low, and Mki67+) in NC and HFD β cells. J Venn diagram of HFD-repressed (upper panel) and HFD-induced (lower panel) genes in high, low, and Mki67+ β cells. K Heatmap showing the odds ratio of the top GO terms calculated by enrichR for up and downregulated DEGs within each cell type (*adjusted p < 0.05). Top panel: GO terms for genes repressed by HFD. Lower: GO terms for genes upregulated by HFD. Adjusted p-values were calculated using Fisher-exact test and Benjamini-Hochberg method for correction.
Fig. 2
Fig. 2. Integrative analysis of chromatin states and gene expression in lean and obese mouse pancreatic islets revealed dynamic correlations between gene expression and H3K27ac/H3K4me1 levels.
UMAP embedding from single-nucleus joint profiles of transcriptome and histone modification (H3K27ac (A) or H3K4me1 (B)). Total number of nuclei: 37,847 in A and 18,919 in B. Genome tracks of aggregated normalized signals of H3K27ac (C) and H3K4me1 (D) of individual endocrine cell types (α, β, δ, Mki67-beta, and PP cells) at Gcg, Ins1, Sst, Mki67, and Ppy loci.Heatmaps of RNA expression (left) and the accumulated H3K27ac (E) or H3K4me1 (F) signals (right). The top 50 differentially enriched genes for each cell type were selected. Correlations between individual H3K4me1 (G) or H3K27ac (H) enhancer activity and the expression of Glrx3, a gene involved in glutathione metabolism and a marker for stressed β cells. Top 3 panels: genome tracks of pooled H3K4me1 (G) or H3K27ac (H) signals in α, β, and δ cells. Mid panel: H3K4me1 (G) or H3K27ac (H) peaks. Bottom panel: spider plot represents the strength of linkage between H3K4me1 (G) or H3K27ac (H) and Glrx3 expression. (I-J) UMAP shows the trajectory of β cell dysfunction from β-high to beta-low states in H3K27ac(I) and H3K4me1(J). Pseudo-time values were overlaid on the UMAP embedding; the smoothed line and arrow represent the visualization of the trajectory path from the spline fit. K Heatmaps showing the enrichment patterns of H3K27ac (left) and expression (right) of 1,657 genes of which the H3K27ac and RNA are correlated along the pseudo-time order. L Heatmaps showing the enrichment patterns of H3K4me1 (left) and expression (right) of 964 genes of which the H3K4me1 and RNA are correlated along the pseudo-time order.
Fig. 3
Fig. 3. Multiomic analysis of single-cell TF expression and motif activities reveal H3K27ac- and H3K4me1-specific gene regulatory networks.
A Feature plot visualization of Z-score normalized TF motif activities of H3K27ac (FOS, FoxA2, upper 2 panels), and H3K4me1 (IRF1, NFKB2, lower two panels) showing the single cell heterogeneity of TF activities in β cells. B Heatmaps showing 76 TFs with a highly correlating TF expression (left) and H3K27ac motif activities (right) over pseudo-time. C Heatmaps showing 113 TFs with a highly correlating TF expression (left) and H3K4me1 motif activities (right) over pseudo-time. Mean regulation score (signed, −log10 scale) shows TF activators(left) and TF repressors(right) based on DORCs of H3K27ac (D) or H3K4me1 (E). Heatmap of DORC regulation scores for all significant TF-targets pairs in H3K27ac (F) and H3K4me1 (HJ) qPCR of expression of selected IL1β-induced NF-κB targets in MIN6 cells treated with or without SAHA (5 uM) (H), GNE 781 (1 uM) (I), or GSK-LSD1 (5 uM) (J). Gene expression was normalized to the expression of Gapdh (For Tgfbr1 (H), Ntrk2 (J), n = 3 biological independent experiments; for rest genes, n = 4 biological independent experiments). Data are shown as the mean + S.E.M. Analysis was done using two-tailed Student’s t-test. *p < 0.05, **p < 0.01, and ***p < 0.001. Source data and exact p values are provided as a Source Data file.
Fig. 4
Fig. 4. Concordant and discordant patterns of H3K27ac-RNA and H3K4me1-RNA correlations suggest divergent regulatory mechanisms in metabolic stress-induced β cell stress and dysfunction.
A Scatter plot showing the correlation coefficients of H3K27ac-RNA (y-axis) or H3K4me1-RNA(x-axis) for all genes. Group 1 (green): Genes showing a concordant pattern of H3K27ac-RNA and H3K4me1-RNA correlations. Group 2 (yellow): Genes showing only significant correlations between H3K4me1 and RNA. Group 3 (red): Genes showing only significant correlations between H3K27ac and RNA. Group 4 (grey): Other genes that do not fit into the above correlation patterns. B Pseudo time heatmap of the H3K4me1 gene score (left) and gene expression (right) for all group 1 genes. C Pseudo time heatmap of the H3K27ac gene score (left) and gene expression (right) for all group 1 genes. D Gene ontology for group 1-3 genes showing enrichment in distinct enriched categories. Adjusted p-values were calculated using Benjamini-Hochberg correction. E H3K4me1 (left) and H3K27ac (right) gene scores of representative genes in group 2 (Sik3, Ate1, Sec24d) and group 3 (Dusp10, Kcnmb2) showing the discordant patterns of H3K4me1 and H3K27ac over the β cell dysfunction trajectory. Dots represent gene scores of an individual pseudotime-ordered histone modifications profile. The smoothed line and arrow represent the visualization of the trajectory path from the spline fit. F Heatmap showing the correlation between TF expression and motif activity (left: H3K4me1, right: H3K27ac). G Pie chart showing the H3K27ac-coupled genes (group 1 and 3 from A) that are significantly suppressed by CBP inhibitor GNE-781 or P300 inhibitor C646 (red), or induced by HDACs inhibitor SAHA (green), in primary mouse islets treated with SAHA (5 uM), GNE-781 (1 uM) or C646 (5 uM) for 24 h. H Gene ontology categories of 414 overlapped genes in G.
Fig. 5
Fig. 5. Loss of H3K4me1+/H3K27ac- primed enhancers is a key feature of metabolic stress-induced epigenomic changes in dysfunctional islets.
A The integrated H3K4me1-RNA UMAP of β cells at NC (0 weeks) and HFD (8 and 16 weeks) shows a distinct pattern of NC β cells. B The pseudo-bulked H3K4me1(red) and H3K27ac(blue) at Fam210b, Ptpn1, and Slco3a1 show the complete loss of H3K4me1+H3K27ac- primed enhancers (grey) in HFD islets. C Schematic demonstration of the conventional model of primed (H3K4me1+H3K27ac-) and active (H3K4me1+H3K27ac+) enhancers. D Pie chart of the percentage of primed enhancers in all H3K4me1 enhancers. E Heatmap of all K4 + K27- primed enhancers in NC and HFD (8 and 16 weeks), showing a majority of the primed enhancers in NC are lost in HFD. The proportion of primer peaks relative to the total number of H3K4me1 peaks. F Motif enrichment of the primed enhancer in E. P-value were calculated using HOMER’s default method. G Heatmaps of pseudo-bulked H3K4me1, H3K27ac, and mouse islets FoxA2 ChIP-seq (from GSM 1306337) show the extensive occupancy of FoxA2 at primed enhancers. H Pie chart of the percentage of primed enhancers (2,044 peaks, 14%) that correlate with gene expression (left) and the percentage (44%) of 2,044 peaks that are occupied by FoxA2. I Top enriched GO terms for genes associated with the 2,044 peaks in H. Linkage plot for Hnf1a (J) and Arap1 (K) loci. Top left: pseudo-bulked H3K4me1 in NC and HFD β cells, grey regions indicate primed enhancers associated with Hnf1a gene expression. Top right: violin plot of Hnf1a expression in NC and HFD β cells. Middle: FoxA2 ChIP-seq, FoxA2 motif, and H3K4me1 peaks. Bottom: spider plots showing significant enhancer(H3K4me1)-RNA links.
Fig. 6
Fig. 6. Cell-cell communication analysis reveals the role of NGF in ameliorating excessive ER stress in β cells.
A Heatmap showing NicheNet predicted ligand-target pairs between beta cells and other cell types. B UMAP shows restricted expression patterns of Ngf and Manf. C Published single-cell gene expression data of Manf in β cells (left), Ngf in ductal cells, and fibroblasts (right two) from normal and diabetic mouse islets. D Pancreatic NGF content in male mice (B6) fed with normal chow (NC) and HFD for 16 weeks (n = 4 (NC) or 5(HFD) biologically independent samples). Data shown as mean ± S.E.M. Analysis was done using two-tailed Student’s t-test. E RT-qPCR of Ddit3, Ppp1r15a, and Atf3 expression in HFD-fed mice islets treated with or without NGF. Data are shown as mean ± S.E.M. (n = 6 biologically independent experiments). Analysis was done using two-tailed Student’s t-test. *p < 0.05, **p < 0.01, and ***p < 0.001. F RT-qPCR of Atf3 expression in TG-stressed MIN6 cells treated with or without MANF (100 ng/ml). Data are shown as mean ± S.E.M. (n = 3 biologically independent experiments (MANF + TG), n = 4 biological independent experiments (Ctrl, MANF, TG)). Analysis was done using two-tailed Student’s t-test. *p < 0.05, **p < 0.01, and ***p < 0.001. G RT-qPCR of Atf3, Ddit3, Hspa5, Herpub1, and Ppp1r15a in TG-stressed MIN6 cells treated with or without NGF (100 ng/ml). Data shown as mean ± S.E.M. (n = 4 biological independent experiments). Analysis was done using two-tailed student’s t-test. *p < 0.05, **p < 0.01, and ***p < 0.001. H Western blotting (top) and relative band intensity (bottom) showing CHOP (Ddit3) protein levels in TG-stressed MIN6 cells treated with or without NGF. I Schematic of experimental design for NGF administration in Akita mice. Created in BioRender. Wu, J. (2023) BioRender.com/a64z386. J 16-hour fasting blood glucose level of Vehicle or NGF-treated Akita mice. (n = 5 (control) or 5 (NGF) animals per group). K Ad lib serum insulin level measured by ELISA. (n = 5 (control) or 6(NGF) animals per group). L Whole pancreas insulin content measured by ELISA. All data are shown as mean ± S.E.M. (n = 5 (control) or 4 (NGF) animals per group). Analysis was done using two-tailed Student’s t-test. *p < 0.05, **p < 0.01. Source data and exact p values are provided as a Source Data file.

References

    1. Ashcroft, F. M. & Rorsman, P. Diabetes mellitus and the beta cell: the last ten years. Cell148, 1160–1171 (2012). - PMC - PubMed
    1. Prentki, M., Peyot, M. L., Masiello, P. & Madiraju, S. R. M. Nutrient-induced metabolic stress, adaptation, detoxification, and toxicity in the pancreatic beta-cell. Diabetes69, 279–290 (2020). - PubMed
    1. Donath, M. Y., Dalmas, E., Sauter, N. S. & Boni-Schnetzler, M. Inflammation in obesity and diabetes: islet dysfunction and therapeutic opportunity. Cell Metab.17, 860–872 (2013). - PubMed
    1. Haythorne, E. et al. Diabetes causes marked inhibition of mitochondrial metabolism in pancreatic beta-cells. Nat. Commun.10, 2474 (2019). - PMC - PubMed
    1. Kim, H. & Kulkarni, R. N. Epigenetics in beta-cell adaptation and type 2 diabetes. Curr. Opin. Pharmacol.55, 125–131 (2020). - PMC - PubMed

Publication types

MeSH terms