. 2024 Oct 29;9(1):52.
doi: 10.1038/s41525-024-00440-w.

Gut microbial and human genetic signatures of inflammatory bowel disease increase risk of comorbid mental disorders

Affiliations

Gut microbial and human genetic signatures of inflammatory bowel disease increase risk of comorbid mental disorders

Junho Lee et al. NPJ Genom Med. .

Abstract

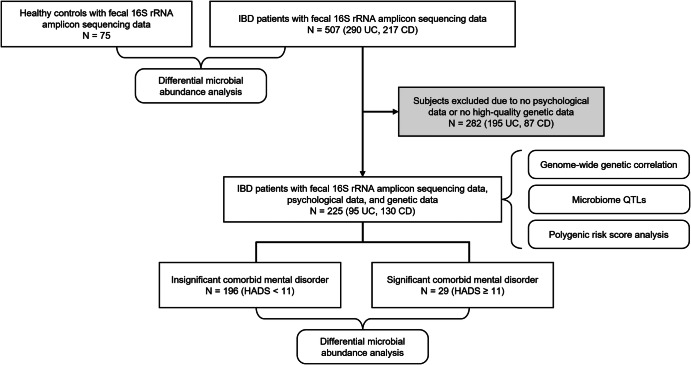
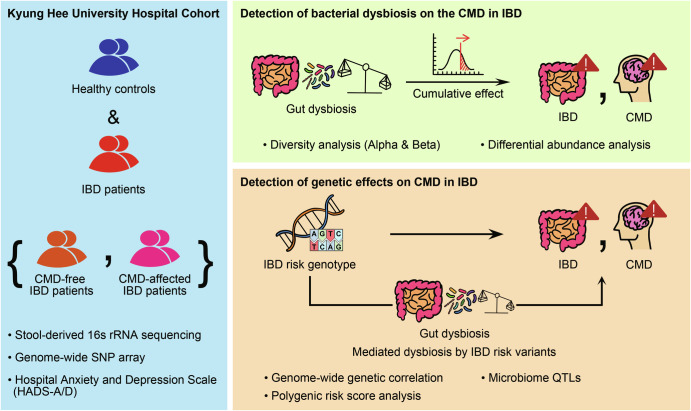
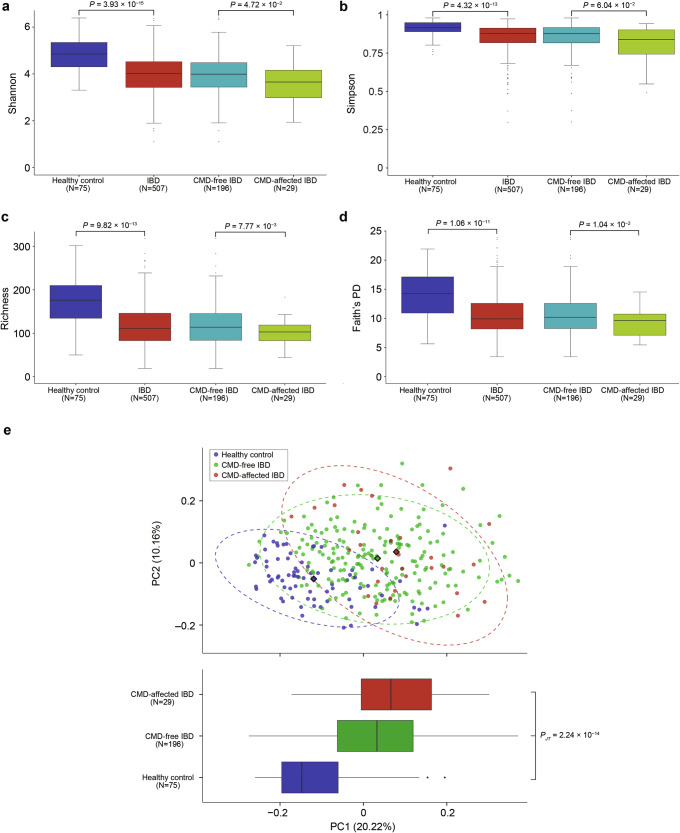
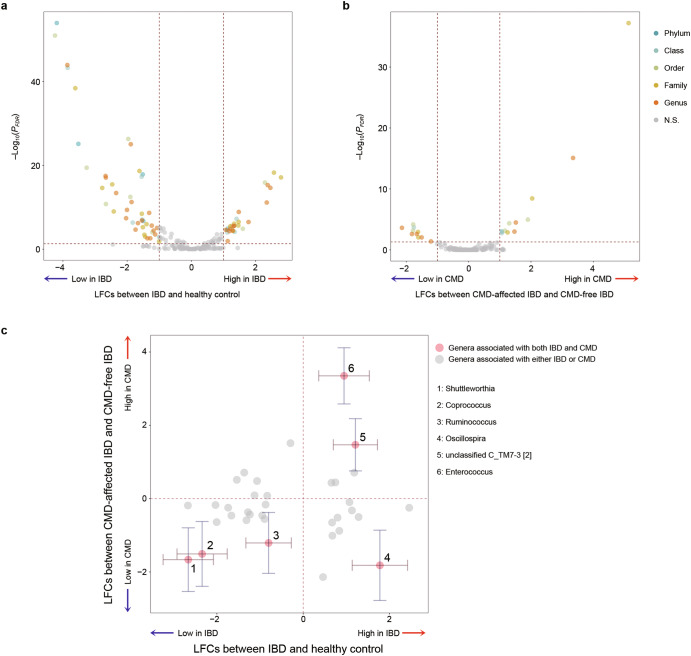
The high prevalence of comorbid mental disorders (CMDs) in patients with inflammatory bowel disease (IBD) is well-documented. This study delves into the intricate CMD-IBD relationship through comprehensive analyses using human variants, gut microbiome, and anxiety/depression estimates from a cohort of 507 IBD patients and 75 controls. Notably, patients with IBD, especially those with CMD, exhibited lower diversity than controls. We identified 106 differentially abundant taxa (DATs) in IBD patients compared to controls and 21 DATs distinguishing CMD-affected from CMD-free IBD patients. Microbial IBD-risk scores, reflecting an individual's microbial burden for IBD, revealed a significant enrichment of IBD-risk signatures in CMD-affected patients compared to CMD-free patients. Additionally, there was an IBD-risk variant potentially regulating the abundance of an IBD/CMD-associated DAT, suggesting an interplay between IBD-risk variants and dysbiosis in CMD. Our investigation underscores the pivotal role of IBD-associated gut dysbiosis in predisposing IBD patients to CMD, partially through genetic variant-mediated mechanisms.


Conflict of interest statement

The authors declare no competing interests.

Figures

Fig. 1
Fig. 1. A schematic diagram summarizing the study participants.
The schematic diagram illustrates the sample groups in the Kyung Hee University Hospital cohort according to data availability and analysis methods.
Fig. 2
Fig. 2. Summary of the study strategy.
The figure shows a simplified representation of the research scope and strategies to investigate the contributions of IBD-risk factors to the development of CMD using a large Korean case-control cohort with gut microbial and human genetic data and clinical outcomes.
Fig. 3
Fig. 3. Stacked bar plots illustrating the fecal microbial taxonomic profiles at the family level.
Each stacked bar indicates the relative abundance of microbial families in each sample from (a) UC, (b) CD, and (c) heathy control groups. Families with a median relative abundance of less than 1% are depicted in gray. Sample groups are divided based on the availability of HADS data and the affected status of CMD.
Fig. 4
Fig. 4. Microbial alpha and beta diversity indices.
Alpha diversity was assessed based on the Shannon index (a), Simpson index (b), richness (c), and Faith’s PD index (d) at the genus level. P-values for statistical differences in alpha diversity were calculated using t-test between healthy controls and patients with IBD and between CMD-free and CMD-affected IBD patients. e Beta diversity was measured based on the Bray–Curtis dissimilarity of individuals’ genus abundance and visualized in a PCoA plot according to the top two principal components (PCs). The centroid of each cluster is marked by a diamond. The top PC that explained the largest proportion (20.22%) of variance in microbial composition in the study subjects is shown in a boxplot according to the affected status. The P-value from a Jonckheere-Terpstra test (PJT) was calculated to test for a significant trend toward higher PC1 values in the order of healthy controls, CMD-free IBD patients, and CMD-affected IBD patients.
Fig. 5
Fig. 5. Comparison of the microbial abundance changes specific to the status of IBD and CMD.
Log2-fold changes (LFCs) in microbial abundance were estimated at the various taxonomic levels in a differential abundance analysis between healthy controls and patients with IBD (a), and between CMD-free and CMD-affected IBD patients (b). c The LFCs were then plotted in volcano plots based on their PFDR values. The scatter plot represents phenotype-specific LFCs for genera associated with either IBD or CMD (PFDR < 0.05). Data points highlighted in red with error bars of 95% confidence intervals indicate the genera whose abundance changes were significant in both phenotypes. Their names were provided with the initial of the lowest taxonomic rank that was classified. N.S. not significant.

References

    1. Conway, G. et al. The impact of co-existing immune-mediated diseases on phenotype and outcomes in inflammatory bowel diseases. Aliment Pharm. Ther.45, 814–823 (2017). - PMC - PubMed
    1. Lee, M. & Chang, E. B. Inflammatory Bowel Diseases (IBD) and the Microbiome-Searching the Crime Scene for Clues. Gastroenterology160, 524–537 (2021). - PMC - PubMed
    1. Guan, Q. A Comprehensive Review and Update on the Pathogenesis of Inflammatory Bowel Disease. J. Immunol. Res.2019, 7247238 (2019). - PMC - PubMed
    1. Levine, A., Sigall Boneh, R. & Wine, E. Evolving role of diet in the pathogenesis and treatment of inflammatory bowel diseases. Gut67, 1726–1738 (2018). - PubMed
    1. Yilmaz, B. et al. Microbial network disturbances in relapsing refractory Crohn’s disease. Nat. Med.25, 323–336 (2019). - PubMed

LinkOut - more resources