. 2024 Oct 29;15(1):9316.
doi: 10.1038/s41467-024-53710-7.

Structural basis for the transmembrane signaling and antidepressant-induced activation of the receptor tyrosine kinase TrkB

Affiliations

Structural basis for the transmembrane signaling and antidepressant-induced activation of the receptor tyrosine kinase TrkB

Erik F Kot et al. Nat Commun. .

Abstract

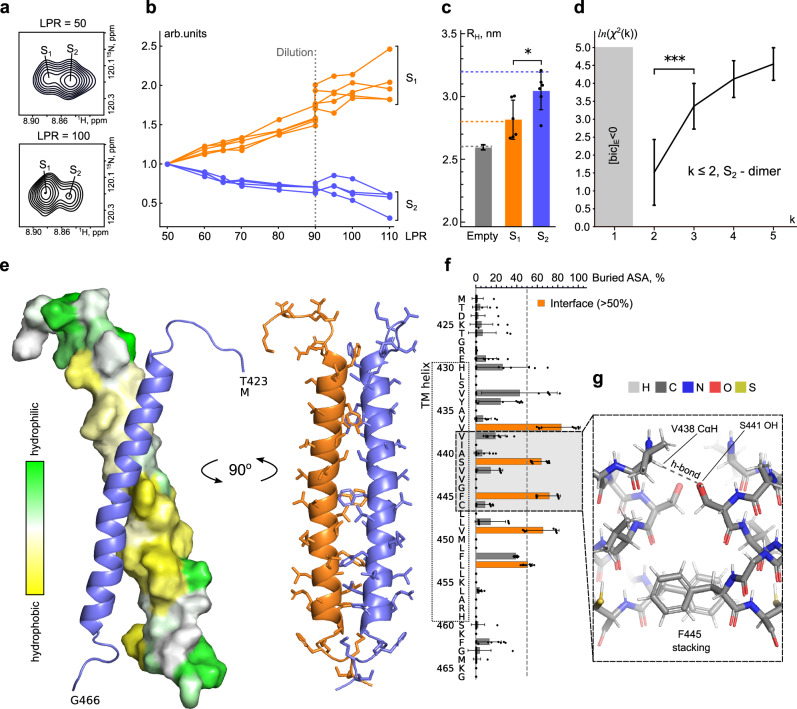
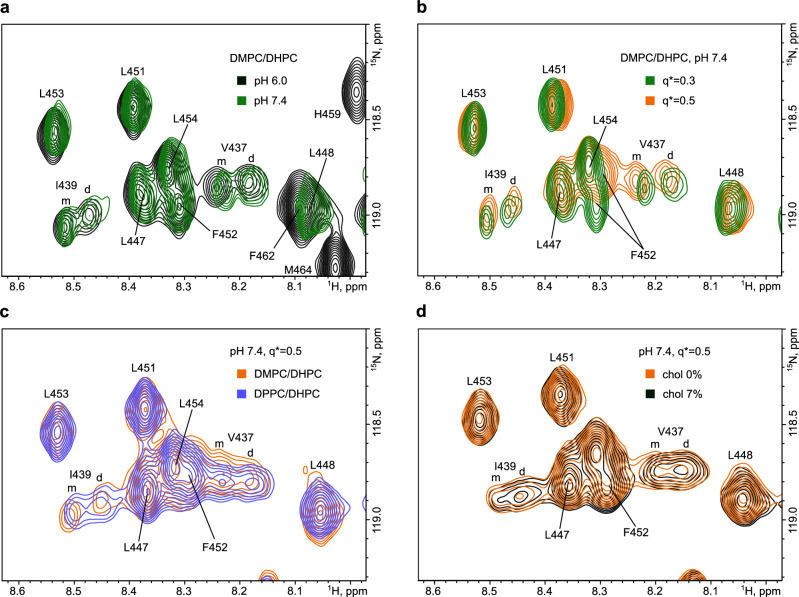
Neurotrophin receptors of the Trk family are involved in the regulation of brain development and neuroplasticity, and therefore can serve as targets for anti-cancer and stroke-recovery drugs, antidepressants, and many others. The structures of Trk protein domains in various states upon activation need to be elucidated to allow rational drug design. However, little is known about the conformations of the transmembrane and juxtamembrane domains of Trk receptors. In the present study, we employ NMR spectroscopy to solve the structure of the TrkB dimeric transmembrane domain in the lipid environment. We verify the structure using mutagenesis and confirm that the conformation corresponds to the active state of the receptor. Subsequent study of TrkB interaction with the antidepressant drug fluoxetine, and the antipsychotic drug chlorpromazine, provides a clear self-consistent model, describing the mechanism by which fluoxetine activates the receptor by binding to its transmembrane domain.


Conflict of interest statement

The authors declare no competing interests

Figures

Fig. 1
Fig. 1. Structure of the TrkBtm dimer.
a The signal of the A440 amide group in the 1H-15N-HSQC spectrum of TrkBtm reveals two forms, S1 and S2, whose populations depend on the LPR. b Relative intensities of the S1 (orange) and S2 (blue) backbone amide signals in the NMR spectra as a function of LPR. At LPR = 90 the sample was diluted 2.5x. TrkBtm overall concentration decreased from 0.28 to 0.11 mM. c the hydrodynamic radii (RH) of an empty q = 0.3 DMPC/DHPC bicelle (obtained from translational diffusion of lipids, error bar shows the error of measurement, gray) and S1- (orange) and S2-containing (blue) bicelles (obtained from the rotational diffusion of proteins, error bars show the SD among the n = 6 considered residues). * indicates the statistical significance of the difference according to the Mann-Whitney test, p = 0.0202. The dashed lines denote the theoretical RH values obtained using the ideal bicelle model, as described. d the natural logarithm of the penalty function χ2(k) calculated for n = 12 pairs of signals at several tested oligomer orders k = 2–5 of the S2 state. In the gray area, the penalty function was not determined (*** indicates the statistical significance of the difference according to the two-sided t-test, p = 3.08 × 10-6). Error bars show the SD among the tested pairs of residues. e the spatial structure of the dimeric TrkBtm. One of the helices is shown as a blue cartoon and the other - either as an orange cartoon or as a surface painted according to its hydrophobicity (using the White-Wimley scale). f Accessible surface area (ASA) of TrkBtm residues buried in the helix dimerization interface. The gray dashed line indicates the 50% threshold. The orange bars indicate the contact residues. Error bars indicate the SD among the set of n = 10 best NMR structures. g Closer view of the presumed key interactions supporting the TrkBtm dimer: V438 CαH-S441 Oγ polar contact and F445 stacking. Source data are provided as a Source Data file.
Fig. 2
Fig. 2. Effects of the environment on the TrkBtm structure.
a Overlaid fragments of 1H-15N-HSQC spectra of TrkBtm in DMPC/DHPC q* = 0.3 bicelles at LPR = 80 and pH = 6.0 (black) and 7.4 (green). m and d denote the monomer and dimer signals, respectively. b Spectra of TrkBtm at pH = 7.4 in DMPC/DHPC bicelles formed with q* = 0.3 (green) and 0.5 (orange). c Spectra of TrkBtm at pH = 7.4 in DMPC/DHPC (orange) and DPPC/DHPC (blue) q* = 0.5 bicelles. d Spectra of TrkBtm at pH = 7.4 in DMPC/DHPC q*=0.5, with a bilayer containing 0 % (orange) and 7 % (black) cholesterol (n/n). Each spectrum represents a separately prepared sample of TrkBtm, spectra in (a, b) were recorded at 800 MHz, whereas spectra in (c, d) at 600 MHz.
Fig. 3
Fig. 3. Single-point mutagenesis of TrkB transmembrane residues.
a Spatial structure of the TrkBtm dimer, the critical residues of the interface (orange), and the positions of point mutations (green) are indicated. b Amino acid sequence of TrkBtm (highlighted in light blue), the critical residues of the interface (orange), and point mutations (green circles) to Ile (up) or Ala (down) are indicated. c Average length of dendrites upon stimulation of PC12 TrkA-KO cells with BDNF. Data are provided as mean values ± SD. n ≥ 3 biological replicates and n ≥ 27 cells were analyzed (each dot represents one cell). d, e Relative amounts of phosphorylated Y706 and Y707 before and 5 and 15 min after BDNF stimulation of wild-type TrkB and its single-point mutants. Data are provided as mean values ± SD. n ≥ 3 biological replicates (each dot represents one independent replicate). Statistical significance is provided according to the Multiple two-sided t-test with Bonferroni correction (*p < 0.05, **p < 0.01, ***p < 0.001, ****p < 0.0001, ns denotes that changes with respect to the wt are not significant). Statistical analyses are listed in Supplementary Table 1. Source data are provided as a Source Data file.
Fig. 4
Fig. 4. Analysis of TrkB activity and oligomerization for wild-type and single-point S441A/I mutants.
a, c, d Dose-dependent phosphorylation of Y516 and Y706/607. b, e, f Activation of ERK and AKT cascades before, 5 and 15 min after BDNF stimulation. Data are shown as mean values ± SD. n ≥ 3 biological replicates (each dot represents one independent replicate). Statistical significance is provided according to the independent two-sided t-test (*p < 0.05, **p < 0.01, ***p < 0.001, ****p < 0.0001, ns denotes that changes with respect to the wt are not significant, if not otherwise indicated). g Analysis of oligomerization of TrkB-ECTM-mEYFP constructs in cells by Number&Brightness (see Methods section for more details). Statistical significance is determined using a non-parametric one-way ANOVA (Kruskal-Wallis test) followed by Dunn’s multiple comparisons test. n ≥ 2 replicates and n ≥ 37 points for each construct. The box plots were constructed with the upper box limit being the 75th percentile, the lower box being the 25th percentile, and the whiskers representing a 95% confidence interval. The mean is the open point, and the median is the horizontal line in the box. Statistical analysis results are shown in Supplementary Table 1. Source data are provided as a Source Data file.
Fig. 5
Fig. 5. Interaction of TrkBtm with various drugs.
a CSPs induced in TrkBtm by FLX (empty bars) and CPR (black bars). CSPs for the separate signals of the dimer are plotted at the bottom in a mirrored scale. Peak width (PW) of the TrkBtm signals is shown as a black dotted line. The maximal CSPs are shown by * symbols (See the Statistics subsection in the Methods section). b CSPs of V437 and Y434 plotted as a function of FLX (empty circles) and CPR (black circles) concentrations for the monomer and dimer forms of TrkBtm. The dashed lines indicate the results of a third degree polynomial approximation. TrkBtm dimer (left) and monomer (right) painted according to the amide CSP values induced by an 8:1 excess of FLX (c) or CPR (d). Residues with CSP higher than 0.05 ppm are shown in black. e The signal of the F445 backbone amide in the intact sample (left) and with 4:1 excess of either FLX (middle) or CPR (right). Slices along the 1H direction are shown on top with the corresponding signal to noise ratios (SNR) given. f Fraction of drugs residing in bicelles calculated from lateral diffusion at a drug:protein ratio of 8:1. Error bars indicate the error of the measurement. g Relative changes in the signal intensities of monomer (orange), dimer (blue), and overlapped (green) signals of TrkBtm upon drug addition. Error bars indicate the SD among the traced n = 5 NMR signals for each form. Star labels indicate statistically significant differences in the monomer and dimer populations according to the Mann-Whitney test (*p ≤ 0.05, **p ≤ 0.01), the p-values are provided in Supplementary Table 1. The relative intensities of the monomer and dimer are plotted until the signals overlap. Statistical analyses are listed in Supplementary Table 1. Source data are provided as a Source Data file.
Fig. 6
Fig. 6. Comparison of TM domain dimer conformations within the Trk family.
The spatial structures of TrkA (a, PDB 2N90 and TrkB (b, this work) TM dimers obtained by NMR in DPC micelles and DMPC/DHPC bicelles, respectively. Orange color denotes the residues on the experimentally determined interface. Green color indicates the residues proposed for the alternative dimerization interfaces, assumed from the cross-linking experiments (a) or computer modeling (b). c Manual sequence alignment of Trk family members based on the Clustal Omega program (http://www.clustal.org/) results for alignment of the transmembrane and intracellular domains. Experimentally determined TM domains are indicated, blue background highlights the identical residues.

References

    1. Bothwell, M. Recent advances in understanding neurotrophin signaling. F1000Research5, 1885 (2016). - PMC - PubMed
    1. Friedman, W. J. & Greene, L. A. Neurotrophin signaling via Trks and p75. Exp. Cell Res.253, 131–142 (1999). - PubMed
    1. Martin-Zanca, D., Hughes, S. H. & Barbacid, M. A human oncogene formed by the fusion of truncated tropomyosin and protein tyrosine kinase sequences. Nature319, 743–748 (1986). - PubMed
    1. Cocco, E., Scaltriti, M. & Drilon, A. NTRK fusion-positive cancers and TRK inhibitor therapy. Nat. Rev. Clin. Oncol.15, 731–747 (2018). - PMC - PubMed
    1. Segal, R. A. Selectivity in neurotrophin signaling: theme and variations. Annu. Rev. Neurosci.26, 299–330 (2003). - PubMed

Publication types

LinkOut - more resources