. 2024 Oct 29;7(1):1406.
doi: 10.1038/s42003-024-07101-9.

Eustigmatophyte model of red-shifted chlorophyll a absorption in light-harvesting complexes

Affiliations

Eustigmatophyte model of red-shifted chlorophyll a absorption in light-harvesting complexes

Alessandro Agostini et al. Commun Biol. .

Abstract

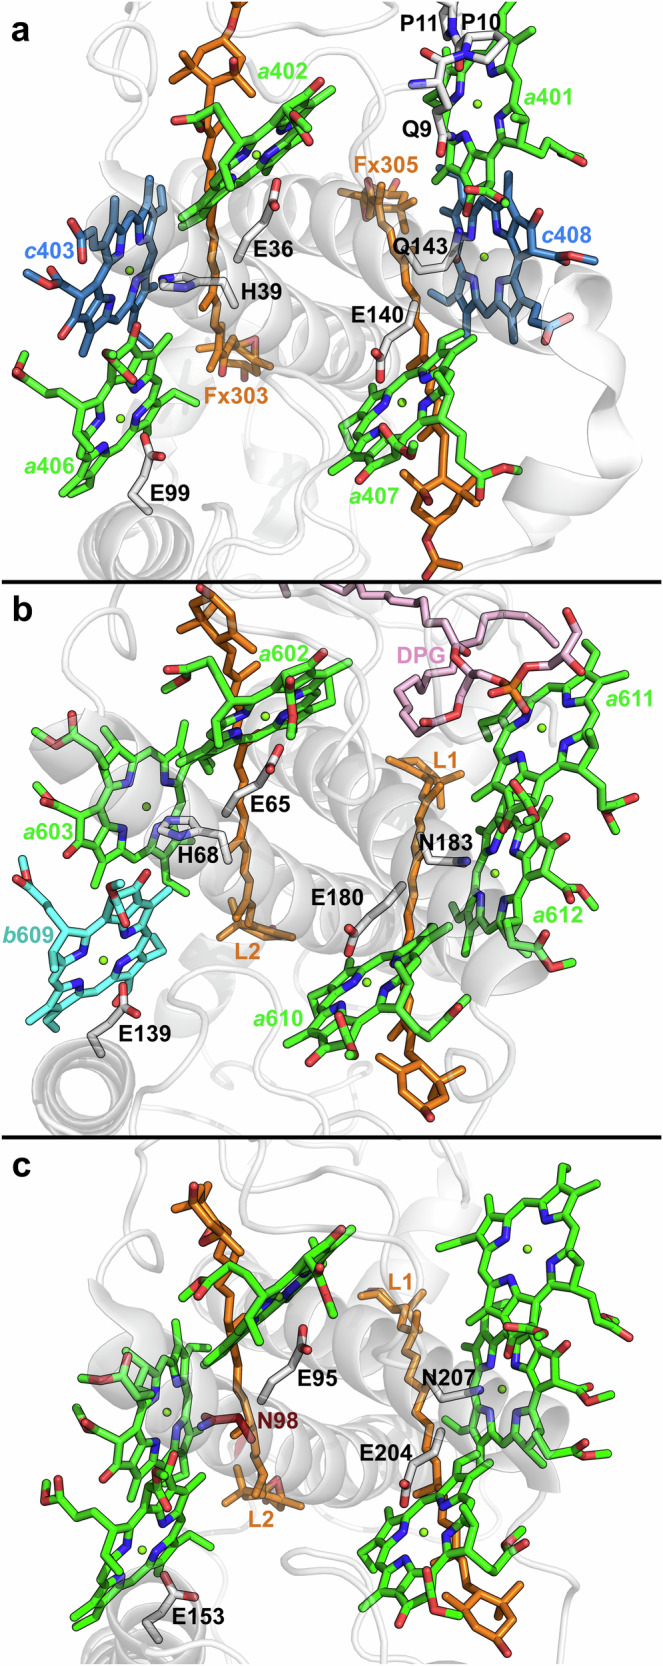
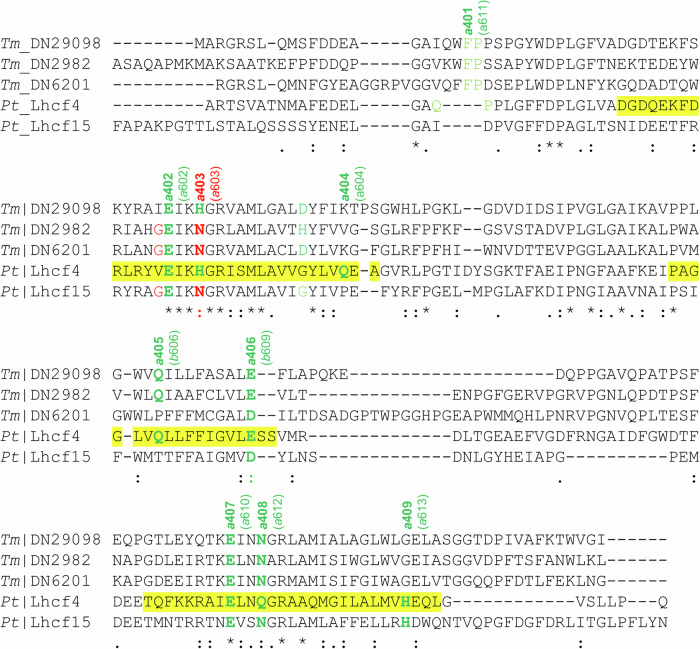
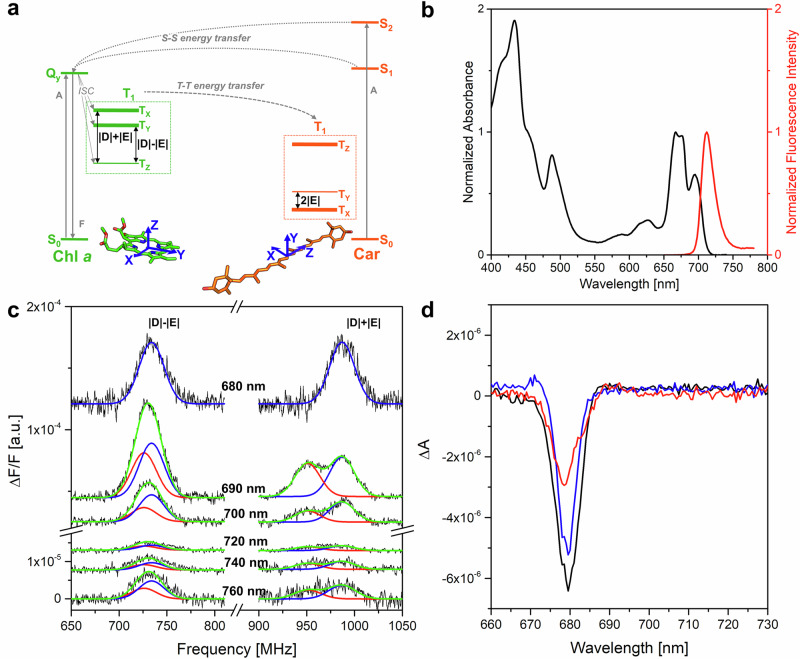
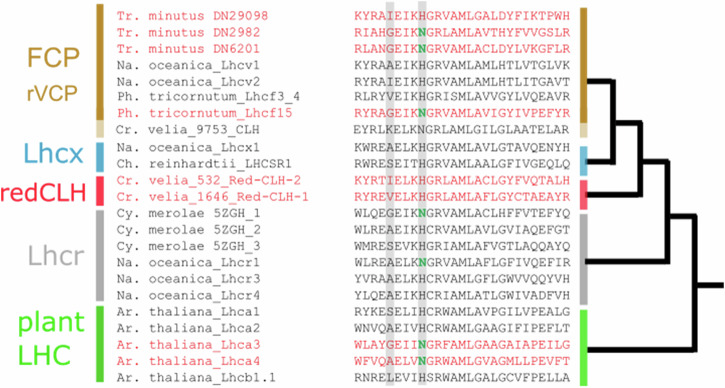
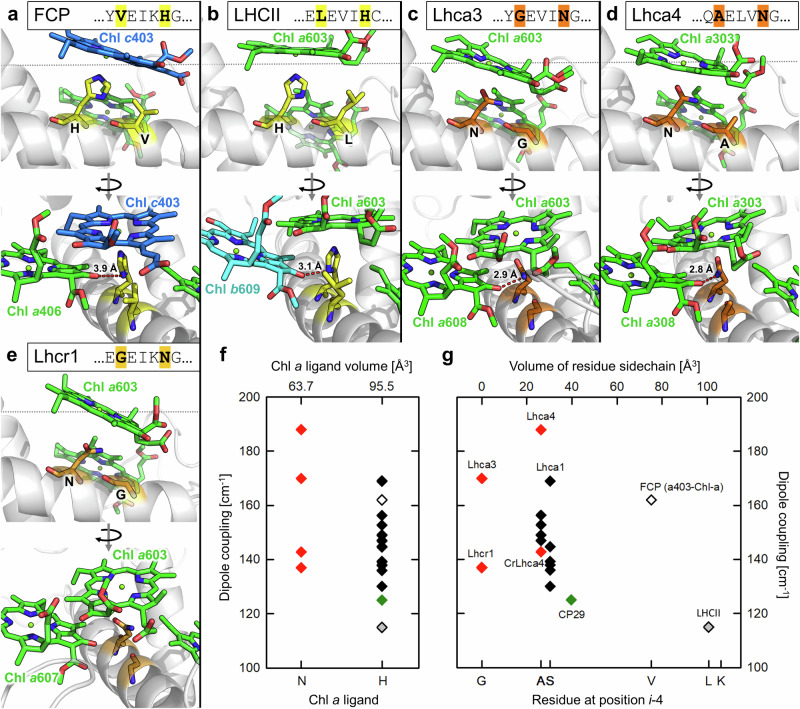
Photosynthetic organisms harvest light for energy. Some eukaryotic algae have specialized in harvesting far-red light by tuning chlorophyll a absorption through a mechanism still to be elucidated. Here, we combined optically detected magnetic resonance and pulsed electron paramagnetic resonance measurements on red-adapted light-harvesting complexes, rVCP, isolated from the freshwater eustigmatophyte alga Trachydiscus minutus to identify the location of the pigments responsible for this remarkable adaptation. The pigments have been found to belong to an excitonic cluster of chlorophylls a at the core of the complex, close to the central carotenoids in L1/L2 sites. A pair of structural features of the Chl a403/a603 binding site, namely the histidine-to-asparagine substitution in the magnesium-ligation residue and the small size of the amino acid at the i-4 position, resulting in a [A/G]xxxN motif, are proposed to be the origin of this trait. Phylogenetic analysis of various eukaryotic red antennae identified several potential LHCs that could share this tuning mechanism. This knowledge of the red light acclimation mechanism in algae is a step towards rational design of algal strains in order to enhance light capture and efficiency in large-scale biotechnology applications.


Conflict of interest statement

The authors declare no competing interests.

Figures

Fig. 1
Fig. 1. Comparison of prototypical LHCs.
Lumenal view of a Phaeodactylum tricornutum FCP (PDB ID: 6A2W), b Spinacia oleracea LHCII (PDB ID: 1RWT), and c Pisum sativum Lhca4 (PDB ID: 7DKZ), focusing on the conserved pigments close to the L1/L2 sites. Green sticks, Chls a; cyan sticks, Chl b; blue sticks, Chls c; orange sticks, luteins, violaxanthin, and fucoxanthins; pink sticks, dipalmitoyl-phosphatidylglycerol (DPG); white cartoons, polypeptide chain.
Fig. 2
Fig. 2. Alignment of polypeptide sequences of LHCs.
Polypeptide sequences of the LHCs from Trachydiscus minutus (Tm) and Phaeodactylum tricornutum (Pt), were used for the alignment. Yellow background signifies a transmembrane helix (derived from the crystallographic structures 6A2W). Chl binding residues in the sequences are colour-coded: green, Chl side chain ligand; light green, Chl backbone ligand via a water molecule; red, Chl red-shifting GxxxN binding motif. Note that in the case of the a404 site, a suitable ligand is found at the i-4 position in the Tm sequences (similarly to the binding of a604 in LHCII), which is proposed to replace the ligation in Pt.
Fig. 3
Fig. 3. 3Chl a optically detected magnetic resonance (ODMR) spectra of rVCP.
a Jablonski diagram of the main electronic states of Chls and Cars in LHCs (in green and orange, respectively). The states are arranged vertically by energy (not in scale), and horizontally by spin multiplicity. Absorption (A), fluorescence (F), and ISC are indicated by straight grey arrows; singlet-singlet (S-S) and triplet-triplet (T-T) energy transfers by curved dashed grey arrows; the transitions between the spin sublevels by double-pointed black arrows. For readability, only the transitions more relevant for the discussion of the results are drawn. The triplet sublevels are highlighted by dashed boxes for the two molecules. The relative populations of the triplet sublevels are indicated by the thickness of the level bars. At the bottom of the panel, the molecular structure of chlorophyll a (Chl a) and lutein (Car) with the directions of the zero-field splitting principal axes (zfs, the axes of the dipolar interaction between the two unpaired electrons) are reported (in blue arrows). b Absorption (black line) and fluorescence emission (red line, excitation wavelength 481 nm) spectra of rVCP. Temperature 77 K. c FDMR spectra (black lines) of the 3Chl |D|−|E| and |D|+|E| transitions at different wavelengths in the 680–760 nm range, as indicated. Amplitude modulation frequency 33 Hz, time constant 100 ms, temperature 1.8 K. The spectra are vertically shifted for better comparison. Reconstruction (green lines) of the experimental spectra as a sum of Gaussian components (blue and red lines). The fitting parameters are reported in Supplementary Table S2. d T-S spectra of 3Chl a. Resonance frequencies: 733 MHz (black line), 945 MHz (red line), and 1000 MHz (blue line). Amplitude modulation 33 Hz, time constant 1 s, temperature 1.8 K.
Fig. 4
Fig. 4. 3Car ODMR spectra of rVCP.
a FDMR spectra of the 3Car 2|E| transition detected at different wavelengths in the 690–760 nm range, as indicated. Amplitude modulation 333 Hz, time constant 100 ms, temperature 1.8 K. The spectra are vertically shifted for better comparison. The vertical dotted line highlights the 2|E| peak position. b FDMR spectrum of 3Car 2|E|, |D|−|E|, and |D|+|E| transitions at 740 nm. Amplitude modulation 333 Hz, time constant 100 ms, temperature 1.8 K. c T-S spectrum of 3Car, obtained with a resonance frequency of 230 MHz (3Car 2|E| transition, see panels a and b). Amplitude modulation 333 Hz, time constant 1 s, temperature 1.8 K.
Fig. 5
Fig. 5. Pulse EPR spectrum of rVCP.
a Scheme of the energies of the triplet sublevels of a 3Car (D > 0 and E < 0) as a function of an external magnetic field, B0, aligned with the 3Car zfs axis Y. Whenever the energy of the microwave radiation matches the energy gap between T0 and either T+1 or T−1, a transition can be observed (XI or XII for B0 parallel to Y, respectively). The transitions can be either emissive (E) or absorptive (A) depending on the relative populations of the high-field triplet sublevels involved, indicated by the thickness of the level bars. b FS-ESE spectrum of rVCP (black) and Chl a dissolved in Triton X-100 micelles (green) at 50 K. The difference (orange curve) between the FS-ESE spectrum of rVCP and the FS-ESE spectrum of Chl a, which corresponds to the ‘pure’ 3Car spectrum, has been vertically translated for clarity. The simulation of the 3Car spectrum for Fx303/Fx305 (blue line) is calculated considering a population of the triplet state by means of TTET starting from the triplet state of the closest conserved Chl a (Chls a403 and a408, respectively). The polarizations of the simulated 3Car components were determined on the basis of atomic coordinates for the acceptor-donor pairs derived from the crystallographic structure and an initial donor 3Chl polarisation (Px:Py:Pz = 0.375:0.425:0.200), resulting in a 3Car polarization of (Px:Py:Pz = 0.41:0.20:0.39) for both Fx303 and Fx305 (a molecular scheme of the acceptor-donor pair with the zfs tensors of the two molecules is reported at the bottom of the panel). The simulated 3Car spectra were calculated using the following parameters: D = −41.0 mT; E = −4.1 mT; linewidths (lwx, lwy, lwz) = (2.0, 2.0, 2.5) mT. Canonical transitions discussed in the text have been highlighted in the low-field half of the spectra. A = absorption, E = emission.
Fig. 6
Fig. 6. Multiple alignment of helix B sequences of LHC proteins with simplified phylogenetic tree topology on the right.
Highlighted is the Chl-binding site i = a403/a603 (H or N) and the corresponding position at i-4 (see text for explanation). Detailed version of the phylogenetic tree used to classify the proteins into groups given on the left is presented in Supplementary Fig. S5. Sequences of proteins that have been purified in a red-shifted Chl a-containing form are shown in red.
Fig. 7
Fig. 7. Investigation of the Chl a403 (a603) binding site in the LHC superfamily.
Detailed view of the chlorophyll-binding site a403(a603) in different LHC proteins (a: FCP: pdb 6A2W, b LHCII: 1RWT, c, d Lhca3, 4: 7DKZ, e Lhcr1: 5ZGH). f Plot of excitonic coupling between Chl a at sites a403 and a406 according to the Chl a ligand (i = N or H). Black diamonds, H-ligation; red diamonds, N-ligation; grey, green, and white diamonds were employed to highlight LHCII, CP29, and FCP, respectively. g Plot of excitonic coupling vs. the residue at i-4 position. Residue sidechain volumes are given on the top horizontal axis. All chlorophylls in the respective sites were parametrized as Chl a for the purpose of coupling computation.

Similar articles

Cited by

References

    1. Green, B. R. & Kühlbrandt, W. Sequence conservation of light-harvesting and stress-response proteins in relation to the three-dimensional molecular structure of LHCII. Photosynth. Res.44, 139–148 (1995). - PubMed
    1. Liu, Z. et al. Crystal structure of spinach major light-harvesting complex at 2.72 Å resolution. Nature428, 287–292 (2004). - PubMed
    1. Renger, T., Madjet, M. E., Knorr, A. & Müh, F. How the molecular structure determines the flow of excitation energy in plant light-harvesting complex II. J. Plant Physiol.168, 1497–1509 (2011). - PubMed
    1. Novoderezhkin, V., Marin, A. & van Grondelle, R. Intra- and inter-monomeric transfers in the light harvesting LHCII complex: the Redfield–Förster picture. Phys. Chem. Chem. Phys.13, 17093 (2011). - PubMed
    1. Carbonera, D. et al. Photoprotective sites in the violaxanthin–chlorophyll a binding Protein (VCP) from Nannochloropsis gaditana. Biochim. Biophys. Acta - Bioenerg.1837, 1235–1246 (2014). - PubMed

MeSH terms

LinkOut - more resources