. 2024 Dec;26(12):2129-2143.
doi: 10.1038/s41556-024-01530-8. Epub 2024 Oct 29.

SERRATE drives phase separation behaviours to regulate m6A modification and miRNA biogenesis

Affiliations

SERRATE drives phase separation behaviours to regulate m6A modification and miRNA biogenesis

Songxiao Zhong et al. Nat Cell Biol. 2024 Dec.

Abstract

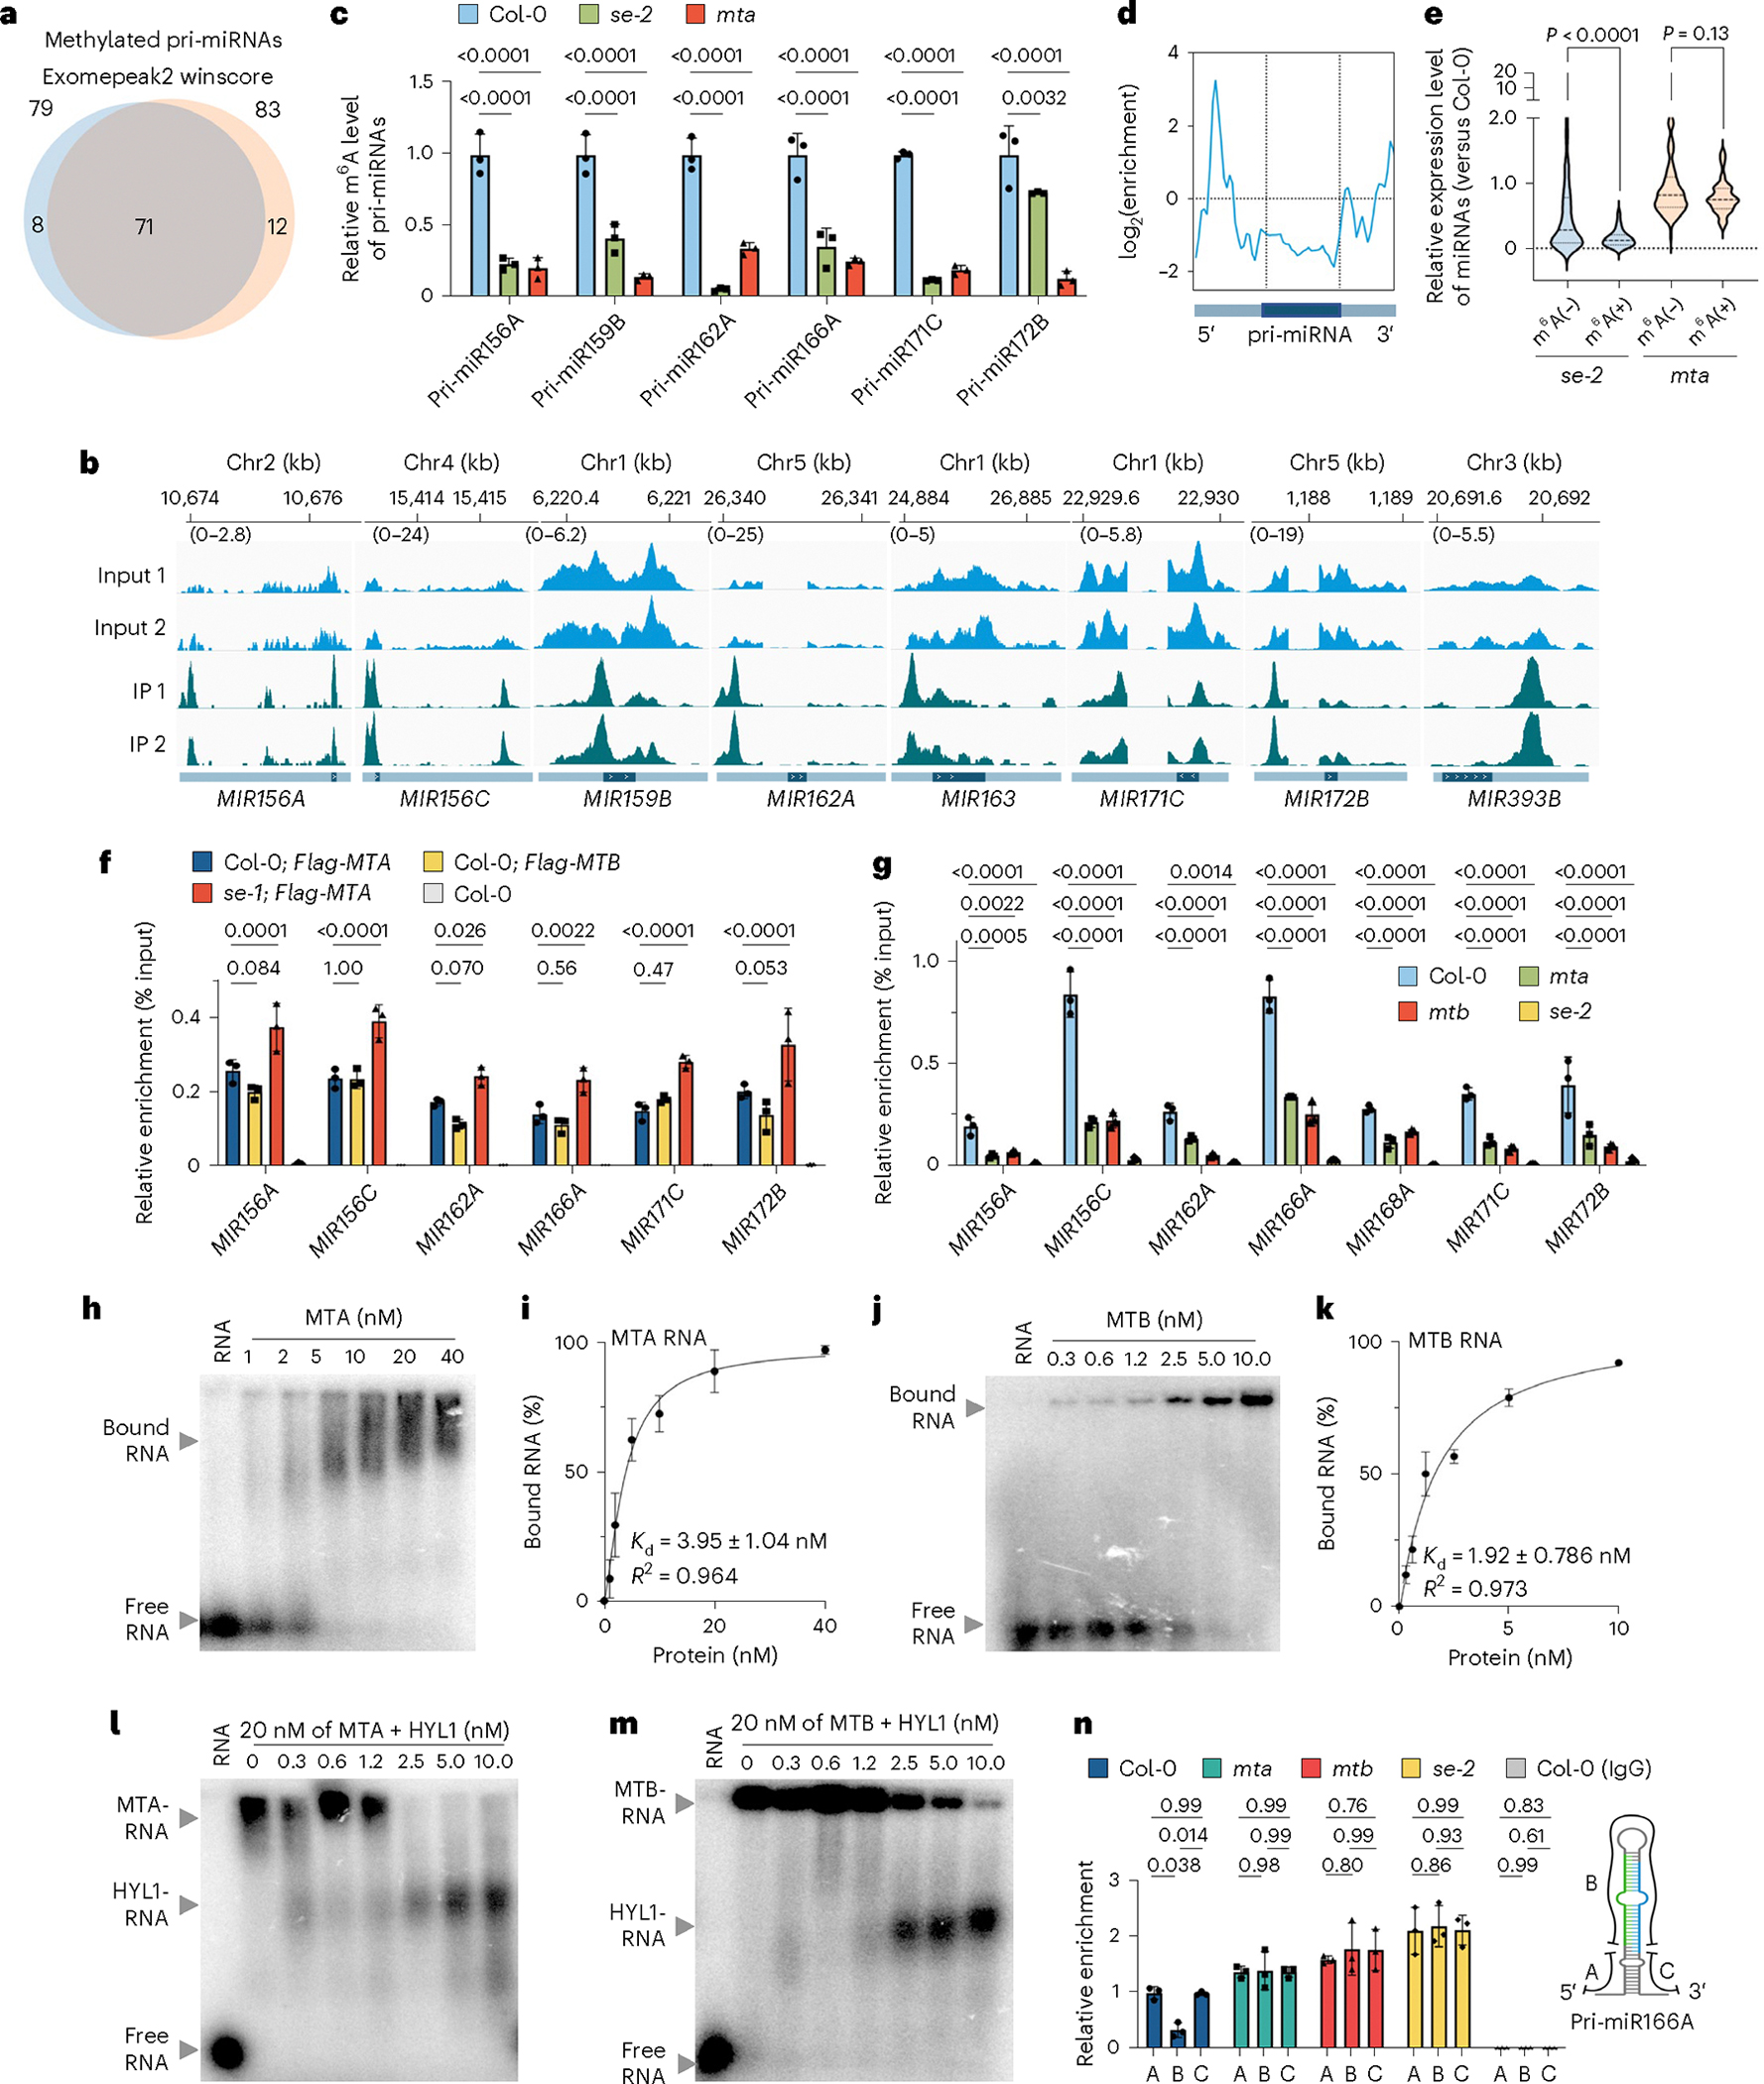
The methyltransferase complex (MTC) deposits N6-adenosine (m6A) onto RNA, whereas the microprocessor produces microRNA. Whether and how these two distinct complexes cross-regulate each other has been poorly studied. Here we report that the MTC subunit B tends to form insoluble condensates with poor activity, with its level monitored by the 20S proteasome. Conversely, the microprocessor component SERRATE (SE) forms liquid-like condensates, which in turn promote the solubility and stability of the MTC subunit B, leading to increased MTC activity. Consistently, the hypomorphic lines expressing SE variants, defective in MTC interaction or liquid-like phase behaviour, exhibit reduced m6A levels. Reciprocally, MTC can recruit the microprocessor to the MIRNA loci, prompting co-transcriptional cleavage of primary miRNA substrates. Additionally, primary miRNA substrates carrying m6A modifications at their single-stranded basal regions are enriched by m6A readers, which retain the microprocessor in the nucleoplasm for continuing processing. This reveals an unappreciated mechanism of phase separation in RNA modification and processing through MTC and microprocessor coordination.


Conflict of interest statement

Competing interests: The authors declare no competing interests.

Figures

Extended Data Fig. 1 |
Extended Data Fig. 1 |. Pan-transcriptome network association analysis reveals obvious association of the expression patterns between SE and m6A RNA methylation writers.
a, b, Pan RNA-seq network analysis showed synchronous expression association of microprocessor components and m6A writers over all samples (a), or across different tissues (b). Spearman (or Pearson) correlation analysis was conducted to assess the expression relationship using over 1,000 RNA-seq data from various wild-type plant tissues. The house keeping gene ACTIN1 (AT2G37620) serves as a control. Each point in (a) represents expression levels of two indicated genes shown in log10(FPKM) in individual RNA-seq datasets. In (b), R values, Spearman R correlation. P values for small, medium and large cycles are 0.33, 0.1 and 0.001, respectively. Unpaired two-sided t-test.
Extended Data Fig. 2 |
Extended Data Fig. 2 |. Experimental validation of the genetic association between SE and MTC in developmental processes, modulation of gene expression, and protein-protein interactions.
a, Design of artificial miRNAs (mta-a, -b, mtb, and fip37). The sequence alignment of the artificial miRNAs (in red) with their target sequences (in blue). Be noted: two independent artificial-miRNA lines for MTB and FIP37 were generated and validated. One elite line for each was used for further studies. b – d, RT-qPCR assays showed that the amount of MTA, MTB and FIP37 transcripts was largely reduced in knockdown lines of mta (b), mtb (c), and fip37 (d) vs Col-0 and se-2, respectively. Data are mean ± s.d. of three independent experiments. P values, one-way ANOVA analysis with Dunnett’s multiple comparisons test. For (b), p values for relative expression of MTA at the se-2, mta-a, and mta-b vs Col-0 are 0.23, < 0.0001, and < 0.0001, respectively. For (c), p values for relative expression of MTB at the se-2 and mtb vs Col-0 are 0.98 and 0.0013, respectively. For (d), p values for relative expression of FIP37 at the se-2 and fip37 vs Col-0 are 0.99 and 0.0010, respectively. e, f, Western blots showed the reduced MTA (e) and MTB (f) proteins in their amiR-KD lines. Endogenous proteins were detected by indicated antibodies, respectively. HSP70 was a loading control. g, Knockdown lines of mta, mtb, and fip37 displayed developmental defects in seedlings. The photos were taken of 10-day-old seedlings, with Col-0 and se-2 serving as controls. Scale bars, 1 cm. h, Y2H screening showed that neither DCL1 nor HYL1 directly interact with m6A writers. 1:5 serial dilutions are shown. -LT, lacking Leu and Trp; -LTHA, lacking Leu, Trp, His and Ade. i, LCI assays in Nicotiana Benthamiana demonstrated that both MTB and FIP37 can mediate the interaction between MTA and SE. CPM: Count per minute j – l, Co-IP assays validated the interaction between SE and MTC in plants. Proteins were extracted from transgenic plants of p35S::Flag-MTA (j), p35S::Flag-MTB (k), and p35S::Flag-4xMyc-FIP37 (l) transgenic plants, respectively. Lysates were then supplied with or without 50 μg/mL of RNase A prior to IP with an anti-FLAG antibody. SE was detected via a specific anti-SE antibody. HSP70 serves as a negative control. m, BiFC assays validated the interactions between SE and MTC in Arabidopsis mesophyll protoplast. PAG1 serves as a positive control. and showed similar results. Scale bar, 10 μm. At least three independent experiments were performed (e, f, i, j, k, and l), ten transgenic plants exhibited were photographed (g), ten independent colonies (h) and ten independent protoplasts for each interaction were tested (m), and representative images are shown.
Extended Data Fig. 3 |
Extended Data Fig. 3 |. MeRIP-Seq shows different m6A epi-transcriptome profiling of Poly(A) + RNA in se and mta vs Col-0.
a, HPLC-MS quantification of m6A/A levels of commercial m6A (+) and m6A (−) spike-ins, GLuc (m6A/A, ~20%) and CLuc, respectively. Data are mean ± s.d. of three independent experiments. b, Schematic approach for MeRIP-Seq. Briefly, the purified poly(A) + RNA was mixed with internal controls containing m6A modified (red) and unmodified (yellow) spike-ins, and then fragmented. The resulting fragments were immunoprecipitated using a specific anti-m6A antibody. Parallel IPs using an anti-GFP antibody were performed as negative controls. The IP-ed RNAs were then processed for library construction and high-throughput sequencing, enabling the identification and quantification of m6A modifications at a transcriptome-wide level. c, Autography images of input and m6A RNA enriched by indicated antibodies in (b). One tenth of the input and all of immunoprecipitated RNA were de-phosphorylated and then labelled with P32-ATP before resolvement in 8% urea gels. d, The motif sequences for m6A modifications in the context.
Extended Data Fig. 4 |
Extended Data Fig. 4 |. Computational simulation reveals that the IDR regions of SE and MTB mediate the protein-protein interaction.
a – f, Computational simulation via IUPred3 (a – c) and AlphaFold2 (d – f) showed disorder regions of animal (a, b) and plant m6A writers (c – e), and plant SE (f). For IUPred3 analysis, a window size of 30 consecutive residues was used. The predicted disordered and ordered regions are presented in red and blue, respectively. The left y-axis represents the tendency score, while the x-axis represents positions of amino acids. ZF, zinc finger; MTD, methyltransferase domain. g, h, 3D models of heterotypic assembly, including a human-MTC mimicking structure of MTA-MTB (g), and an IDR-coupled folding model of SE-MTB (h). Both models were predicted via the multimer module of AlphaFold2. The different entities are color-coded as indicated. In (h), the N-terminal IDR of MTB wrapped around the C-terminal IDR of SE to create a pivotal interaction interface which served as the nexus of the MTB-SE assembly, which was further stabilized by the N-terminal IDR of SE clasping MTB. Furthermore, the MTase domain of MTB and the zinc finger domain of SE maintained a functionally active conformation like that of MTC or the monomer, respectively. i, Sequence alignment of C-terminal of SE and its homologs across different species showed that R718 is conserved through plants. Predicted seven donors of hydrogen bonds in the SE-MTB interaction were highlighted in dashed boxes.
Extended Data Fig. 5 |
Extended Data Fig. 5 |. MTA and MTB show liquid-liquid phase separation only in the presence of SE.
a, Coomassie Brilliant Blue (CBB) staining of purified recombinant proteins for in vitro assays in SDS–PAGE gels. b, In vitro droplet formation of 3 μM purified mCherry-SE, mCherry-SE-R718A, mCherry-SEΔIDR1, and mCherry-LCDFUS-SEΔIDR1. c, Recombinant MTB protein formed aggregates when dialyzed from high salt solution (800 mM) into a low salt (150 mM) solution. d, In vitro assays with 3 μM MTA-CFP indicated that the presence of the crowder 5% Ficoll resulted in insoluble condensates resistant to 10% 1,6-HD. e, In vitro condensate formation assays indicated that the removal of the fluorescent tag had no impact on the phase behavior of either MTA or MTB. f, Confocal images shows no co-condensates formed by LCDFUS and MTB in vitro. g, Confocal images showed co-condensation of MTA-CFP and YFP-MTB with or without 5% Ficoll. h, Rendered 3D shapes of SE-MTB co-condensates. i – m, Confocal images revealed that transiently expressed MTA-CFP, YFP-MTB, and mCherry-SE in Arabidopsis mesophyll cells from Col-0 display liquid-like co-condensates. In (i), overlapped signals were observed. In (j), rendered 3D modeling reveals that co-condensates exhibit a spherical shape. In (k), fusion of co-condensates is presented with time-lapse live imaging. In (l, m), FRAP assays and the recovery curve showed that MTC displays liquid-like phase behavior. Data are mean ± s.d. of eight independent experiments. n, Confocal microscopic images showed the fluorescence of transiently expressed proteins in Arabidopsis mesophyll protoplast prepared from se-1. Be noted that SE and LCDFUS-SEΔIDR1, but not SE-R718A and SEΔIDR1, formed liquid-like co-condensates with MTA and MTB in protoplasts. 2.5% 1,6-HD treatment was adopted 10 min prior before imaging which disrupted liquid-like condensates. For (a, b, f, and n), SEΔIDR1, plant SE depleting N-terminal IDR; LCDFUS- SEΔIDR1 is a chimera protein of human FUS’s LCD and SEΔIDR1; FUSLCD, human FUS’s LCD without SEΔIDR1. Scale bars, 10 μm (b, dg), 5 μm (h, n), and 2.5 μm (i, j, k, and l). At least three independent experiments were performed (ah), at least eight independent protoplasts were tested (in), and representative images are shown.
Extended Data Fig. 6 |
Extended Data Fig. 6 |. SE regulates the phase behaviors of MTC in plants.
a – d, Confocal images (a) and FRAP assays (b – d) revealed that SE and MTC have similar phase behaviors when transiently expressed via (a, b, upper panels, and c) 35S and (a, b, bottom panels, and d) their native promoters in N. benthamiana. Data are mean ± s.d. of at least eight independent experiments. e, FRAP assays showed that SE and MTB condensates undergo phase transition from liquid-like to a gel- or solid- like behavior upon 1,6-HD treatment that blocks the signal recover after bleaching. Regions of interest were labelled with white circles. f, g, Confocal images (f) and statistical analysis (g) revealed the decreased MTB signal in se-1 vs Col-0. In (g), counting mode was used to analyse detectable photon for normalization. Data are mean ± s.d. of sixteen independent experiments. P value is < 0.0001, an unpaired two-sided t-test. h, Immunoblots with three-week-old plants detected the proteins in indicated fractions extracted from se-2 and se-3 vs Col-0. i, RNA-seq analysis exhibited that increased expression of MTB in ten-day-old seedling in se-2 vs Col-0. Data are mean ± s.d. of three independent replicates. P value is 0.011, an unpaired two-sided t-test. j, Two biological replicates of immunoblots with ten-day-old seedling detected a decreased ratio of soluble (supernatant) MTB in se-2 vs Col-0 where the amount was arbitrarily assigned a value of 1. Scale bars, 2.5 μm (a, b, e, andf). At least eight (a, b, ande), sixteen (f), and three (h, j) independent experiments were performed, and representative images are shown.
Extended Data Fig. 7 |
Extended Data Fig. 7 |. SE stabilizes MTB by preventing 20S-proteasome-mediated degradation in plants.
a – c, MTB-decay assays. Immunoblot assays showed that different protein stabilities of the plant MTB protein (a) and purified recombinant MTB protein (b) in the presence of the indicated reagents. The statistical analysis (c) of left-over MTB in (b). CHX, cycloheximide, 0.5 mM; MG-132, 50 μM; PYR-41, 50 μM. Only the comparisons with the Col-0 (DMSO) group are shown. P values for se-2 (MG-132) and se-2 (DMSO) vs Col-0 (DMSO) are 0.97 and < 0.0001, respectively. Two-way ANOVA analysis with Tukey’s multiple comparisons test results. See also supplementary table 4 for detailed comparisons. d, e, Y2H (d) and BiFC assays (e) showed interactions between MTB and 20S proteasome subunits, including PAG1, PBE1, and PBE2. In (d), negative controls for Fig. 4h (1:10 serial dilutions) are shown. SD-LT, synthetic defined medium lacking Leu and Trp; -LTHA, lacking Leu, Trp, His and Ade. f, RNA-seq analysis showed the expression level of m6A writers in pag1 vs Col-0. Data are mean ± s.d. of three biological replicates. P values for MTA, MTB, FIP37, and SE at pag1–2 vs Col-0 are 1.00, 0.99, 0.99, and 1.00, respectively. Unpaired two-sided t-test. g, Overexpression of MTA in Col-0 and se-1 could promote flowering time whereas overexpression of MTB could only do this in Col-0, but not in the se-1 background. h, MTB-interaction compromised or IDR-depleted SE variants could not complement the developmental defects of se-1. 6As-SE, in which all potential hydrogen donors in C-terminal were mutated except R718; SE-R718A, which has compromised interaction with MTB; SEΔIDR1, which lacks the N-terminal IDR, failed to form spherical co-condensates; LCDFUS-SEΔIDR1, a chimera protein of human FUS’s LCD fused with SEΔIDR1, exhibits a pattern analogous to wild-type SE. Three-week-old plants were imaged. Scale bars, 10 μm (e), 5 cm (g), 1 cm (h). Three independent experiments (a, b) were performed, at least 10 independent colonies and protoplasts for each interaction were tested (d, e), at least ten transgenic plants showed similar phenotype (g, h), and representative images are shown.
Extended Data Fig. 8 |
Extended Data Fig. 8 |. MTC promotes miRNA production.
a, Linear regression analysis did not detect significant correction between expression and methylation profiles of methylated pri-miRNAs identified by exomePeak2 in se-2. b, Statistical analysis showed that enrichment efficiencies of m6A (+) vs m6A (−) spike-ins were inversely correlated with the endogenous m6A levels in m6A-IP-qPCR. Enrichment efficiency of methylated spikes was divided by the one of unmethylated spikes in individual samples and then normalized to that of Col-0 in which the value was arbitrarily set as 1. P values for relative enrichment of standards at se-2 and mta are 0.040 and 0.0001, respectively. c – f, Bar graphs showed that reduction of miRNA (c, d), accumulation of miRNA target transcripts (e) and pri-miRNAs (f) in indicated plants. In (c), our sRNA-seq results and public sRNA-seq were exhibited in parallel. In (d), small RNA RT-qPCR analysis of indicated miRNAs. In (e), RNA-seq analysis of miRNA target genes. In (f), RT-qPCR analysis of pri-miRNAs. U6 and UBQ10 served as internal controls for normalization of miRNAs in (d) and pri-miRNAs in (f), respectively. For (c), p values for relative expression of miR156, miR158, miR159, miR164, miR166, miR167, miR171, miR319, and miR161.1, at the sRNA-seq of mta; pABI3::MTA vs Col-0 are 0.15, 0.12, 0.0004, 0.0002, 0.014, 0.0023, 0.0008, 0.0035, and 0.37, at the sRNA-seq mta-a vs Col-0 are 0.16, 0.081, 0.038, 0.10, 0.019, 0.057, 0.0013, < 0.0001, and 0.43, respectively. For (d), p values for relative expression of miR158, miR164, miR166, miR167, miR171, miR319 are all < 0.0001, for miR156 and miR161.1, at mta vs Col-0 are 0.014 and 0.86, at mtb vs Col-0 are 0.76 and 0.76, at fip37 vs Col-0 are 0.87 and 0.87, at se-2 vs Col-0 are both < 0.0001, respectively. For (e), p values for relative expression of genes at mta vs Col-0 are 0.0010, < 0.0001, 0.052, < 0.0001, 0.10, 0.015, 0.060, < 0.0001, 0.0003, 0.034, 0.053, 0.0011, and 0.019, at se-2 vs Col-0 are < 0.0001, < 0.0001, < 0.0001, 0.0003, 0.0037, 0.015, 0.018, 0.018, 0.027, 0.043, 0.061, 0.066, and 0.090, respectively. For (f), p values for relative expression of pri-miRNAs at mta vs Col-0 are 0.0017, 0.0015, < 0.0001, < 0.0001, 0.0047, 0.035, 0.015, and 0.0059, at se-2 vs Col-0 are 0.0012, < 0.0001, < 0.0001, < 0.0001, 0.0015, 0.0054, < 0.0001, and < 0.0001, respectively. g, h, MTA does not impact the transcription of MIR167a locus. Both histochemical staining analysis (g) and RT-qPCR of GUS activity (h) showed comparable transcriptional levels of MIR167a in mta vs Col-0. Two-week-old seedlings were analyzed. Scale bar, 0.5 cm. For (h), P value is 0.95. i, RT-PCR analysis showed that the patterns of pri-miRNA alternative splicing are comparable in Col-0 and mta. j, RNA-seq analysis showed that the transcript levels of microprocessor components are not decreased in mta vs Col-0. P values for relative expression of miRNA pathway genes at mta vs Col-0 are 0.018, 0.98, 0.69, 0.019, 0.71, 0.082, 0.99, 0.88, 0.69, and 0.12, at se-2 vs Col-0 are 0.0038, 0.99, 0.74, < 0.0001, 1.00, 0.0001, 0.11, 0.84, 0.68, and 0.24, respectively. The experiments were replicated three times and representative results are shown (i, g). Data are mean ± s.d. of three independent experiments (b – f, h, and j). P values, one-way (b) and two-way (c – e, and j) ANOVA with Dunnett’s multiple comparison test, and unpaired two-sided t-test (f, h).
Extended Data Fig. 9 |
Extended Data Fig. 9 |. MTC enables co-transcriptional processing of pri-miRNAs.
a, Comparation of public SE ChIP-seq and our MeRIP-seq on MIRNA revealed that SE is remarkably enriched in the loci that yield methylated pri-miRNAs. b, EMSA showed that FIP37’s RNA affinity is much weaker than that of MTB. The experiments were replicated three times and a representative result was shown. c – e, H3-RIP-qPCR assays detected increased retention of different fragments of tested pri-miRNAs along MIRNA loci in the indicated mutants vs Col-0. Be noted that defective processing of pri-miRNAs was observed with pri-miR166B (c), pri-miR168A (d), and pri-miR402 (e) in the mutants vs Col-0. IP with IgG serves as a negative control. A, B, and C refer to 5’ flanking, pre-miRNA, and 3’ flanking sequences of pri-miRNA as indicated in Fig. 6n. Data are mean ± s.d. of three independent experiments. P values, two-way ANOVA with Tukey’s multiple comparison test. For (c), p values for relative enrichment of A vs B, B vs C, and A vs C at Col-0 are 0.0034, 0.038, and 0.55, at mta are 0.22, 0.98, and 0.54, at mtb are 0.98, 0.99, and 0.99, at se-2 are 0.98, 0.85, and 0.75, at IgG control are 0.0034, 0.24, and 0.14, respectively. For (d), p values for relative enrichment of A vs B, B vs C, and A vs C at Col-0 are 0.022, 0.048, and 0.95, at mta are 0.58, 0.91, and 0.74, at mtb are 0.74, 0.93, and 0.99, at se-2 are 0.14, 0.60, and 0.90, at IgG control are 0.53, 0.58, and 0.45, respectively. For (e), p values for relative enrichment of A vs B, B vs C, and A vs C at Col-0 are < 0.0001, 0.0047, and 0.57, at mta are 0.88, 0.66, and 0.75, at mtb are 0.088, 0.93, and 0.093, at se-2 are 0.79, 0.72, and 0.072, at IgG control are 0.45, 0.74, and 0.63, respectively.
Extended Data Fig. 10 |
Extended Data Fig. 10 |. Plant m6A readers ECT2 can facilitate pri-miRNA processing via binding to m6A sites whereas inhibiting the processing when binding to structured region of pri-miRNAs.
a, IP-MS analysis identified several m6A readers in the SE immunoprecipitates. b, Pan RNA-seq network analysis showed the expression profiles of Arabidopsis m6A readers across various tissues. c, Y2H assays showed that ECT2 interacts with SE, but not with HYL1 nor DCL1. At least 10 independent colonies tested for each interaction. 1:10 serial dilutions are shown. SD-LT, synthetic defined medium lacking Leu and Trp; -LTHA, lacking Leu, Trp, His and Ade. d, RT-qPCR analysis showed that the expression level of some pri-miRNAs was increased in the ect2; ect3; ect4 triple mutant vs Col-0. Data are mean ± s.d. of three biological replicates. P values, unpaired two-sided t-test. P values for indicated genes at ect2; ect3; ect4 vs Col-0 are < 0.0001, 0.0145, 0.99, < 0.0001, and 1.00, respectively. e, CBB staining of purified recombinant ECT2 and ECT2-W521A in SDS-PAGE. f, g, EMSA assays showed the capacities of ECT2 (f) and ECT2-W521A (g) binding to different substrates. For ssRNA substrates, oligonucleotides were synthesized with the context GA(m6A)CAUAGAAAGAGAGAGAUAUAAA carrying a m6A locus and an identical sequence without m6A. Structured RNAs were folded prior to binding assays. The experiments were replicated three times and representative results are shown. h, Illustration and sequence of structured RNAs used in EMSA. i – l, The binding curves of ECT2 and ECT2-W521A to structured RNAs in (f, g). The Kd values were calculated from the EMSA images quantification with s.d. from three experiments, ECT2 and m6A (−) URURU (+) structured RNA (i), ECT2 and m6A (−) URURU(−) structured RNA (j), ECT2-W521A and m6A (−) URURU (+) structured RNA (k), and ECT2-W521A and m6A (−) URURU(−) structured RNA (l). Be noted that ECT2 has clearly higher binding affinity to m6A-substrates than m6A-lacked substrates. See also Fig. 7 for Kd of ECT2 / ECT2-W521A and m6A (+) URURU (+) structured RNA. Data are mean ± s.d. of three biological replicates. m, Illustration and sequence of m6A (+) pri-miR166A used in the processing assay.
Fig. 1 |
Fig. 1 |. SE promotes m6A modification in Arabidopsis.
a, mta, mtb and fip37 displayed developmental defects in 3-week-old plants. Scale bar, 1 cm. b, A Venn diagram illustrating significant overlap of differentially expressed genes between se-2 and mta mutants versus Col-0. P values for shared upregulated and downregulated genes in se-2 and mta are both <0.0001. c, Y2H screening identified MTB and FIP37 as additional partners of SE. VIR, virilizer; SD–LT, synthetic defined medium lacking Leu and Trp; –LTHA, lacking Leu, Trp, His and Ade; AD/BD, transcription activation/DNA-binding domain. d, Co-IP assays validated the interaction between SE and MTC in the stable transgenic plants of Col-0; pSE::Flag-4×MYC(FM)-SE. IPs were conducted with anti-Flag antibodies. Immunoblots were detected with anti-Flag or endogenous protein antibodies, respectively. HSP70 was a negative control. e, HPLC–MS analysis revealed a significant reduction of m6A global abundance in se-2 and mta versus Col-0. Data are mean ± s.d. of three independent experiments. P values for se-2 and mta versus Col-0 are 0.0214 and 0.0320, respectively. f,g, MA plots show the differentially methylated peaks in se-2 (f) and mta (g) versus Col-0. The red, blue and grey dots represent hypermethylated (log2(fold change) >2, P < 0.01), hypomethylated (log2(fold change) <−2, P < 0.01) and comparable methylated m6A peaks, respectively. h, A Venn diagram showing the overlap of hypomethylated genes from MeRIP-seq between se-2 and mta when compared with Col-0. i, IGV files of selected hypomethylated genes. IP and input are represented in red and blue, respectively. Chr., chromosome. j, Metagene profile showing m6A distribution across the gene body, with the x and y axes representing the relative position and abundance of m6A modification on transcripts, respectively. UTR, untranslated region. k, A violin plot showing peak differential methylation levels enriched in mutants relative to Col-0. The lines represent the median (dashed) and quartiles (dotted). NS, non-significant m6A peaks. P values for all comparisons are <0.0001. l, GO analysis of shared hypomethylated genes in mutants versus Col-0. FDR, false discovery rate. At least 15 independent transgenic lines were photographed (a), ten independent colonies (c) and three biological replicates (d) were tested, and representative images are shown. Hypergeometric distribution test (b and l), unpaired two-sided t-test (e), DESeq2 (f and g) and one-way ANOVA with Dunnett’s multiple comparison test (k) were used.
Fig. 2 |
Fig. 2 |. SE modulates the phase behaviours of MTC in vitro.
a, Phylogenetic tree showing that plant MTBs have extended N-terminal IDRs. b,c, Computational simulation-predicted disordered (red) and ordered (blue) regions of MTB (b) and SE (c) and their IHBs. The triangles and the right y axis show IHBs and their corresponding distances, respectively. Ave, average; MTD, methyltransferase domain; ZF, zinc finger; FRG, (F/Y)RG motif enriched region. d,e, Simulation indicating the significant enrichment of IHBs in the IDRs of MTB (d) and SE (e) in the complex. P values for H bond versus no H bond at MTB and SE are <0.0001 and 0.0002, respectively (two-sided Fisher’s exact test). f, Fine mapping of SE–MTB interaction regions. 7As-SE, alanine substitutes of all seven potential IHB donors in SE; 6As-SE, a variant resembling 7As-SE except R718. Refer to Fig. 1c for the legend. g, Simulation identifying R718 as key in the SE–MTB interaction. h, Illustration of alleles of se mutants. T-DNA, transfer DNA. i, In vitro phase behaviours of 3 μM YFP–MTB in the droplet buffer with or without 10% 1,6-HD. j, Confocal microscopy detected three non-exclusive SE–MTB co-condensate scenarios. The top, middle and bottom images show MTB aggregates encapsulated inside a SE shell, the co-aggregation and fully overlapping spherical condensates, respectively, using 1 μM of SE and 0.5 μM (top and middle) or 0.1 μM (bottom) of MTB. k, Confocal microscopy of SE–MTB in vitro co-condensation at different ratios. SE versus MTB (in μM), from top to bottom, 10 versus 0, 5 versus 0.15, 1.5 versus 0.5 and 0.5 versus 3. l, Confocal microscopy shows the dependence of SE–MTB co-condensation on the IDR1 of SE and its interaction with MTB in vitro. SE-R718A, which has compromised interaction with MTB; SEΔIDR1, which lacks the N-terminal IDR; LCDFUS-SEΔIDR1, a chimeric protein of human FUS’s LCD and SEΔIDR1. m, Time-lapse live images showing the fusion of SE–MTB co-condensates. n,o, FRAP analysis (n) and recovering curves (o) showed the mobility of SE–MTB condensates in vitro. Data are mean ± s.d. of eight independent experiments. BF, bright field (jm). At least ten colonies (f) and three (im) or eight (o) independent experiments were performed, and representative images are shown. Scale bars, 10 μm (i and m), 5 μm (jl) and 2.5 μm (n).
Fig. 3 |
Fig. 3 |. SE confers liquid-like phase behaviours to MTC in vivo.
a, FRAP assays showing that transiently expressed proteins in mesophyll cells from se-1, supplemented with or without different forms of SE variants, display distinct phase behaviours. SE-R718A, SEΔIDR1 and LCDFUS-SEΔIDR1 refer to Fig. 2l. b,c, Confocal microscopy images showing the SE-dependent MTB condensates in pollens of transgenic plants (b) and the SE and MTB co-condensates in both somatic cells and pollens (c). d, A schematic illustration of the protein extraction from plant powder for sedimentation assay. See Methods for a detailed description. eg, Immunoblots (e) and statistical analysis of sedimentation assays demonstrate the obvious enrichments of both MTA (f) and MTB (g) proteins in the insoluble fraction from se-2 versus Col-0. HSP70 was a loading control. The ratio was calculated as (soluble MTB/soluble HSP70)/(insoluble MTB/insoluble HSP70) and was normalized to the Col-0 value at 50 mM salt concentration, which is set to 1. P values at the salt concentrations of 50, 150, 300, 500 and 800 mM for MTA (f) are 0.0012, 0.024, 0.037, 0.0053 and 0.0057, and for MTB (g) are 0.014, 0.0080, 0.011, 0.0011 and 0.0047, respectively (unpaired two-sided t-test). h, Immunoblots detect the protein solubility upon chemical treatments. Ten-day-old seedlings were used. Note that both 1,6-HD and co-supply of 1,6-HD and MG-132 triggered the transition of the SE and MTB complex from a soluble form to aggregates, compared with mock and MG-132 treatment, respectively. Data are mean ± s.d. of eight (a) and three (f and g) independent experiments. At least eight independent protoplasts and cells were used (ac) or three independent experiments were performed (e and h), and representative images are shown. Scale bars 5 μm (a and b) and 2.5 μm (c).
Fig. 4 |
Fig. 4 |. The SE-dependent phase behaviour of MTC is critical for its enzymatic activity and protein stability.
a, Confocal microscopy examining the incorporation of proteins and RNA into condensates in vitro without (top) or with (bottom) 10% 1,6-HD. Scale bars, 5 μm (top) and 1 μm (bottom). b, MTA RIP qPCR showing the decreased association between MTC and RNA in se-2 versus Col-0. IPs were conducted with the nuclear fraction using an anti-MTA antibody. P values at the indicated loci are 0.036, 0.021, 0.00071, 0.085, 0.0029, 0.0033, 0.0028 and 0.46, respectively. c,d, In vitro m6A methylation assays (c) and their statistical analysis (d). P values for indicated treatments versus MTA + MTB are <0.0001, 0.99, 0.93, <0.0001 and 0.99, respectively. e, MTB shows a shorter half-life in se-1 versus Col-0, and the decay rate was hindered by MG-132 but not by PYR-41 or DMSO. The P value for Col-0 (PYR-41 versus DMSO) is 0.64, and the P values for the other treatments versus Col-0 (DMSO) are <0.0001. f,g, Immunoblot assays of indicated immunoprecipitates did not detect poly(Ubi)-conjugated forms of MTB in planta. IPs were conducted using anti-MTB-conjugated (f) or GFP-trap beads (g). IgG-IP used as a negative control. Immunoblots were performed with the indicated antibodies. h, Y2H assays showing the interactions between MTB and 20S proteasome subunits. Refer to Fig. 1c for the legend. il, The quantitive analysis of decay rates (for MTB (i) and for SE and variants (j)) and immunoblots (for MTB (k) and SE and variants (l)) of 20S proteasome reconstitution assays shows that pre-incubation of MTB with mCherry-tagged SE and LCDFUS-SEΔIDR1, but not SEΔIDR1 or SE-R718A, could mutually protect each other from degradation. The notations inside and outside the brackets represent detected and co-incubated proteins, respectively. In i, the P values for MTB (SEΔIDR1) and MTB (SE-R718A) versus MTB (DMSO) are 0.0003 and 0.0016, respectively, and are <0.0001 for the rest of the comparisons. In j, the P values for SE (MTB), LCDFUS-SEΔIDR1 (MTB), SE-R718A (MTB), SEΔIDR1 (MTB), SEΔIDR1 (mock), SE-R718A (mock) and SE (mock) versus LCDFUS-SEΔIDR1 (mock) are <0.0001, <0.0001, 0.82, 1.00, 0.018, 0.033 and 0.0010, respectively. m,n, Immunoblots showing that MTB accumulates in pag1–2 (m) and pbe1 (n) versus Col-0, where the amount was arbitrarily assigned a value of 1. MTB was detected with endogenous protein antibodies. HSP70 was an internal control. For c, d and il, SE-R718A, SEΔIDR1 and LCDFUS-SEΔIDR1 refer to Fig. 2l. Data are mean ± s.d. of three independent experiments in b, e, i and j. At least three independent experiments were performed in a, c, f, g and kn, and ten colonies were detected in h, with representative images shown. P values are from an unpaired two-sided t-test (b) and one-way ANOVA analysis with Tukey’s multiple comparisons test (d, e, i and j). Only the comparisons with significance (d) and the Col-0 (DMSO) (e), MTB (DMSO) (i) and LCDFUS-SEΔIDR1 (mock) (j) groups are shown. P values for the remaining comparisons are presented in Supplementary Table 4.
Fig. 5 |
Fig. 5 |. Proper phase behaviours of SE and MTB are required for protein accumulation and plant development.
ac, Immunoblots (a) and images of adult (b) and 3-week-old (c) plants indicating the importance of both SE–MTB interaction and liquid-like properties for plant development and protein accumulation in vivo. Immunoblots were performed with indicated endogenous protein antibodies. Actin was a loading control. Triangles indicate the Flag-tagged (orange) and endogenous protein (green) bands, respectively. Scale bars, 5 cm (b) and 2 cm (c). Three biological replicates of immunoblots were tested, at least ten independent transgenic lines were photographed and representative images are shown. d, MeRIP qPCR showing the m6A levels of selected genes in different complementation plants versus Col-0. Data are mean ± s.d. of three independent experiments. P values for all detected genes at se-1, SE-R718A, SEΔIDR1, mta and mtb versus Col-0 are <0.0001; at 6As-SE versus Col-0 are 0.14, 0.83, 0.99, 0.41 and 0.88; and at LCDFUS-SEΔIDR1 versus Col-0 are 0.32, 0.52, 0.73, 1.00 and 0.89, respectively, by two-way ANOVA analysis with Dunnett’s multiple comparisons test.
Fig. 6 |
Fig. 6 |. MTC facilitates miRNA biogenesis via m6A-dependent and m6A-independent means.
a, Exomepeak2 and winscore algorithms identified largely overlapping methylated pri-miRNAs in se-2. b, IGV files of the selected methylated pri-miRNAs in se-2. The dark blue colour region within the light blue horizontal line represents the pre-miRNA within the pri-miRNA. The x axis shows chromosomal locations, and the y axis shows normalized reads. Chr, chromosome. c, MeRIP RT–qPCR assays validated the reduction of m6A levels on pri-miRNAs in se-2 and mta versus Col-0. The P value for se-2 versus Col-0 at pri-miR172B is 0.0032 and P values are <0.0001 for other comparisons. d, A metagene profile portraying the average m6A distribution across pri-miRNAs. The x axis shows the relative position, and the y axis shows m6A abundance. The dark blue colour region within the light horizontal line represents the pre-miRNA within the pri-miRNA. e, A violin plot illustrating that the levels of miRNAs derived from methylated pri-miRNAs were significantly reduced versus those derived from unmethylated pri-miRNAs in mutants versus Col-0. The lines represent the median and quartiles. P values for m6A(−) versus m6A(+) at se-2 and mta are <0.0001 and 0.13, respectively. f,g, ChIP qPCR assays show that MTA and MTB acted upstream of SE in tested MIRNA loci. ChIP assays were performed with anti-Flag (f) and anti-SE (g) antibodies. In f, the P values for Col-0; Flag-MTB and se-1; Flag-MTA versus Col-0; Flag-MTA at MIR156A are 0.084 and 0.0001; at MIR156C are 1.00 and <0.0001; at MIR162A are 0.070 and 0.026; at MIR166A are 0.56 and 0.0022; at MIR171C are 0.47 and <0.0001; and at MIR172B are 0.053 and <0.0001, respectively. In g, the P values for mta and mtb versus Col-0 are 0.0005 and 0.0022, for se-2 versus Col-0 at MIR162A is 0.0014 and for the rest comparisons are <0.0001. hk, EMSA assays (for MTA (h) and MTB (j)) and the binding curves (for MTA (i) and MTB (k)) show that MTA and MTB possess strong binding affinities to structured pri-miRNAs. l,m, EMSA assays show that HYL1 could sequester structured pri-miRNA from MTA (l) and MTB (m). The numbers on top of gels indicated the amount of recombinant HYL1 (nM) added to 20 nM MTA and MTB. n, H3-RIP qPCR assays show the increased retention of stem-loop fragments of tested pri-miRNAs along MIRNA loci in the mutants versus Col-0. A, B and C refer to 5’′ flanking, pre-miRNA and 3′ flanking sequences of pri-miRNA, respectively. P values for A versus B, B versus C and A versus C at Col-0 are 0.038, 0.014 and 0.99; at mta are 0.98, 0.99 and 0.99; at mtb are 0.80, 0.99 and 0.76; at se-2 are 0.86, 0.93 and 0.99; and at IgG control are 0.99, 0.61 and 0.83, respectively. Data are mean ± s.d. of three independent experiments in c, f, g, i, k and n. At least three independent experiments were performed, and representative images are shown in h, j, l and m. P values are from unpaired two-sided t-tests (e) and two-way ANOVA analysis with Dunnett’s (c, f and g) or Tukey’s (n) multiple comparisons test.
Fig. 7 |
Fig. 7 |. The m6A readers promote pri-miRNA processing.
a, RT–qPCR assays detected the accumulation of tested pri-miRNAs in the nucleoplasm fraction of m6A writer mutants versus Col-0. UBQ10 was an internal control for normalization. P values for mta, mtb and se-2 versus Col-0 at pri-miR163B are 0.019, 0.013 and 0.0047; at pri-miR166A are 0.035, 0.0061 and 0.0091; at pri-miR166B are 0.011, 0.011 and 0.017; at pri-miR168A are 0.013, 0.0079 and 0.0038; and at pri-miR402 are 0.015, 0.011 and 0.020, respectively. b, Immunoblots of fractionation assays using 3-week-old pECT2::3xHA-ECT2 plants. ECT2 was detected by an anti-HA antibody. UDP–glucose pyrophosphorylase (UGPase) and Histone 3 (H3) were used as cytoplasmic (Cyt) and nuclear (Nuc) markers, respectively. Tot, total extraction. c, The predicted CRM1 (exportin 1)-dependent nuclear export signal (NES) peptide in ECT2. d, Microscopic images show the nuclear localization of ECT2–mCherry signals in 5-d-old transgenic plants upon CRM1 inhibitor leptomycin B treatment. Ethanol was a negative control. Scale bar, 10 μm. e, Co-IP assays validated the interaction between ECT2 and microprocessor key components. IPs were conducted with pECT2::3xHA-ECT2 plants using HA antibodies. Immunoblots were detected with the indicated antibodies. HSP70 was a negative control. f, RT–qPCR assays show the decreased levels of tested miRNAs in m6A reader mutants versus Col-0, with se-2 serving as a control. U6 was used as an internal control for normalization. P values for ect2 and ect2; ect3; ect4 versus Col-0 at miR156 are 0.72 and 0.034; at miR159 are 0.060 and 0.0055; at miR163 are 0.038 and <0.0001; at miR164 are 0.79 and 0.0007; at miR166 are both <0.0001; at miR171 are 0.78 and 0.0062; and at miR319 are 0.079 and <0.0001, respectively. P values for se-2 versus Col-0 are <0.0001 at all detected miRNAs. g, The binding curve of the affinity of ECT2 to m6A(+) ssRNA. h, A schematic illustration of the strategy to synthesize m6A-modified structured RNAs. T7 in vitro transcribed RNA was used for end repair, followed by ligation to a methylated oligonucleotide. The products were labelled with P and purified before in vitro folding. An unmethylated control was also synthesized using T7 in vitro transcription with an identical sequence. il, EMSA assays (for ECT2 (i) and ECT2-W521A (k)) and their binding curves (for ECT2 (j) and ECT2-W521A (l)) show that ECT2 and ECT2-W521A, a variant lacking of m6A recognition, both possessed a binding affinity to m6A(−) structured pri-miRNAs and the binding affinity stimulated by the presence of m6A on RNAs could only be found by ECT2. App, apparent. Data are mean ± s.d. of three independent experiments in a, f, g, j and l. At least three independent experiments were performed, and representative images are shown in b, d, e, i and k. P values are from two-way ANOVA analysis with Dunnett’s multiple comparisons test (a and f).
Fig. 8 |
Fig. 8 |. m6A modification promotes miRNA production in in vitro microprocessor reconstitution assays and a proposed model for reciprocal regulation of m6A modification and miRNA production machineries.
a,b, In vitro microprocessor assays (a) and statistical analysis (b) of processing efficiency showed that appropriate concentrations of ECT2 were essential for effective promotion of the processing of m6A-harboured pri-miRNAs compared with their m6A-depleted counterparts. Data are mean ± s.d. of three independent experiments performed, and representative images are shown. The P value for m6A(+) versus m6A(−) without ECT2 is 0.93, and with SE and 3, 6, 12, 25, 50 and 100 nM of ECT2 are 0.0058, 0.0017, 0.0013, 0.0032, 0.048 and 0.060, respectively. c, A proposed model of cross-regulation between m6A modification and miRNA production machineries. Top left: MTB can co-condense with SE droplets, thereby maintaining solubility and enzymatic activity in a WT condition. Bottom left: MTB may undergo misfolding, leading to either aggregation or degradation in se mutants. Top right: MTC can reciprocally recruit microprocessor to MIRNA loci to engage in co-transcriptional processing of pri-miRNAs. Concurrently, the readers interact with both the basal or flanking region of methylated pri-miRNAs and microprocessor to facilitate processing. Bottom right: the absence of writers results in the impairment of both co-transcriptional processing and methylation of pri-miRNAs. Additionally, readers occupy structural regions within pri-miRNAs, consequently obstructing downstream processing events.

References

    1. Alberti S & Hyman AA Biomolecular condensates at the nexus of cellular stress, protein aggregation disease and ageing. Nat. Rev. Mol. Cell Biol. 22, 196–213 (2021). - PubMed
    1. Li PB et al. Phase transitions in the assembly of multivalent signalling proteins. Nature 483, 336–340 (2012). - PMC - PubMed
    1. Peeples W & Rosen MK Mechanistic dissection of increased enzymatic rate in a phase-separated compartment. Nat. Chem. Biol. 17, 693–702 (2021). - PMC - PubMed
    1. Chong S et al. Imaging dynamic and selective low-complexity domain interactions that control gene transcription. Science 361, eaar2555 (2018). - PMC - PubMed
    1. Wei MT et al. Nucleated transcriptional condensates amplify gene expression. Nat. Cell Biol. 22, 1187–1196 (2020). - PubMed

MeSH terms

LinkOut - more resources