Comparative Study
. 2025 Jan;39(1):29-41.
doi: 10.1038/s41375-024-02400-w. Epub 2024 Oct 29.

Comparative small molecule screening of primary human acute leukemias, engineered human leukemia and leukemia cell lines

Affiliations
Comparative Study

Comparative small molecule screening of primary human acute leukemias, engineered human leukemia and leukemia cell lines

Safia Safa-Tahar-Henni et al. Leukemia. 2025 Jan.

Abstract

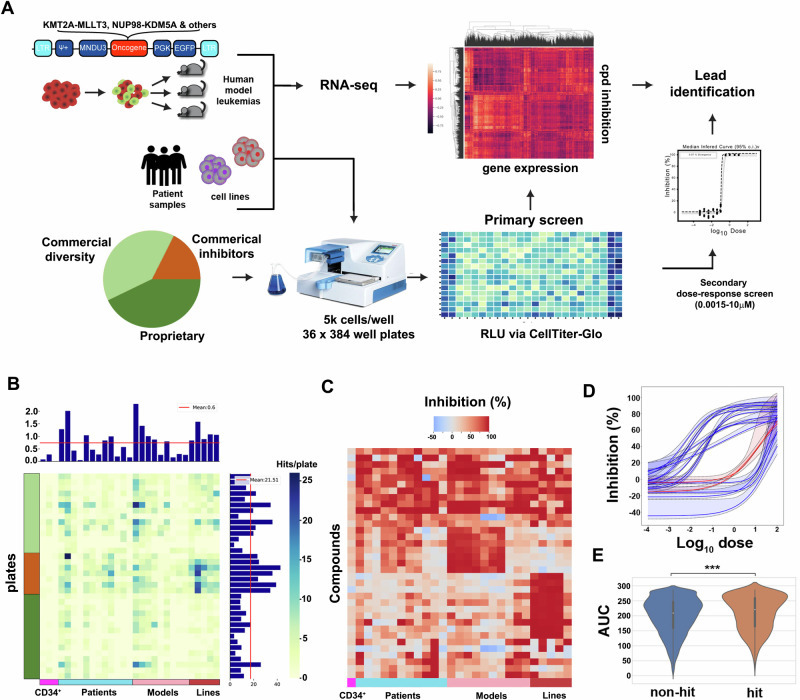
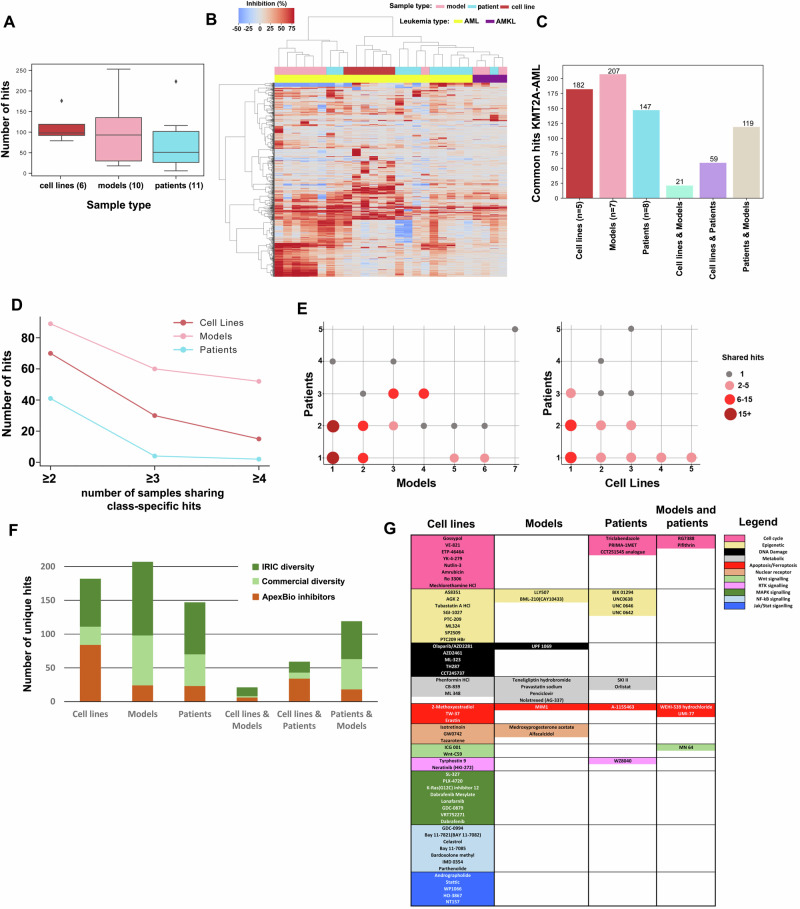
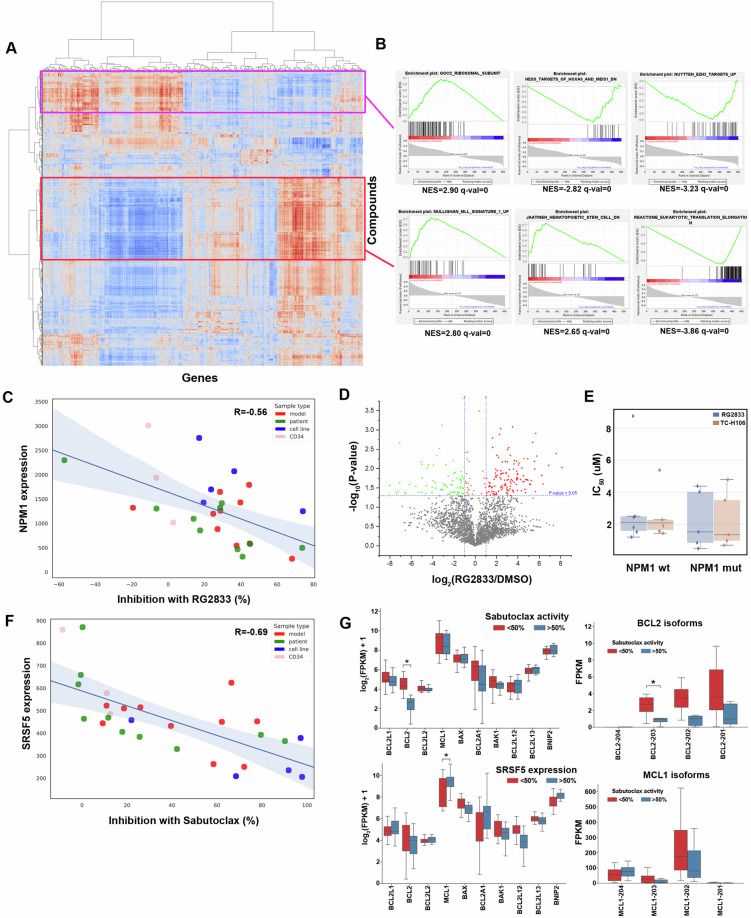
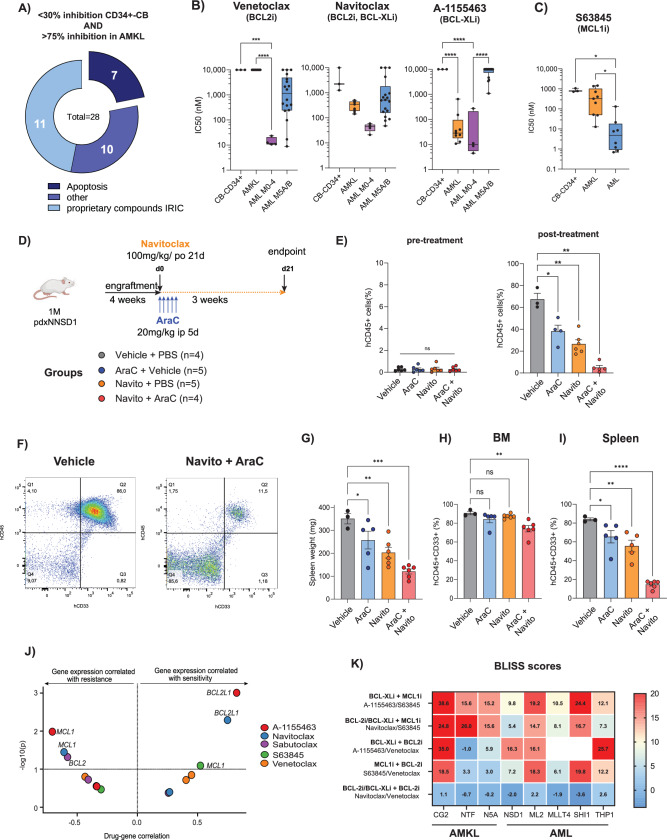
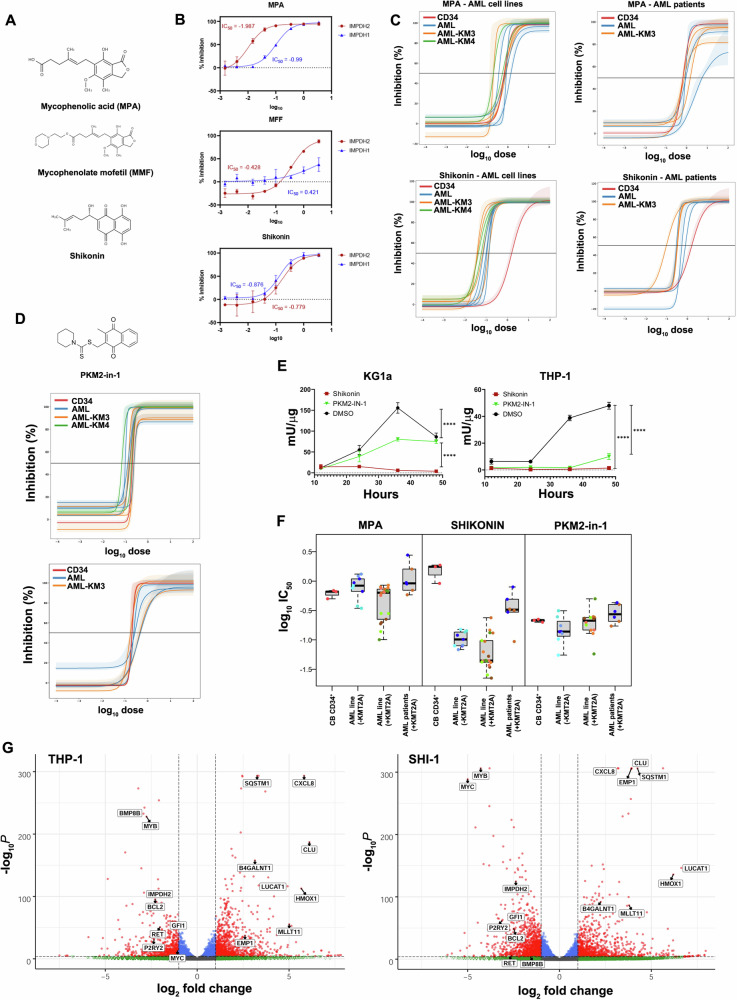
Targeted therapeutics for high-risk cancers remain an unmet medical need. Here we report the results of a large-scale screen of over 11,000 molecules for their ability to inhibit the survival and growth in vitro of human leukemic cells from multiple sources including patient samples, de novo generated human leukemia models, and established human leukemic cell lines. The responses of cells from de novo models were most similar to those of patient samples, both of which showed striking differences from the cell-line responses. Analysis of differences in subtype-specific therapeutic vulnerabilities made possible by the scale of this screen enabled the identification of new specific modulators of apoptosis, while also highlighting the complex polypharmacology of anti-leukemic small molecules such as shikonin. These findings introduce a new platform for uncovering new therapeutic options for high-risk human leukemia, in addition to reinforcing the importance of the test sample choice for effective drug discovery.


Conflict of interest statement

Competing interests: The authors declare no competing interests.

Figures

Fig. 1
Fig. 1. High-throughput screening of AML/AMKL leukemias.
A Workflow of the high-throughput chemical screening of 11,142 compounds at a single dose. After incubation, the measurement of luminescence by Cell Titer Glo (RLU gradient of the heatmap) is obtained. This was followed by a secondary dose-response screen to validate identified hits. Selected samples (n = 28) were profiled by RNA-seq. B The heatmap gradient representing the number of total hits. The histogram on the x-axis corresponds to the number of hit per samples. The histogram on the y-axis corresponds to the number of hit per plates. Plates with proprietary compounds are shown in light green, commercial inhibitors from APExBIO are colour in orange and commercial diversity compounds in dark green. C Heatmap of selected compounds show heterogeneous response between sample types. The C-score (corrected % inhibition) is annotated by the color gradient. D Dose response curves of proprietary compound UMxxxx808 showing responses of CB CD34+ cells (red lines) and AML patients’ cells (blue lines). The curves were obtained by a Bayesian inference method where the solid line depicts the median curve with a shaded 95% C.I. E Comparison of AUC from hits identified in common with Beat AML. 95 compounds in common between Beat AML and the commercial inhibitors with AUC values split between hit and non-hit. The difference between non-hit vs hit is calculated by a t-test independent with Bonferroni correction (P = 7.294 × 10-13 stat = −7.176).
Fig. 2
Fig. 2. Differences in drug discovery using patient, model, and cell line AML cells.
A Number of hits per sample type where colouring represents: leukemia cell lines (red), human model leukemias (pink), patient leukemia samples (blue), with the number of samples analyzed shown in brackets. B Hierarchical clustering heatmap (Ward linkage) is shown based on the C-score values for all compounds that were hits across all samples. The heatmap is annotated along the top two rows with a colour code for both samples types and leukemia types. C Bar graphs are shown that depict the number of hits found to be unique to each sample types or hits in common between sample types. Sample types and the number analysed are shown along the x-axis with the number of hits indicated at the top of each bar graph. D Line graph showing the number of hits unique to each sample type but common to at least 2, 3, or 4 samples of that type. E Shared hits between patients and models (left) and patients and cell lines (right). The y-axis represents the number of AML patient samples and the x-axis is the number of AML human models (left) and AML cell lines (right). The number of common hits between each set of samples (e.g. between 3 models and 3 patients) is indicated by circles representing different numeric ranges. F Coloured bar graph segments indicate the source of unique hits across different sample types shown in C. G Columns show the unique hits from the APExBIO compound library identified for each sample class labelled on top. Colour coding legend on the right indicates the target/pathway affected by each individual compound based on the manual annotation of published activities.
Fig. 3
Fig. 3. Correlation screen response and expression data.
A Pearson correlation between C-score hits and FPKM values of the 500 most variable genes across all samples. Clustering on compounds (row) and gene (columns) is represented by Ward linkage and correlations are coloured from negatively (blue) to positively correlated (red). Two clusters of compounds are identified by a purple and red box were used for GSEA analysis. B The average C-score values for all 500 genes for the compounds in the coloured boxes in A were calculated and used to generate a ranked list for GSEA analysis. Selected pathways with statistical enrichment highlighted by GSEA are shown. C Scatterplot showing RG2833 C-score values plotted against NPM1 expression (FPKM) with a linear regression model fit with the 95% CI also shown. D A volcano plot from an acetylome analysis of NOMO1 cells treated for 6 h with RG2833 showing peptides which are significantly decreased (green) or increased (red) in acetylation. E boxplots show the IC50 values for RG2833 and TC-H106 for primary AML specimens with either a wt NPM1 gene (NPM1 wt, n = 5) or a tetranucleotide insertion in exon 12 (NPM1 mut, n = 5). All AML samples had blast percentages >90% except two NPM1 mutated samples (50% & 60%) that also exhibited higher IC50 values F Scatterplot showing Sabutoclax C-scores plotted against SRFS5 expression (FPKM) with a linear regression model fit with the 95% CI shown. G Sabutoclax activity versus BCL2/MCL1 expression and isoform abundance. All leukemia samples were binned into Sabutoclax responsive samples (red; C-score >median response across all samples) and unresponsive samples (blue; C-score < median response across all samples) for top row and bottom right panels. Bottom left panel shows all samples binned based on SRSF5 expression (red or blue for < median or > median across all samples respectively). The panels in the first column show the expression level of BCL2 family members and the panels in the second column, show the expression level of BCL2 (top) or MCL1 (bottom) isoforms. *=0.05 where P-values were calculated using students t-test.
Fig. 4
Fig. 4. Subtype-specific sensitivities of AML cells to inducers of apoptosis.
A An Overview of selected compounds that fulfilled threshold criteria for CB-CD34+ and were considered a hit for at least one AMKL sample. Drugs were grouped by pathway. Drug targets or modes of action are unknown for proprietary compounds IRIC. B IC50 values were inferred from dose-response experiments for venetoclax, navitoclax and A-1155463 with three independent CB-CD34+ pools together with nine models of AMKL as well as 22 models of AML. Samples were grouped by FAB classification where available. C IC50 values were inferred from dose-response experiments for S63845 with three independent CB-CD34+ pools together with nine models of AMKL as well as eight models of AML. D Schematic overview of experimental design of combinatory treatments with navitoclax and cytarabine (AraC) of mice that were transplanted with a pdx of NNSD1. E Percentage of leukemic blasts in peripheral blood (%hCD45+) before (left graph) or after completion of drug treatment (right). F Representative flow cytometry profiles of spleens of vehicle-treated mice versus mice treated with the combination of navitoclax and cytarabine (Navito+AraC). G Spleen weight, H infiltration of bone marrow (BM) and I spleen was assessed in transplanted mice after 3 weeks of indicated treatments. J Gene expression of AML and AMKL samples that were treated with selected compounds was correlated with drug response (IC50 values). K Bliss synergy scores of indicated drug combinations in AMKL and AML xenografts, one synthetic model with a KMT2A::AFDN fusion (MLLT4), as well as in cell lines (ML-2, KMT2A::AFDN fusion; SHI1, KMT2A::AFDN fusion; THP1, KMT2A::MLLT3 fusion). The synergy scores were calculated using the BLISS reference model in SynergyFinder. Values are the average of two experiments for synthetic models and PDX and n = 1 for cell lines. [60]. P-values: * <0.05, ** <0.005, *** <0.001, **** <0.0001. CB-CD34+, CD34+ cord blood; AMKL, acute megakaryoblastic leukemia; AML, acute myeloid leukemia; NNSD1, NUP98::NSD1; AraC, cytarabine; CG2, CBFA2T3::GLIS2; NTF, NUP98::BPTF; N5A, NUP98::KDM5A.
Fig. 5
Fig. 5. The complex polypharmacology of shikonin.
A Molecular structures of two known IMPDH inhibitors, Mycophenolic acid (MPA), Mycophenolate mofetil (MFF) along with Shikonin. B Dose-response curves obtained for IMPDH1 (blue) and IMPDH2 (red) using purified enzymes and the three inhibitors in A are shown along with corresponding IC50 values for each enzyme. C Cell-based dose-response assays for MPA (top panels) and shikonin (bottom panels) were performed using AML cell lines (left panels) or AML patient samples (right panels). For both cell lines and patient samples, those containing either KMT2A::MLLT3 (KM3) or KMT2A::MLLT4 (KM4) fusions are coloured in orange/green respectively. Cord blood CD34+ cells were used as controls to show selectivity and are shown in red. D Molecular structure of PKM2-in-1 inhibitor (top) and cell-based dose-response assays (bottom) are shown with colouring as in C, using cell lines (top panel) and AML patient samples (bottom panel). E The inhibition of pyruvate kinase activity was assessed in a cell-based assay where two AML cell lines were treated with either inhibitor (shikonin or PKM2-in-1) or DMSO (control) prior to cell lysis and pyruvate kinase assay measurements performed in triplicate at the indicated time points. **** indicates a p-value of 0.0001 for difference between curves for treatment vs controls at 36 h (3rd time point). F A summary of IC50 values for MPA, shikonin and PKM2-in-1 inhibitors from all cell-based dose-response assays are shown. Identical colouring of dots indicates the IC50 values from replicates of each sample tested. G Volcano plots of differentially expressed genes as determined by DESeq2 from RNA-seq experiments performed on THP-1 cells (left) or SHI-1 cells (right) after 16 h of exposure to shikonin are shown.

References

    1. Short NJ, Rytting ME, Cortes JE. Acute myeloid leukaemia. Lancet. 2018;392:593–606. - PMC - PubMed
    1. Masetti R, Pigazzi M, Togni M, Astolfi A, Indio V, Manara E, et al. CBFA2T3-GLIS2 fusion transcript is a novel common feature in pediatric, cytogenetically normal AML, not restricted to FAB M7 subtype. Blood. 2013;121:3469–72. - PubMed
    1. Umeda M, Ma J, Westover T, Ni Y, Song G, Maciaszek JL, et al. A new genomic framework to categorize pediatric acute myeloid leukemia. Nat Genet. 2024;56:281–93. - PMC - PubMed
    1. Bolouri H, Farrar JE, Triche T Jr, Ries RE, Lim EL, Alonzo TA, et al. The molecular landscape of pediatric acute myeloid leukemia reveals recurrent structural alterations and age-specific mutational interactions. Nat Med. 2018;24:103–12. - PMC - PubMed
    1. Ley TJ, Mardis ER, Ding L, Fulton B, McLellan MD, Chen K, et al. DNA sequencing of a cytogenetically normal acute myeloid leukaemia genome. Nature. 2008;456:66–72. - PMC - PubMed

Publication types

MeSH terms

Substances

LinkOut - more resources