. 2024 Oct 29;15(1):9339.
doi: 10.1038/s41467-024-53566-x.

Microbial dynamics and pulmonary immune responses in COVID-19 secondary bacterial pneumonia

Collaborators, Affiliations

Microbial dynamics and pulmonary immune responses in COVID-19 secondary bacterial pneumonia

Natasha Spottiswoode et al. Nat Commun. .

Abstract

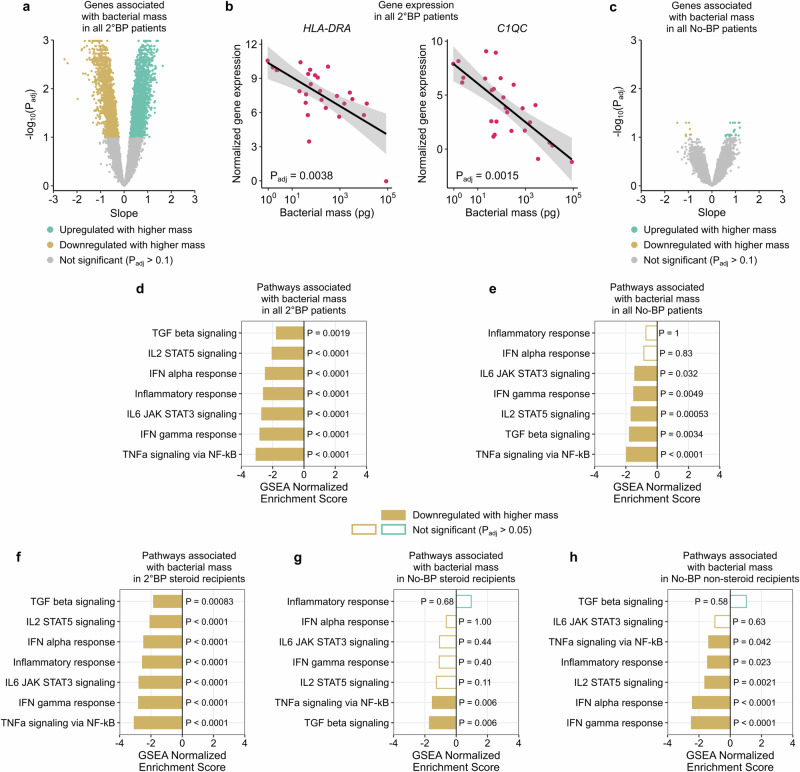
Secondary bacterial pneumonia (2°BP) is associated with significant morbidity following respiratory viral infection, yet remains incompletely understood. In a prospective cohort of 112 critically ill adults intubated for COVID-19, we comparatively assess longitudinal airway microbiome dynamics and the pulmonary transcriptome of patients who developed 2°BP versus controls who did not. We find that 2°BP is significantly associated with both mortality and corticosteroid treatment. The pulmonary microbiome in 2°BP is characterized by increased bacterial RNA mass and dominance of culture-confirmed pathogens, detectable days prior to 2°BP clinical diagnosis, and frequently also present in nasal swabs. Assessment of the pulmonary transcriptome reveals suppressed TNFα signaling in patients with 2°BP, and sensitivity analyses suggest this finding is mediated by corticosteroid treatment. Further, we find that increased bacterial RNA mass correlates with reduced expression of innate and adaptive immunity genes in both 2°BP patients and controls. Taken together, our findings provide fresh insights into the microbial dynamics and host immune features of COVID-19-associated 2°BP, and suggest that suppressed immune signaling, potentially mediated by corticosteroid treatment, permits expansion of opportunistic bacterial pathogens.


Conflict of interest statement

The authors declare no competing interests.

Figures

Fig. 1
Fig. 1. Study overview.
a Patient flow after recruitment within 48 hours of admission. *Intubated for reasons other than COVID-19 or transferred to an outside hospital within 48 h of recruitment. b Pathogens detected by tracheal aspirate (TA) bacterial culture at time of secondary bacterial pneumonia (2°BP) diagnosis. Three patients had >1 pathogen detected. Created with BioRender.com released under a Creative Commons Attribution-NonCommercial-NoDerivs 4.0 International license (https://creativecommons.org/licenses/by-nc-nd/4.0/deed.en).
Fig. 2
Fig. 2. Lung microbiome differences in patients with or without 2°BP.
a Bacterial RNA mass and (b) alpha diversity measured by Shannon Diversity Index (SDI) in COVID-19 patients with 2°BP (red, N = 27) or No-BP (blue, N = 29), measured in the 2°BP TA sample closest to the date of clinical diagnosis, or No-BP patient samples obtained after a similar number of days post-intubation. c SDI measured in the 2°BP sample in which the culture-confirmed pathogen was top ranked by abundance in the lung microbiome (N = 27 patients with 2°BP, 29 with No-BP). d Compositional differences in the lung microbiome of 2°BP (red) versus No-BP (blue) patients based on Bray-Curtis dissimilarity index and the PERMANOVA test with 1000 permutations, visualized with a non-metric multidimensional scaling (NMDS) plot. e Exemplary abundance plots from two 2°BP patients demonstrating the abundance, measured in reads per million (rpM, y axis) for each of the top 15 ranked bacterial taxa in the lung microbiome (x axis). Culture-confirmed 2°BP pathogen highlighted in red. f Bar plot showing the number of 2°BP patients (y axis) in which a specific rank by rpM of the culture-confirmed pathogen (x axis) was observed within 7 days of clinical diagnosis. g Heatmap showing the number of cases in which specific bacterial genera were detected as the most abundant in the bacterial lung microbiome, with the top 15 genera plotted. Staphylococcus is included at the species level given the intrinsic differences in potential pathogenicity between S. aureus and S. epidermidis. h Differentially abundant microbial genera in the lung microbiome of 2°BP versus No-BP patients. P values for (ac) calculated by two-sided Wilcoxon test. Boxes in (ac) show median and 25th–75th percentiles, with whiskers from min to max. P value in (d) calculated by two-sided PERMANOVA analysis. In (h), bacterial taxa with an adjusted P < 0.001 are plotted. A positive log fold change indicates enrichment for microbes in patients with 2°BP as compared to No-BP. P values in (h) are calculated by adjusted Wald’s test. Source data for (ac, eh) provided in the Source Data file.
Fig. 3
Fig. 3. Dynamics of 2°BP pathogen over time relative to the date of clinical diagnosis highlighting examples of unique pathogen trajectories.
The top row includes plots of genus level 2°BP pathogen rank based on bacterial reads per million (rpM) in the lung microbiome for each of four pathogen trajectories (expansion, reduction, persistence and resistance). The middle row includes plots of pathogen mass. The bottom row consists of plots of pathogen mass normalized to the total RNA mass of sample. Days relative to 2°BP clinical diagnosis are plotted on the X axis. Days during which patient received antibiotics to which 2°BP pathogen was phenotypically susceptible (light gray bar) or resistant (dark gray bar) are plotted below. The patient ID and pathogen genus are listed above each plot. Open circles denote samples in which the pathogen was not detected by metatranscriptomics.
Fig. 4
Fig. 4. Nasal microbiome differences in patients with or without 2°BP and relationship to the lung microbiome.
a Nasal swab (NS) bacterial RNA mass or (b) Shannon Diversity Index (SDI) in COVID-19 patients with 2°BP (purple, N = 15) or No-BP (pink, N = 20). P values based on two-sided Wilcoxon tests. c Bar plot showing the number of 2°BP patients (y axis) in which a specific rank by reads per million (rpM) of the culture-confirmed pathogen (x axis) was observed within 7 days of clinical diagnosis. d Stacked bar plots highlighting the taxonomic composition of paired NS and tracheal aspirate (TA) samples from 2°BP patients (top) and No-BP patients (bottom). Bacterial taxa present at <0.5% relative abundance across all samples were included in the “other” category, except if the microbe had been cultured as a 2°BP pathogen. Spearman’s rho tests were performed to assess taxonomic concordance between paired samples from each patient. IQR, interquartile range. Boxes in (a, b) show median and 25th–75th percentiles, with whiskers from min to max. Source data for (ac) provided in the Source Data file.
Fig. 5
Fig. 5. Antimicrobial resistance (AMR) genes in the lung and nasal microbiome of 2°BP patients.
AMR genes, grouped and colored by class, detected in tracheal aspirate (TA) +/- matched nasal swab (NS) samples. Shading corresponds to the fraction of samples, collected within 7 days of 2°BP, in which the AMR gene was detected.
Fig. 6
Fig. 6. Lower respiratory tract gene expression differs based on 2°BP status and is influenced by corticosteroid treatment.
a Volcano plot of differentially expressed genes between 2°BP (N = 27) and No-BP (N = 29). b Bar plot of GSEA analysis showing the Hallmark pathways that are downregulated in 2°BP patients. c Bar plot of GSEA analysis limited to steroid recipients (N = 25 2°BP patients; N = 19 No-BP patients) showing the same Hallmark pathways as in (b). In the analyses in (ac), we controlled for SARS-CoV-2 viral load in our differential expression analysis. d Bar plot of GSEA analysis demonstrating Hallmark pathways associated with days of corticosteroid treatment in 2°BP patients. e Bar plot of GSEA analysis demonstrating Hallmark pathways associated with days of corticosteroid treatment in No-BP patients. The two-sided P values in (a) were calculated using linear modeling (limma package) and Benjamini-Hochberg correction. The two-sided P values in (be) were calculated using the fgsea package and Benjamini-Hochberg correction.
Fig. 7
Fig. 7. Lower respiratory tract immune gene expression inversely correlates with bacterial mass.
a Volcano plots of genes that are associated with bacterial mass in 2°BP patients (N = 27). b Scatter plots showing the relationship between HLA-DRA and C1QC gene expression and bacterial RNA mass in 2°BP patients. The black lines indicate the linear regression fit, and the ribbons indicate the 95% confidence interval of the fits. c Volcano plots of genes associated with bacterial mass in No-BP patients (N = 29). Bar plot showing Hallmark pathways associated with bacterial mass in (d) all 2°BP patients and (e) all No-BP patients. Hallmark pathways associated with bacterial mass in (f) 2°BP and (g) No-BP patients, but limited to only steroid recipients (N = 25 and N = 19; respectively). h Hallmark pathways associated with bacterial mass in the 10 No-BP patients who did not receive steroids prior to sample collection. The two-sided P values in (a, c) were calculated using linear modeling (limma package) and Benjamini-Hochberg correction. The two-sided P values in (dh) were calculated using the fgsea package and Benjamini-Hochberg correction.

References

    1. Luyt, C. E. et al. Ventilator-associated pneumonia in patients with SARS-CoV-2-associated acute respiratory distress syndrome requiring ECMO: a retrospective cohort study. Ann. Intensive Care10, 158 (2020). - PMC - PubMed
    1. Bardi, T. et al. Nosocomial infections associated to COVID-19 in the intensive care unit: clinical characteristics and outcome. Eur. J. Clin. Microbiol. Infect. Dis.40, 495–502 (2021). - PMC - PubMed
    1. Maes, M. et al. Ventilator-associated pneumonia in critically ill patients with COVID-19. Critic. Care25, 25 (2021). - PMC - PubMed
    1. Sogaard, K. K. et al. Community-acquired and hospital-acquired respiratory tract infection and bloodstream infection in patients hospitalized with COVID-19 pneumonia. J. Intensive Care9, 10 (2021). - PMC - PubMed
    1. Rouze, A. et al. Relationship between SARS-CoV-2 infection and the incidence of ventilator-associated lower respiratory tract infections: a European multicenter cohort study. Intensive Care Med.47, 188–198 (2021). - PMC - PubMed

Publication types

MeSH terms