. 2024 Oct 29;15(1):9347.
doi: 10.1038/s41467-024-53558-x.

AAA+ ATPase chaperone p97/VCPFAF2 governs basal pexophagy

Affiliations

AAA+ ATPase chaperone p97/VCPFAF2 governs basal pexophagy

Fumika Koyano et al. Nat Commun. .

Abstract

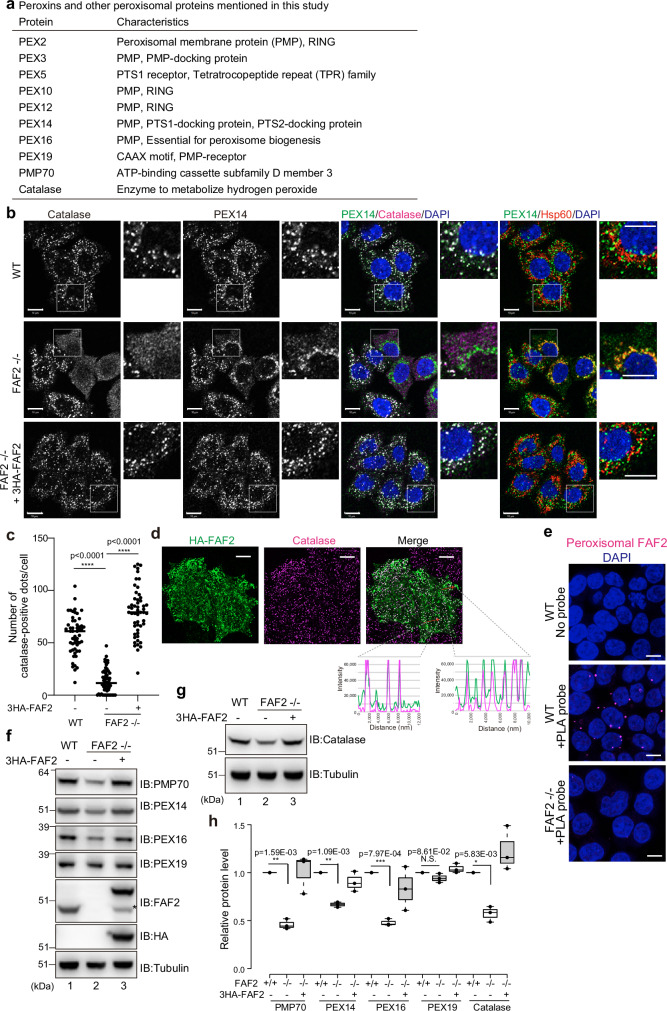
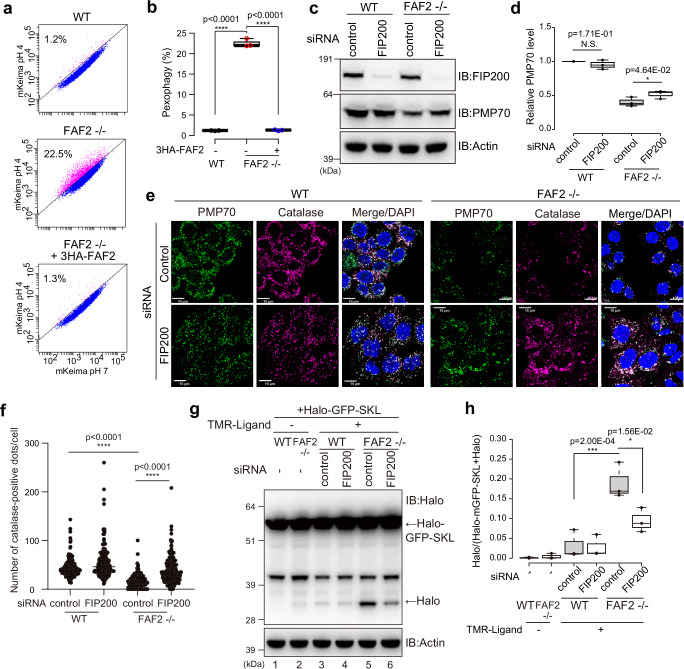
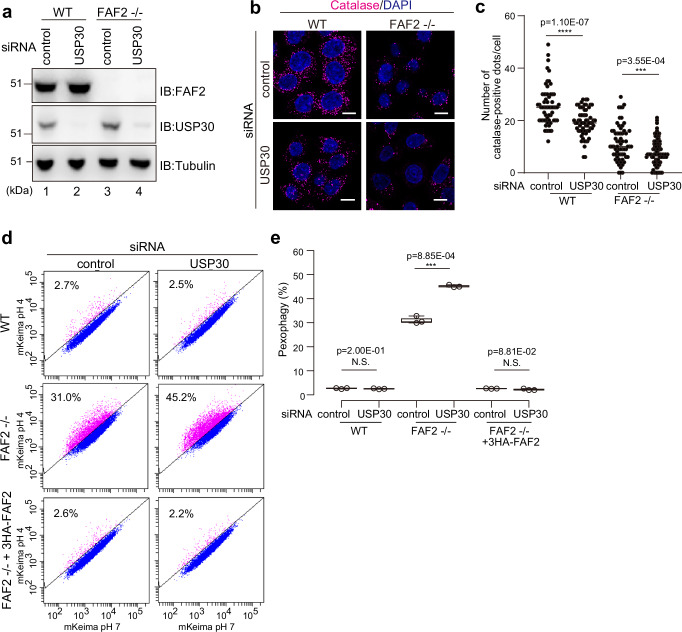
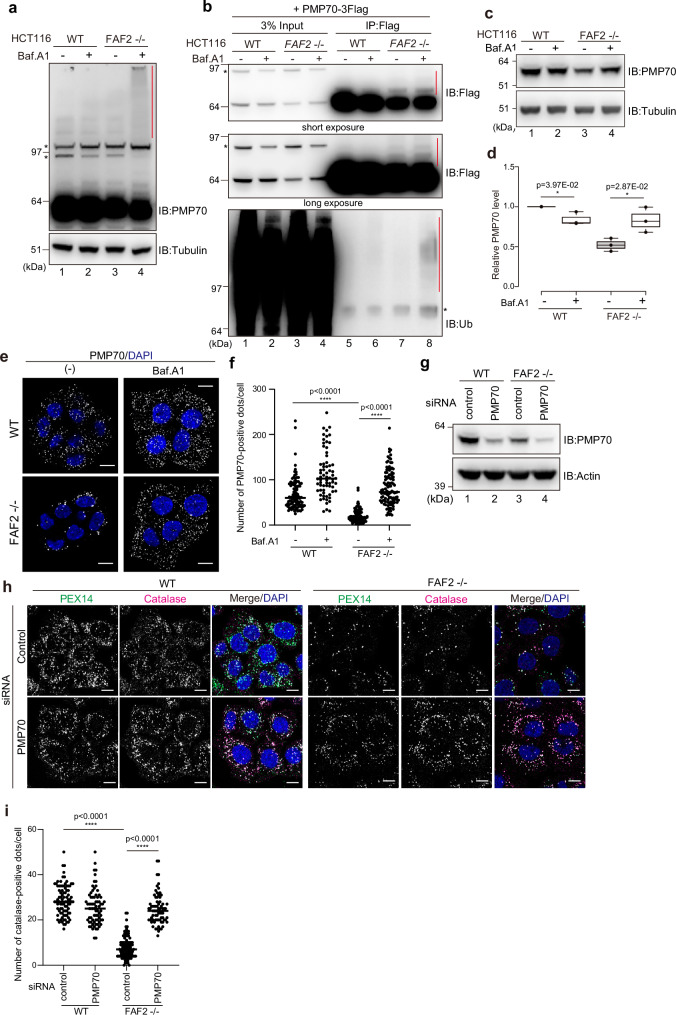
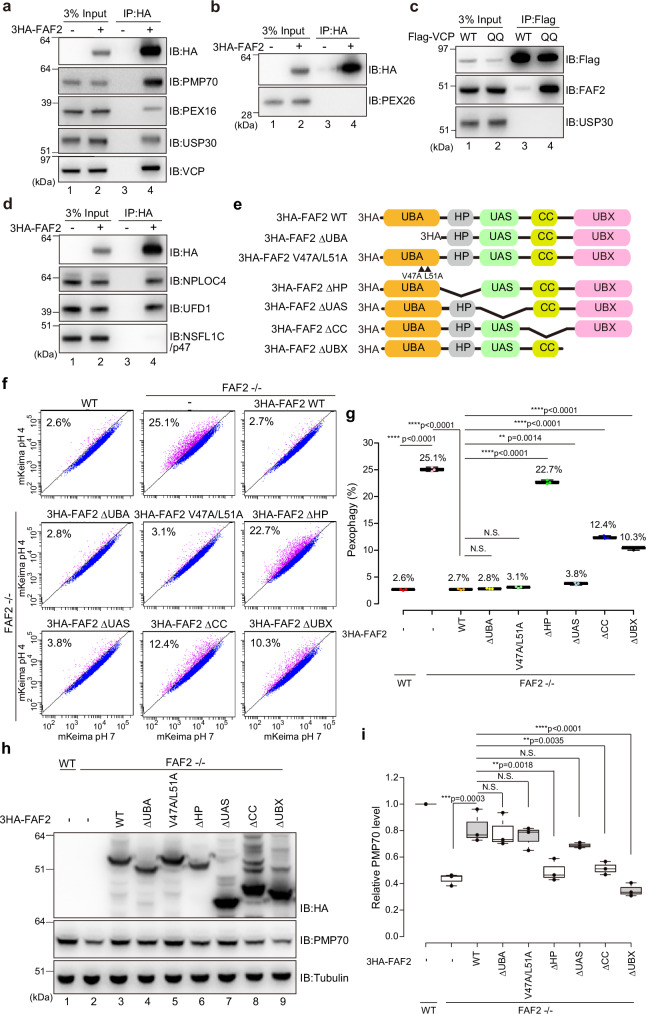
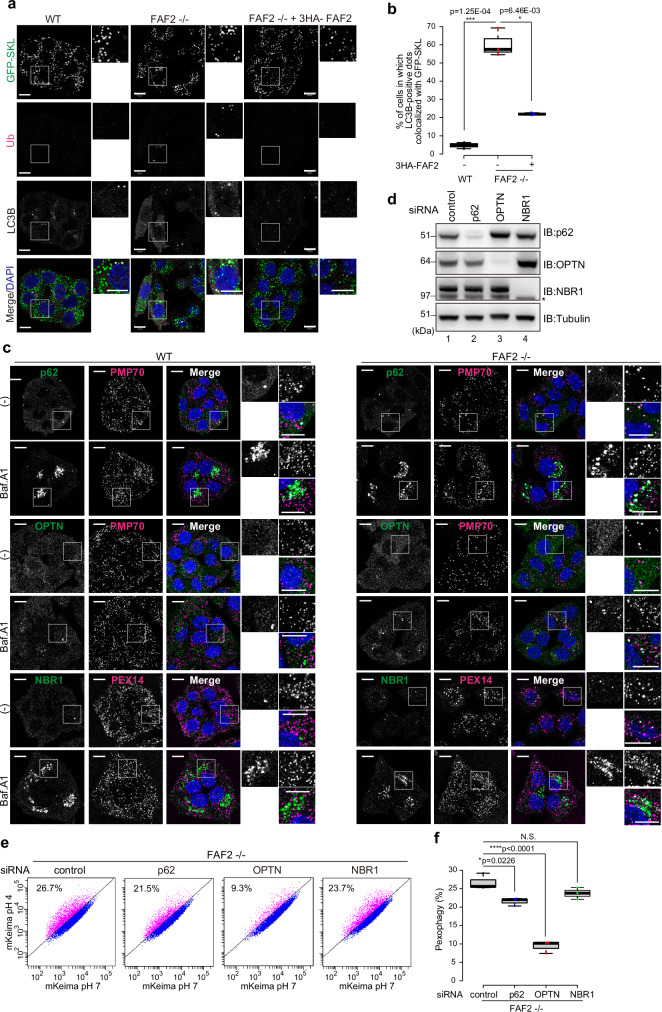
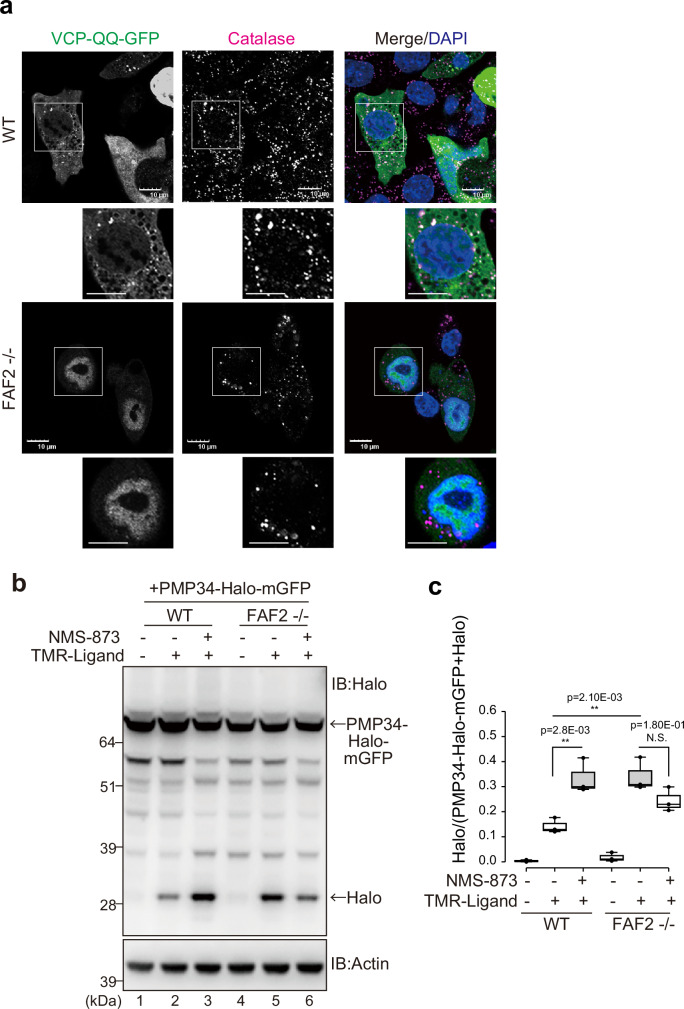
Peroxisomes are organelles that are central to lipid metabolism and chemical detoxification. Despite advances in our understanding of peroxisome biogenesis, the mechanisms maintaining peroxisomal membrane proteins remain to be fully elucidated. We show here that mammalian FAF2/UBXD8, a membrane-associated cofactor of p97/VCP, maintains peroxisomal homeostasis by modulating the turnover of peroxisomal membrane proteins such as PMP70. In FAF2-deficient cells, PMP70 accumulation recruits the autophagy adaptor OPTN (Optineurin) to peroxisomes and promotes their autophagic clearance (pexophagy). Pexophagy is also induced by p97/VCP inhibition. FAF2 functions together with p97/VCP to negatively regulate pexophagy rather than as a factor for peroxisome biogenesis. Our results strongly suggest that p97/VCPFAF2-mediated extraction of ubiquitylated peroxisomal membrane proteins (e.g., PMP70) prevents peroxisomes from inducing nonessential autophagy under steady state conditions. These findings provide insight into molecular mechanisms underlying the regulation of peroxisomal integrity by p97/VCP and its associated cofactors.


Conflict of interest statement

The authors declare no competing interests.

Figures

Fig. 1
Fig. 1. FAF2 deletion reduces peroxisomal abundance.
a Characteristics of the peroxisomal proteins mentioned in this study. b Immunocytochemical images of WT, FAF2-/-, and FAF2-/- HCT116 cells stably expressing 3HA-FAF2 (+3HA-FAF2). Cell nuclei were stained with DAPI. PEX14 and catalase colocalize in WT and FAF2-/- HCT116 cells stably expressing 3HA-FAF2. Peroxisome-deficient cells (i.e., reduced number of catalase-positive dots) were observed in FAF2-/- HCT116 cells. In some FAF2-/- cells, catalase was cytosolic, and PEX14 colocalized with Hsp60 (mitochondrial marker). Higher magnification images of the boxed regions are shown. Scale bars, 10 µm. c. The number of catalase-positive peroxisomes per cell. Peroxisome abundance is significantly reduced in FAF2-/- cells. Dots represent individual data points from three independent experiments. Total number of cells from three independent experiments; n = 53 cells (17, 17, 19 cells/experiments; WT), n = 60 cells (20 cells/experiments; FAF2-/-), and n = 52 cells (17, 17, 18 cells/experiments; FAF2-/- cells + 3HA-FAF2). Bar, median. Statistical significance was calculated using one-way ANOVA; ****p < 0.0001. d Representative images of HA-FAF2 colocalized with peroxisomal catalase. HeLa cells transiently expressing HA-FAF2 were immunostained with anti-HA and anti-catalase antibodies. A line scan (red arrows in the merged panel) shows the colocalization of HA-FAF2 (green line) and catalase (magenta line). Scale bars, 10 µm. e Endogenous FAF2 localized to PMP70-positive peroxisomes. Localization was determined using an in situ proximity ligation assay. WT cells and FAF2-/- cells were reacted with anti-FAF2 and anti-PMP70 antibodies, followed by oligonucleotide-conjugated secondary antibodies (PLA probes). Red dots indicate FAF2-PMP70 interactions. Cell nuclei were stained with DAPI. Scale bars, 10 µm. f, g PMP70, PEX14, PEX16, and catalase are reduced in FAF2-/- cells. WT, FAF2-/-, and FAF2-/- HCT116 cells stably expressing 3HA-FAF2 were immunoblotted with the indicated antibodies. The asterisk indicates an exogenous FAF2 cleavage product that lacks the N-terminal 3HA-tag. h Quantitative analysis of peroxisomal protein levels for cells in f and g. Protein levels were normalized to WT HCT116 cells, which were set to 1. Dots represent individual data points from three independent experiments. Statistical significance was calculated using a one-tailed Welch’s t-test; *p < 0.05, **p <  0.01, ***p <  0.001; N.S. not significant. The center lines correspond to the medians, and the box limits indicate the 25th and 75th percentiles. The box-plot whiskers extend 1.5 times the interquartile range from the 25th and 75th percentiles. Source data are provided as a Source Data file.
Fig. 2
Fig. 2. Loss of FAF2 accelerates pexophagy.
a Representative FACS data (mKeima-SKL 561/488 ratio) with the percentage of pexophagy-positive cells indicated. b Quantitative analysis of the pexophagy flux for cells from a. Each circle represents an individual data point from three independent experiments. Statistical significance was calculated using one-way ANOVA; ****p < 0.0001. The center lines correspond to the medians, and the box limits indicate the 25th and 75th percentiles. The box-plot whiskers extend 1.5 times the interquartile range from the 25th and 75th percentiles. c PMP70 levels increased following the FIP200 knockdown. WT and FAF2-/- cells were transfected with control or FIP200 siRNAs and then immunoblotted with the indicated antibodies. d Quantitative analysis of PMP70 levels in cells from c. PMP70 levels were normalized to WT cells, which were set to 1. Dots represent individual data points from three independent experiments. Statistical significance was calculated using a one-tailed Welch’s t-test; *p < 0.05; N.S.—not significant. The center lines correspond to the medians, and the box limits indicate the 25th and 75th percentiles. The box-plot whiskers extend 1.5 times the interquartile range from the 25th and 75th percentiles. e FIP200 knockdown reversed the peroxisomal loss observed in FAF2-/- cells. WT and FAF2-/- HCT116 cells were treated with control or PMP70 siRNAs and then immunostained with anti-PMP70 and anti-catalase antibodies. Cell nuclei were stained with DAPI. Peroxisomal abundance increased following FIP200 knockdown in FAF2-/- cells. Scale bars, 10 µm. f Quantitative analysis of per cell peroxisome abundance for cells in e. The number of catalase-positive peroxisomes was plotted. Dots represent individual data points from three independent experiments. n = 257 cells (86, 92, 79 cells/experiments; WT + sicontrol), n = 198 cells (58, 75, 65 cells/experiments; WT + si FIP200), n = 209 cells (67, 62, 80 cells/experiments; FAF2-/- + sicontrol), and n = 212 cells (77, 68, 67 cells/experiments; FAF2-/- + siFIP200). Bars, median. Statistical significance was calculated using one-way ANOVA; ****p < 0.0001. g The pexophagy flux was evaluated using a HaloTag (Halo)-based reporter processing assay. The Halo fragment was more prominent in FAF2-/- cells than WT cells, indicating that pexophagy is accelerated in FAF2-/- cells. FIP200 knockdown reduced pexophagy in FAF2-/- cells. h Quantitative analysis of the pexophagy flux in cells from g. Halo band intensity was normalized to the sum of the Halo-mGFP-SKL and Halo band intensities. The normalized Halo intensities are shown as box plots with dots indicating individual data points from three independent experiments. Statistical significance was calculated using one-way ANOVA; *p < 0.05; ***p <  0.001. The center lines correspond to the medians, and the box limits indicate the 25th and 75th percentiles. The box-plot whiskers extend 1.5 times the interquartile range from the 25th and 75th percentiles. Source data are provided as a Source Data file.
Fig. 3
Fig. 3. USP30 depletion promotes pexophagy in FAF2-/- cells.
a WT and FAF2-/- HCT116 cells were treated with control or USP30 siRNAs and then immunoblotted with the indicated antibodies. b Immunocytochemical images of WT and FAF2-/- HCT116 cells stained with an anti-catalase antibody. Cells were transfected with control and USP30 siRNAs. Cell nuclei were stained with DAPI. Scale bars, 10 µm. c Quantitative analysis of per cell peroxisome abundance for cells in b. The number of catalase-positive peroxisomes was plotted. Dots represent individual data points from three independent experiments. n = 61 cells (19, 24, 18 cells/experiments; WT + sicontrol), n = 63 cells (25, 20, 18 cells/experiments; WT + siUSP30), n = 64 cells (17, 20, 27 cells/experiments; FAF2-/- cells + sicontrol), and n = 88 cells (47, 21, 20 cells/experiments; FAF2-/- + siUSP30). Bars, median. Statistical significance was calculated using a one-tailed Welch’s t-test; ***p < 0.001; ****p <0.0001. d USP30 knockdown promotes pexophagy in FAF2-/- cells. WT, FAF2-/-, or FAF2-/- cells stably expressing 3HA-FAF2 were transfected with control or USP30 siRNAs. Cells were analyzed by FACS 48 h post-siRNA transfection. e Quantitative analysis of the pexophagy flux in cells from d. Each circle represents an individual data point from three independent experiments. Statistical significance was calculated using a one-tailed Welch’s t-test; ***p < 0.001; N.S.—not significant. The center lines correspond to the medians, and the box limits indicate the 25th and 75th percentiles. The box-plot whiskers extend 1.5 times the interquartile range from the 25th and 75th percentiles. Source data are provided as a Source Data file.
Fig. 4
Fig. 4. Extraction of excess PMP70 by the p97/VCP-FAF2 complex prevents pexophagy.
a WT or FAF2-/- HCT116 cells were treated with or without Baf.A1 for 24 h and immunoblotted with the indicated antibodies. The red vertical line denotes a smear in the PMP70 signal. The asterisks indicate cross-reactive bands. n = 3 assays. b PMP70 ubiquitylation in FAF2-/- cells. WT or FAF2-/- cells stably expressing PMP70-3Flag were treated with or without Baf.A1 for 24 h and then immunoprecipitated with anti-Flag antibodies. The samples were immunoblotted with anti-Flag and anti-ubiquitin antibodies. The red vertical lines denote ubiquitylation. The asterisks indicate cross-reactive bands. n = 2 assays. c PMP70 level in FAF2-/- cells increases in response to Baf.A1 treatment. The cells were treated with or without Baf.A1 for 24 h and then immunoblotted with the indicated antibodies. d Quantitative analysis of PMP70 levels in cells from c. PMP70 levels were normalized to WT cells, which were set to 1. Dots indicate individual data points from three independent experiments. Statistical significance was calculated using a one-tailed Welch’s t-test; *p < 0.05. The center lines correspond to the medians and the box limits indicate the 25th and 75th percentiles. The box-plot whiskers extend 1.5 times the interquartile range from the 25th and 75th percentiles. e Peroxisomal abundance in FAF2-/- cells is recovered following Baf.A1 treatment. At 24 h post-Baf.A1 treatment, the cells were immunostained with anti-PMP70 antibodies. Cell nuclei were stained with DAPI. Scale bars, 10 µm. f Quantitative analysis of the per cell number of PMP70-positive peroxisomes for cells in e. The number of PMP70-positive peroxisomes per cell was plotted. Dots represent individual data points from three independent experiments. n = 103 cells (35, 35, 33 cells/experiments; WT), n = 68 cells (22, 22, 24 cells/experiments; WT + Baf.A1), n = 91 cells (32, 30, 29 cells/experiments; FAF2-/-), and n = 110 cells (37, 37, 36 cells/experiments; FAF2-/- + Baf.A1). Bars, median. Statistical significance was calculated using one-way ANOVA; ****p < 0.0001. g WT and FAF2-/- cells were treated with control or PMP70 siRNAs and then immunoblotted with the indicated antibodies. h PMP70 knockdown reverted the peroxisomal loss observed in FAF2-/- cells. WT and FAF2-/- cells were treated with control or PMP70 siRNAs and then immunostained with anti-PEX14 and anti-catalase antibodies. Cell nuclei were stained with DAPI. Scale bars, 10 µm. i Quantitative analysis of the per cell number of catalase-positive peroxisomes per cells in h. The dots indicate individual data points from three independent experiments. n = 86 cells (35, 26, 25 cells/experiments; WT + sicontrol), n = 73 cells (23, 26, 24 cells/experiments; WT + siPMP70, n = 100 cells (33, 34, 33 cells/experiments; FAF2-/- + sicontrol), and n = 73 cells (25, 25, 23 cells/experiments; FAF2-/- cells + siPMP70). Bars, median. Statistical significance was calculated using one-way ANOVA; ****p < 0.0001. Source data are provided as a Source Data file.
Fig. 5
Fig. 5. FAF2 acts as a negative regulator of basal pexophagy.
a, b HCT116 cells stably expressing 3HA-FAF2 were treated with the chemical crosslinker DSP and then co-immunoprecipitated with anti-HA agarose beads. The samples were immunoblotted with the indicated antibodies. 3HA-FAF2 interacts with PMP70, PEX16, USP30, and p97/VCP, but not PEX26. n = 3 assays. c p97/VCP interacts with FAF2 but not USP30. HeLa cells transiently expressing Flag-tagged p97/VCP WT or the E305Q/E578Q mutant (QQ) were treated with DSP and then co-immunoprecipitated with anti-Flag beads. The samples were immunoblotted with the indicated antibodies. n = 2 assays. d 3HA-FAF2 forms a complex with NPLOC4 and UFD1 but not NSFL1C/p47. HCT116 cells stably expressing 3HA-FAF2 were treated with DSP and then immunoprecipitated with anti-HA agarose beads. The samples were immunoblotted with the indicated antibodies. n = 2 assays. e Schematic diagram of the FAF2 constructs used in this study. UBA, ubiquitin-associated domain; HP, hairpin; CC, coiled-coil domain; UBX, ubiquitin-regulatory X domain. To disrupt interactions with ubiquitin, V47A and L51A substitution were introduced into the UBA domain. deletion; Δ. f FACS-based analysis of the pexophagy flux. Representative FACS data (mKeima-SKL 561/488 ratio) for WT, FAF2-/-, or FAF2-/- cells stably expressing the indicated 3HA-FAF2 mutants with the percentage of pexophagy-positive cells indicated. FAF2 ΔUAS, FAF2 ΔUBA, and FAF2 V47A/L51A restored pexophagy in FAF2-/- cells. The effect of pexophagy suppression by FAF2 ΔHP, ΔCC, and ΔUBX was limited, indicating that the FAF2 UBA and UAS domains are dispensable for pexophagy suppression. deletion; Δ. g Quantitative analysis of the pexophagy flux in f. Dots represent individual data points from three independent experiments. Statistical significance was calculated using one-way ANOVA; **p < 0.01; **** p <  0.0001; N.S.—not significant. The center lines correspond to the medians, and the box limits indicate the 25th and 75th percentiles. The box-plot whiskers extend 1.5 times the interquartile range from the 25th and 75th percentiles. deletion; Δ. h Total cell lysates prepared from WT, FAF2-/-, and FAF2-/- HCT116 cells expressing 3HA-FAF2 WT or the indicated mutants were immunoblotted with the indicated antibodies. deletion; Δ. i Quantitative analysis of PMP70 levels in cells from h. PMP70 levels were normalized to WT HCT116 cells, which were set to 1. Dots indicate individual data points from three independent experiments. Statistical significance was calculated using one-way ANOVA; **p <  0.001; ***p < 0.001; ****p <  0.0001; N.S. not significant. The center lines correspond to the medians, and the box limits indicate the 25th and 75th percentiles. The box-plot whiskers extend 1.5 times the interquartile range from the 25th and 75th percentiles. deletion; Δ. Source data are provided as a Source Data file.
Fig. 6
Fig. 6. OPTN is required for pexophagy in FAF2-deficient cells.
a Ubiquitin (Ub) and LC3B accumulate on GFP-SKL-positive peroxisomes in FAF2-/- cells. HCT116 cells stably expressing GFP-SKL were immunostained with anti-ubiquitin and anti-LC3B antibodies. Cell nuclei were stained with DAPI. Higher magnification images of the boxed regions are shown to the right. Scale bars, 10 µm. b Quantitative analysis of cells in a. Cells in which at least one GFP-SKL signal was also positive for LC3B was counted as a positive cell. Dots represent individual data points from three independent experiments. n = 227 cells (68, 79, 80 cells/experiments; WT), n = 167 cells (55, 65, 47 cells/experiments; FAF2-/-), and n = 214 cells (66, 84, 64 cells/experiments; FAF2-/- + 3HA-FAF2). Statistical significance was calculated using one-way ANOVA; *p <  0.05, ***p < 0.001. The center lines correspond to the medians, and the box limits indicate the 25th and 75th percentiles. The box-plot whiskers extend 1.5 times the interquartile range from the 25th and 75th percentiles. c WT or FAF2-/- HCT116 cells were treated with or without Baf.A1 for 24 h and then immunostained with the indicated antibodies. FAF2-/- cells that did not have complete peroxisomal loss were used to generate representative images of the cell line. Higher magnification images of the boxed regions are shown to the right. (-) indicates untreated. Scale bars, 10 µm. n = 2 assays. d HCT116 cells were transfected with control, p62, OPTN, and NBR1 siRNAs. The cells were immunoblotted with the indicated antibodies. The asterisk indicates cross-reactive bands. n = 2 assays. e FACS-based analysis of the pexophagy flux. Representative FACS data (mKeima-SKL 561/488) for the siRNA-transfected FAF2-/- cells are shown with the percentage of pexophagy-positive cells indicated. f Quantitative analysis of the pexophagy flux for cells in e. Dots represent individual data points from three independent experiments. Statistical significance was calculated using one-way ANOVA; *p < 0.05, ****p  < 0.0001; N.S.- not significant. The center lines correspond to the medians, and the box limits indicate the 25th and 75th percentiles. The box-plot whiskers extend 1.5 times the interquartile range from the 25th and 75th percentiles. Source data are provided as a Source Data file.
Fig. 7
Fig. 7. p97/VCP-FAF2 prevents autophagic degradation of peroxisomes.
a p97/VCP is localized to peroxisomes in WT cells. WT or FAF2-/- cells were transfected with VCP-QQ-GFP and then immunostained with an anti-catalase antibody. Scale bars, 10 µm. b Pexophagy was induced following p97/VCP inhibition. WT or FAF2-/- cells stably expressing PMP34-Halo-mGFP were treated with NMS-873 (p97/VCP inhibitor). Total cell lysates were subjected to SDS-PAGE. c Quantitative analysis of the pexophagy flux for cells in b. Dots represent individual data points from three independent experiments. Statistical significance was calculated using a one-way ANOVA; **p < 0.005; N.S.- not significant. The center lines correspond to the medians, and the box limits indicate the 25th and 75th percentiles. The box-plot whiskers extend 1.5 times the interquartile range from the 25th and 75th percentiles. Source data are provided as a Source Data file.

Similar articles

Cited by

References

    1. Fujiki, Y., Okumoto, K., Mukai, S., Honsho, M. & Tamura, S. Peroxisome biogenesis in mammalian cells. Front. Physiol.5, 307 (2014). - PMC - PubMed
    1. Zhang, J. et al. ATM functions at the peroxisome to induce pexophagy in response to ROS. Nat. Cell Biol.17, 1259–1269 (2015). - PMC - PubMed
    1. Fujiki, Y. et al. Recent insights into peroxisome biogenesis and associated diseases. J. Cell Sci.133, jcs236943 (2020). - PubMed
    1. Sargent, G. et al. PEX2 is the E3 ubiquitin ligase required for pexophagy during starvation. J. Cell Biol.214, 677–690 (2016). - PMC - PubMed
    1. Bingol, B. et al. The mitochondrial deubiquitinase USP30 opposes parkin-mediated mitophagy. Nature510, 370–375 (2014). - PubMed

Publication types

MeSH terms

LinkOut - more resources