. 2024 Oct 29;15(1):9344.
doi: 10.1038/s41467-024-53755-8.

Xeroderma pigmentosum protein XPD controls caspase-mediated stress responses

Affiliations

Xeroderma pigmentosum protein XPD controls caspase-mediated stress responses

Hai Wei et al. Nat Commun. .

Abstract

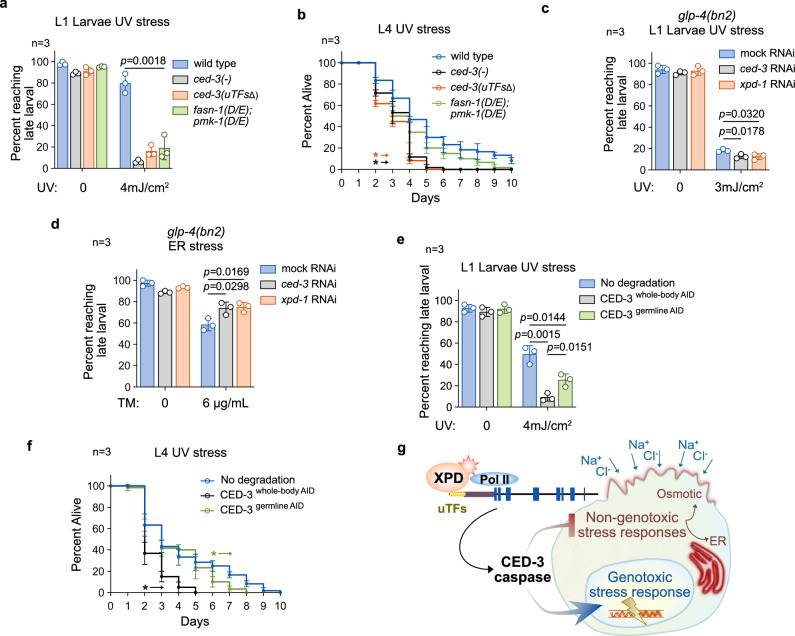
Caspases regulate and execute a spectrum of functions including cell deaths, non-apoptotic developmental functions, and stress responses. Despite these disparate roles, the same core cell-death machinery is required to enzymatically activate caspase proteolytic activities. Thus, it remains enigmatic how distinct caspase functions are differentially regulated. In this study, we show that Xeroderma pigmentosum protein XPD has a conserved function in activating the expression of stress-responsive caspases in C. elegans and human cells without triggering cell death. Using C. elegans, we show XPD-1-dependent activation of CED-3 caspase promotes survival upon genotoxic UV irradiation and inversely suppresses responses to non-genotoxic insults such as ER and osmotic stressors. Unlike the TFDP ortholog DPL-1 which is required for developmental apoptosis in C. elegans, XPD-1 only activates stress-responsive functions of caspase. This tradeoff balancing responses to genotoxic and non-genotoxic stress may explain the seemingly contradictory nature of caspase-mediated stress resilience versus sensitivity under different stressors.


Conflict of interest statement

The authors declare no competing interests.

Figures

Fig. 1
Fig. 1. Dynamic caspase gene expression during development requires ced-3 upstream transcription factor site (uTFs).
a Diagram of putative ced-3 transcription factor-rich site (uTFs) upstream of core ced-3 promoter. The ced-3 core promoter (green) consists of −1 to −1643 bp from transcription start site. The uTFs region contains −1643 to −2517 bp (tan). The uTFs region was identified from mod-ENCODE Chip-Seq data with multiple TFs binding this region. b The uTFs sequence is required for dynamic ced-3 expression. qRT-PCR to measure expression of ced-3 mRNA relative to rpl-4 mRNA. Fold change compared to wild type L1 larvae plotted in log2 scale. ced-3(uTFsΔ) represents animals with deletion of uTFs in endogenous locus using CRISPR mutagenesis. Bar, mean value from three biological replicates. Error bar, SEM. See also Supplementary Fig. 1b-c for second set of primers. *, p < 0.05, two-tailed unpaired t-test. Individual p values of each stage provided in Source Data. Embryonic cell deaths modestly diminished in mutants lacking uTFs. DIC imaging (c) and quantitation (d) of mid-embryonic cell deaths. Yellow arrows indicate corpses of dying cells. The ced-1(e1735) mutation was used to visualize cell corpses,. Scale bar, 20 μm. Early larval cell deaths reduced less than 2-fold in mutants lacking uTFs. DIC imaging (e) and quantitation (f) of early L1 stage head corpses (yellow arrows). Scale bar, 20 μm. d, f Box extends from the 25th to 75th percentiles with the line in the middle plotted at the median. Whiskers plots minimum to maximum value. Each individual value as a point superimposed on the graph. n, number of animals. p value from two-tailed Mann–Whitney test. g Diagram of late larval cell deaths in ventral nerve cord (VNC) using the Plin-11::GFP transgene to visualize VNC lineage. Yellow arrows indicate P9-12 undead VNC cells. Yellow star indicates position of vulva. Late larval cell deaths require uTFs region. DIC imaging (h) and quantitation (i) of early young adult stage VNCs retained in ced-3(-) and ced-3(uTFsΔ) mutants. Yellow arrows indicate P9-12 undead VNC cells. Yellow star indicates position of vulva. Scale bar, 50μm. Source data are provided as a Source Data file.
Fig. 2
Fig. 2. ced-3-dependent attenuation of stress response requires uTFs.
ac ER stress response heightened in ced-3(-) and ced-3(uTFsΔ) mutants. Fluorescence imaging of Phsp-4::GFP reporter (a) and quantitation of larval (b) and adult (c) animals with and without 6 μg/mL tunicamycin treatment. Scale bar, 100μm. Osmotic stress response heighted in ced-3(-) and ced-3(uTFsΔ) mutants. Fluorescence imaging of Pnlp-29::GFP reporter (d) and quantitation of larval (e) and adult (f) animals with and without 400 mM NaCl treatment. Scale bar, 100μm. b, c, e, f center line, median value; n, number of animals; Fold change normalized to wild type no stress; p value from two-tailed Mann–Whitney test. Source data are provided as a Source Data file.
Fig. 3
Fig. 3. Developmental and stress-responsive induction of ced-3 expression requires uTFs.
a Diagram of ced-3 reporter transgene cassettes with and without uTFs region. The ced-3 core promoter (green) consists of −1 to −1643 bp from transcription start site. The uTFs region contains −1643 to −2517 bp (tan). Reporter generates a His-24::mCherry::HA fusion protein that was detected using anti-HA antibody. Expression of reporters was controlled by auxin induced degron (AID). Reporters were inserted into the same MosI site to control for ectopic location of reporter. Fluorescence imaging analysis shows early larval stage and young adult animals have compromised expression of ced-3 reporter without uTFs region. Early larvae fluorescence and DIC imaging (b) and (c) quantitation. Young adult fluorescence and DIC imaging (d) and (e) quantitation. b Scale bar, 20 μm. d Scale bar, 50 μm. c, e center line, median value; p value from two-tailed Mann–Whitney test. Western analysis shows early larvae (f) and young adults (g) have compromised expression of ced-3 reporter without the uTFs region. h, i Stress-responsive induction of ced-3 reporter requires uTFs region with ER and osmotic stressors. h Adults show induction of ced-3 reporter with ER and osmotic stresses with intact uTFs region. i Overexposed gels for mid-larval animals show no induction of ced-3 reporter lacking uTFs region with ER or osmotic stress. f, g, h, i each experiment was repeated independently twice with similar results. HIS-24:mCherry reporter was detected using anti-HA antibody. Source data are provided as a Source Data file.
Fig. 4
Fig. 4. Proteomic identification and stress-responsive RNAi screen reveals factors binding uTFs.
a Overview of proteomics approach using biotinylated DNA probes. Biotinylated uTFs and mCherry (control) probes were generated with PCR and bound to streptavidin beads. b Mass-spec reveals 136 factors (black circle) enriched in uTFs probe versus mCherry DNA (control) of which 26 contain DNA binding activity (orange). c, d Top candidates from functional RNAi screen of 58 factors revealed by proteomics (Supplementary Fig. 4a) and modEncode factors (Supplementary Fig. 1a) for altered ER and osmotic stress responsiveness. *, p < 0.05, two-tailed Mann–Whitney test. n, number of animals. Individual p values of each RNAi treatment provided in Source Data. Source data are provided as a Source Data file.
Fig. 5
Fig. 5. DPL-1 and XPD-1 differentially regulate CED-3 caspase function in cell death and attenuation of stress responses.
a, b Impact on ced-3 mRNA expression by dpl-1 in early larvae and xpd-1 in young adults. qRT-PCR to measure expression of ced-3 mRNA relative to mock RNAi. Bar, mean value from 3 biological replicates. Error bar, SEM. *, p < 0.05, two-tailed unpaired t-test. Individual p values of each RNAi treatment provided in Source Data. Expression of ced-3 reporter mostly regulated by DPL-1 in early larvae. Early larvae fluorescence and DIC imaging (c) and (d) quantitation. Scale bar, 20μm. e–f Expression of ced-3 reporter regulated by XPD-1 in adults. Young adult fluorescence and DIC imaging (e) and (f) quantitation. Scale bar, 50 μm. d, f center line, median value; p value from two-tailed Mann–Whitney test. gh DPL-1 but not XPD-1 required in both larval and adult cell deaths. g DPL-1 but not XPD-1 required in early larval cell deaths and (h) adult-stage ventral nerve cord cell deaths. g box extends from the 25th to 75th percentiles with the line in the middle plotted at the median. Whiskers plots minimum to maximum value. Each individual value as a point superimposed on the graph. p value from two-tailed Mann–Whitney test. ij DPL-1 and XPD-1 required for early larval attenuation of ER stress responses tunicamycin (i) and osmotic stress with NaCl (j) in early larvae. XPD-1 but not DPL-1 required for attenuation of ER stress with tunicamycin (k) and osmotic stress with NaCl (l) in young adults. i, j, k, l center line, median value; p value from two-tailed Mann–Whitney test. XPD-1 required for stress-responsive induction of ced-3 reporter under ER stress with tunicamycin (m) and osmotic stress with NaCl (n) in young adults. RNAi treatment started at L1 and stress treatment started at L4. Sample collection at young adult stage. HIS-24::mCherry reporter was detected using anti-HA antibody. o Diagram of DPL-1 and XPD-1 working on uTFs region to support distinct caspase functions. Source data are provided as a Source Data file.
Fig. 6
Fig. 6. Conservation of XPD in caspase expression controls non-apoptotic stress responses.
a Cohort of human caspases with expression supported by XPD factor. HEK cells treated with xpd siRNA reduces expression of several caspases as measured by qRT-PCR. Bar, mean value from 4 biological replicates. Fold change normalized to control siRNA for each individual caspase. Error bar, SEM. *, p < 0.05, two-tailed unpaired t-test. bc Diminished survival in the ced-3(-) and ced-3(uTFsΔ) mutants with genotoxic stress. (b) Plate phenotype (-UV 0 h vs +UV 48 h) and (c) survival curve of mid-L4 animals treated with 75 mJ/cm2 UV radiation. Scale bar, 250 μm. d Diminished survival with genotoxic stress in animals treated with xpd-1 RNAi. Survival curve of mid-L4 animals treated with 100 mJ/cm2 UV radiation. e Enhanced developmental delay in animals treated with xpd-1 RNAi before exposing to 4mJ/cm2 UV at L1 larval stage. Bar, mean value from 3 biological replicates. Error bar, SD. p value from two-tailed unpaired t-test. f Diminished survival with genotoxic stress in xpd-1(ve842) mutants. Survival curve of early-L4 animals treated with 75 mJ/cm2 UV radiation. g Diminished survival with genotoxic stress in strains with active site dead ced-3(G360S) or ced-4(-) mutation. Enhanced survival under ER stress with tunicamycin treatment in ced-3(-) and ced-3(uTFsΔ) mutants (h) and xpd-1 RNAi (i). h, i bar, mean value from 5 biological replicates. Error bar, SD. p value from two-tailed unpaired t-test. j XPD-1 required for genotoxic stress-responsive induction of ced-3 reporter. Western blot of ced-3 promoter reporter of mid-L4 animals treated with and without UV radiation (75 mJ/cm2). HIS-24::mCherry reporter was detected using anti-HA antibody. c, d, f, g mean value from 3 biological replicates. Error bar, SD. Star with arrow marks the starting time in adulthood when p < 0.05 compared to wild type or mock RNAi. p value from two-tailed unpaired t-test. Individual p values provided in Source data. Source data are provided as a Source Data file.
Fig. 7
Fig. 7. XPD-1 and CED-3 mediate stress responses with contributions from both germline and somatic tissues.
a Developmental delay in caspase-cleavage resistant double mutant animals exposed to 4mJ/cm2 UV at L1 larval stage. b Survival with genotoxic stress in mutants with two caspase substrates with cleavage resistant mutations. cd Diminished difference in glp-4(bn2) mutants without germline treated with ced-3 and xpd-1 RNAi compared to mock RNAi before exposing to 4mJ/cm2 UV at L1 larval stage (c) or under ER stress with tunicamycin treatment (d). ef Developmental delay of germline specific elimination of CED-3 before exposing to 4mJ/cm2 UV at L1 larval stage (e) and survival curve of mid-L4 animals treated with 75 mJ/cm2 UV radiation (f). g Diagram of XPD supporting expression of caspase for opposing functions in genotoxic versus non-genotoxic stress responses. a, ce bar, mean value from 3 biological replicates. Error bar, SD. p value from two-tailed unpaired t-test. b, f mean value from 3 biological replicates. Error bar, SD. Star with arrow marks the starting time in adulthood when p < 0.05 compared to wild type or no degradation condition. Two-tailed unpaired t-test. Individual p values of each day in adulthood provided in Source data. Source data are provided as a Source Data file.

Similar articles

References

    1. Ellis, H. M. & Horvitz, H. R. Genetic control of programmed cell death in the nematode C. elegans. Cell44, 817–829 (1986). - PubMed
    1. Yuan, J. Y. & Horvitz, H. R. The Caenorhabditis elegans genes ced-3 and ced-4 act cell autonomously to cause programmed cell death. Dev. Biol.138, 33–41 (1990). - PubMed
    1. Yuan, J., Shaham, S., Ledoux, S., Ellis, H. M. & Horvitz, H. R. The C. elegans cell death gene ced-3 encodes a protein similar to mammalian interleukin-1 beta-converting enzyme. Cell75, 641–652 (1993). - PubMed
    1. Arama, E., Bader, M., Rieckhof, G. E. & Steller, H. A ubiquitin ligase complex regulates caspase activation during sperm differentiation in Drosophila. PLoS Biol.5, e251 (2007). - PMC - PubMed
    1. Dick, S. A. et al. Caspase 3 cleavage of Pax7 inhibits self-renewal of satellite cells. Proc. Natl. Acad. Sci. USA112, E5246–E5252, https://doi.org/1512869112 (2015). - PMC - PubMed

Publication types

MeSH terms

LinkOut - more resources