. 2024 Oct 29;15(1):9336.
doi: 10.1038/s41467-024-53652-0.

Selected social impact indicators influenced by materials for green energy technologies

Affiliations

Selected social impact indicators influenced by materials for green energy technologies

Saeed Rahimpour et al. Nat Commun. .

Abstract

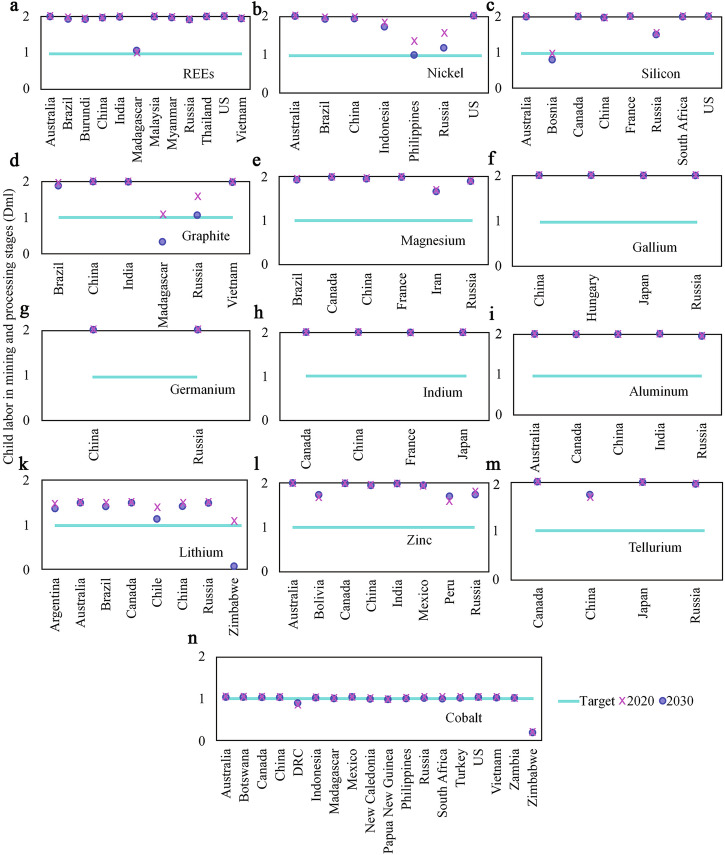
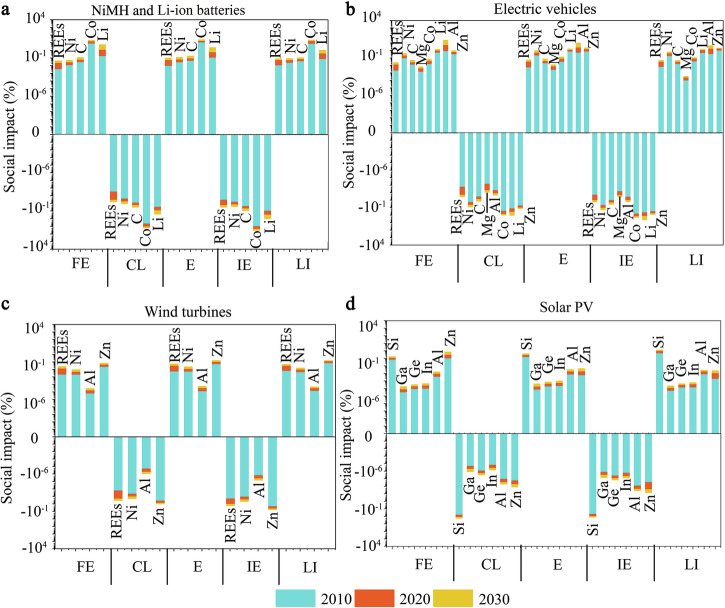
The social risks of green energy transition are underexplored. One of the important questions is which materials used in green energy technologies offer the greatest social benefits, such as ensuring decent living conditions, and which pose the most social risks. To address this issue, we develop a dynamic material-energy flow model integrating system dynamics, social life cycle assessment, and geometallurgical approaches. The analysis focuses on critical materials: Rare Earth Elements, Nickel, Silicon, Graphite, Magnesium, Gallium, Germanium, Indium, Aluminum, Cobalt, Lithium, Zinc, and Tellurium used in wind turbines, electric vehicles, lithium-ion batteries and solar photovoltaic panels. We assess their social impact on work safety, gender equality, informal employment, labor income share, employment rate, and child labor-key issues addressed by Sustainable Development Goals 1, 5, and 8. Here we show that Aluminum production for electric vehicles, wind turbines and solar photovoltaic panels generates the most jobs and income opportunities, while extraction of Cobalt, Lithium, Silicon, and Zinc carry the highest social risks.


Conflict of interest statement

The authors declare no competing interests.

Figures

Fig. 1
Fig. 1. Employment rate, labor income, and female workforce participation in the mining sector of critical energy materials.
Comparison of employment rate in the mining sector (top producers), labor income as part of GDP, and rate of female workers in the mining of critical energy materials as a percentage of the total female workforce by country in (a) 2010 and (b) 2030; (c) low labor income from the mining sector by country in 2010; (d) low labor income from the mining sector by country in 2030; (e) countries with a low share of female working in the mining sector in 2010; (f) countries with a low share of female working in the mining sector in 2030.
Fig. 2
Fig. 2. Informal employment trends in mining and processing stages of critical energy materials by top producer countries.
Informal employment performance in mining and processing (mineral processing at the site of the mine) stages by top producer country between 2020 and 2030 relative to the threshold level (i.e., standard or benchmark for acceptable levels of informal employment by SDG) as a result of production of (a) Rare Earth Elements (REEs), (b) Nickel, (c) Silicon, (d) Graphite, (e) Magnesium, (f) Gallium, (g) Germanium, (h) Indium, (i) Aluminum, (k) Lithium, (l) Zinc, (m) Tellurium, (n) Cobalt. Stars indicate informal employment levels for the country in 2020. Open circles represent the estimated informal employment in 2030. The horizontal blue line represents the social threshold for sustainable development goals. Values above the social threshold mean successes in eradicating informal employment and vice versa.
Fig. 3
Fig. 3. Child labor trends in mining and processing stages of critical energy materials by top producer countries.
Child labor in mining and processing (mineral processing at the site of the mine) stages by top producer country between 2020 and 2030 relative to the threshold level (i.e., standard or benchmark for acceptable levels of child labor stated in SDGs) as a result of production of (a) Rare Earth Elements (REEs), (b) Nickel, (c) Silicon, (d) Graphite, (e) Magnesium, (f) Gallium, (g) Germanium, (h) Indium, (i) Aluminum, (k) Lithium, (l) Zinc, (m) Tellurium, (n) Cobalt. Stars indicate child labor performance for the country in 2020. Open circles represent the estimated child labor levels in 2030. The horizontal blue line represents the social threshold concerning sustainable development goals. Values above the social threshold demonstrate progress in eradicating child labor and vice versa.
Fig. 4
Fig. 4. Impact of materials used in energy technologies on selected social indicators.
Impact of critical energy materials on selected social indicators based on four applications (a) Nickel-metal hydride (NiMH) and Li-ion batteries, (b) EVs, (c) wind turbines, (d) solar PVs from 2010 to 2030. Social indicators include FE – Female employment (as a percentage of female workforce); CL – Child labor (as a percentage of child population); E – Employment rate (as a percentage of country workforce); IE – Informal employment (as a percentage of total employment in a country); and LI – Labor income as part of country GDP in percentage. The calculations include mining, processing (mineral processing at the site of the mine) and manufacturing sectors.
Fig. 5
Fig. 5. Network model design of the dynamic social assessment of energy technologies and the associated list of critical materials for green energy technologies.
The diagram illustrates the flow of materials from extraction in top producer countries, through their use in technologies, and onward to their social impacts. This comprehensive overview helps show how materials move through these systems and where they are concentrated to discover opportunities to manage materials sustainably.

References

    1. Dudley, B. et al. BP statistical review of world energy. BP Stat. Rev.6, 116 (2018).
    1. Golroudbary, S. R., Makarava, I., Kraslawski, A. & Repo, E. Global environmental cost of using rare earth elements in green energy technologies. Sci. Total Environ.832, 155022 (2022). - PubMed
    1. El Wali, M., Rahimpour Golroudbary, S., Kraslawski, A. & Tuomisto, H. L. Transition to cellular agriculture reduces agriculture land use and greenhouse gas emissions but increases demand for critical materials. Commun. Earth Environ.5, 61 (2024).
    1. Takam Tiamgne, X., Kalaba, F. K. & Nyirenda, V. R. Mining and socio-ecological systems: a systematic review of Sub-Saharan Africa. Resour. Policy78, 102947 (2022).
    1. Wang, P. et al. Regional rare-earth element supply and demand balanced with circular economy strategies. Nat. Geosci.17, 94–102 (2024).

LinkOut - more resources