. 2024 Oct 29;14(1):25902.
doi: 10.1038/s41598-024-74332-5.

Assessing the detection of floating plastic litter with advanced remote sensing technologies in a hydrodynamic test facility

Affiliations

Assessing the detection of floating plastic litter with advanced remote sensing technologies in a hydrodynamic test facility

A de Fockert et al. Sci Rep. .

Abstract

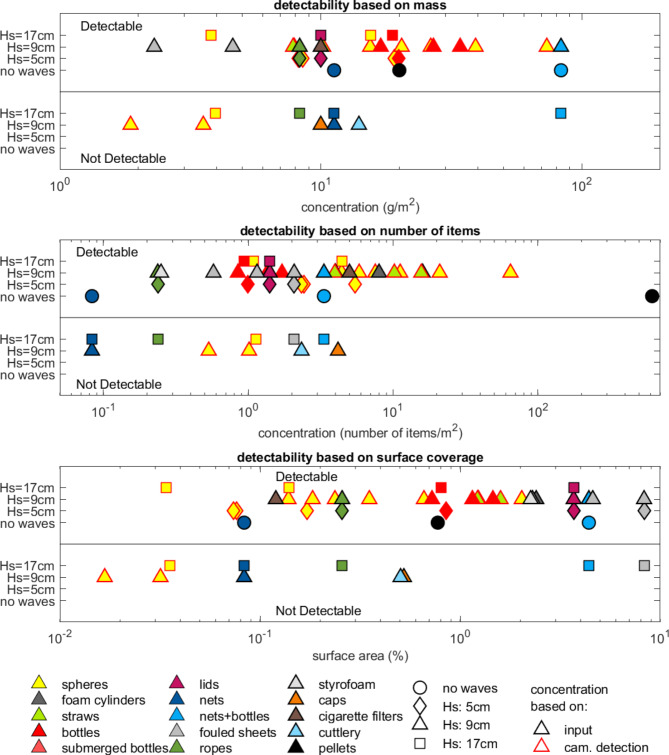
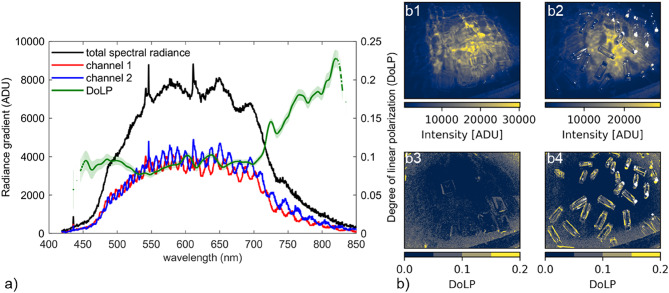
Remote sensing technologies have the potential to support monitoring of floating plastic litter in aquatic environments. An experimental campaign was carried out in a large-scale hydrodynamic test facility to explore the detectability of floating plastics in ocean waves, comparing and contrasting different microwave and optical remote sensing technologies. The extensive experiments revealed that detection of plastics was feasible with microwave measurement techniques using X and Ku-bands with VV polarization at a plastic threshold concentration of 1 item/m2 or 1-10 g/m2. The optical measurements further revealed that spectral and polarization properties in the visible and infrared spectrum had diagnostic information unique to the floating plastics. This assessment presents a crucial step towards enabling the detection of aquatic plastics using advanced remote sensing technologies. We demonstrate that remote sensing has the potential for global targeting of plastic litter hotspots, which is needed for supporting effective clean-up efforts and scientific evidence-based policy making.


Conflict of interest statement

The authors declare no competing interests.

Figures

Fig. 1
Fig. 1
Principles of different backscatter mechanisms (I-IV): (a) I: scattering on a flat-water surface, II: change in backscatter due to change in the dielectric constant from the (wetted) plastic items, III: change in backscatter due to indentation of the water surface. (b) IV: change in backscatter due to capillary waves around plastic items.
Fig. 2
Fig. 2
Microwave backscattering at Hs = 9 cm for a concentration of 10 g/m2 and a microwave frequency range between 2–20 GHz (S to K-bands) at VV polarization for (a) 5 cm length foam cylinders, (b) plastic bottles, (c) plastic spheres. The red lines in the graphs represents the theoretical Stokes drift velocity of 1.2 cm/s for a mean wave height of 5.8 cm (equals Hs = 9 cm). Because the slope of the backscattering trails in panel (b) is lower than the theoretical Stokes drift velocity, the plastic bottles appear to be drifting slower than the foam cylinders (a) and the spheres (c).
Fig. 3
Fig. 3
(a) Intensity plot for the backscatter from plastic spheres at a concentration of 153 g/m2 for C-band and X-band with different polarizations (HH, HV, VH, and VV) at Hs = 9 cm. The grey box shows the region of interest, where the signals reflect on the water surface. (b) intensity difference between plastic spheres and reference situation without plastics.
Fig. 4
Fig. 4
Histograms of the reflectivity with and without plastics (flood wraps and bags) measured by GNSS-R (L1-band microwaves) at Hs = 9 cm. The signal is transmitted under an elevation angle of 30° with the vertical using right-hand central polarisation (RHCP) and is received both at right- (RHCP, left histogram) and left-hand central polarisation (LHCP, right histogram). The difference (Δ) in statistical parameters: mean, standard deviation, kurtosis and skewness are shown in the figure for the situation with plastics minus the situation without plastics.
Fig. 5
Fig. 5
Detectability for X-band (10–12 GHz) at VV polarisation for three different plastic concentration metrics. The plastic concentration is shown as concentration based on mass (top), concentration based on number of items (middle) and concentration based on surface coverage (bottom). Markers with black outline show concentrations that are based on the input concentration and markers with red outlines show concentrations that are based on camera measurements (for spheres, bottles and straws only).
Fig. 6
Fig. 6
(a) GroundSPEX radiance and degree of linear polarization from floating bottles with Hs = 17 cm. The raw data from the two spectroradiometer channels (red and blue lines) highlight the SPEX sinusoidal modulation. The black line represents the total spectral radiance and the green line represents the degree of linear polarization retrieved from the data. (b) BlackFly observations in green band for transparent lids (b1, b3 – not detectable) and bottles (b2, b4 - detectable) for radiance (b1, b2) and degree of linear polarisation (b3, b4).

References

    1. Waters, C. N. et al. The Anthropocene is functionally and stratigraphically distinct from the Holocene. Science. 351, 2622. 10.1126/science.aad2622 (2016). - PubMed
    1. Ostle, C. et al. The rise in ocean plastics evidenced from a 60-year time series. Nat. Commun.10, 1622. 10.1038/s41467-019-09506-1 (2019). - PMC - PubMed
    1. MacLeod, M. et al. The global threat from plastic pollution. Sci. Vol. 373, 61–65. 10.1126/science.abg5433 (2021). - PubMed
    1. Thushari, G. G. N. & Senevirathna, J. D. M. Plastic pollution in the marine environment. Heliyon. 6, 8. 10.1016/j.heliyon.2020.e04709 (2020). e04709. - PMC - PubMed
    1. Jambeck, J. R. et al. Plastic waste inputs from land into the ocean. Science. 347, 768–771. 10.1126/science.1260352 (2015). - PubMed

LinkOut - more resources