. 2024 Oct 29;15(1):9321.
doi: 10.1038/s41467-024-53515-8.

Inhibiting EZH2 targets atypical teratoid rhabdoid tumor by triggering viral mimicry via both RNA and DNA sensing pathways

Affiliations

Inhibiting EZH2 targets atypical teratoid rhabdoid tumor by triggering viral mimicry via both RNA and DNA sensing pathways

Shengrui Feng et al. Nat Commun. .

Abstract

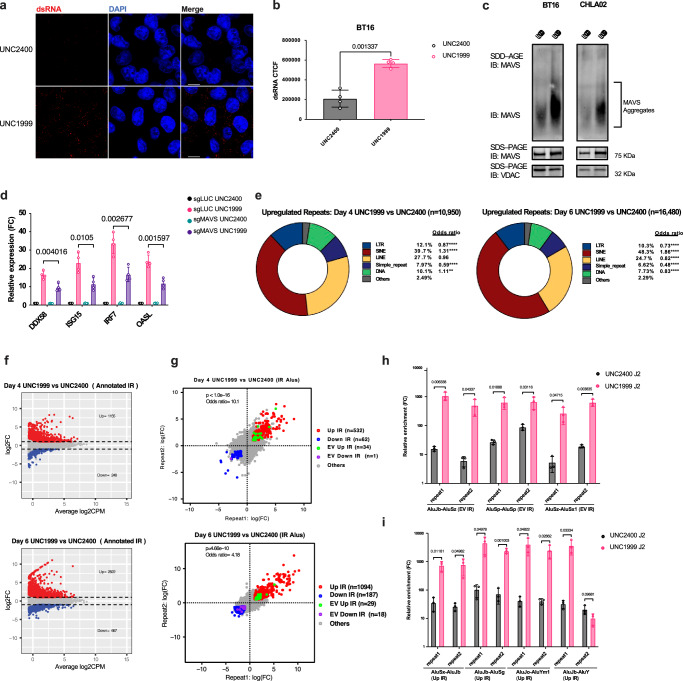
Inactivating mutations in SMARCB1 confer an oncogenic dependency on EZH2 in atypical teratoid rhabdoid tumors (ATRTs), but the underlying mechanism has not been fully elucidated. We found that the sensitivity of ATRTs to EZH2 inhibition (EZH2i) is associated with the viral mimicry response. Unlike other epigenetic therapies targeting transcriptional repressors, EZH2i-induced viral mimicry is not triggered by cryptic transcription of endogenous retroelements, but rather mediated by increased expression of genes enriched for intronic inverted-repeat Alu (IR-Alu) elements. Interestingly, interferon-stimulated genes (ISGs) are highly enriched for dsRNA-forming intronic IR-Alu elements, suggesting a feedforward loop whereby these activated ISGs may reinforce dsRNA formation and viral mimicry. EZH2i also upregulates the expression of full-length LINE-1s, leading to genomic instability and cGAS/STING signaling in a process dependent on reverse transcriptase activity. Co-depletion of dsRNA sensing and cytoplasmic DNA sensing completely rescues the viral mimicry response to EZH2i in SMARCB1-deficient tumors.


Conflict of interest statement

D.D.C. reports grants from Princess Margaret Cancer Foundation, the Canadian Institutes of Health Research, and Canada Research Chair during the conduct of the study; grants from Pfizer, and other support from Adela, Inc outside the submitted work. All the other authors declare no conflict of interest.

Figures

Fig. 1
Fig. 1. UNC1999 treatment triggers delayed activation of interferon response.
a Volcano plots showing the genes differential analysis statistics of UNC1999 (n = 3) versus UNC2400 at day 4 (left) and at day 6 (right) in BT16 cell line. The x axis represents the log2FC of differential expression and the y axis represents the -log10(FDR) of DEGs. Blue dots represent downregulated genes and red dots represent upregulated genes. Black dots represent genes that are not significantly differentially expressed. Significance was determined by |log 2FC| > 1 and FDR < 0.05. Negative binomial likelihood ratio test with BH (Benjamini–Hochberg)-corrected for multiple testing. bd Gene ontology (GO) analysis of significantly upregulated genes in UNC1999 versus UNC2400 at day 4 (b), UNC1999 versus UNC2400 at day 6 (c), and UNC1999 at day 6 versus day 4 (d). Precision represents the overlap between the tested genes and the gene set of the terms. P-value is calculated by the one-sided hypergeometric test followed by correction for multiple testing. e Analysis of transcription factor binding site enrichments for upregulated genes in UNC1999 versus UNC2400 at day 4 (left) and day 6 (right). P-value is calculated by the hypergeometric test followed by correction for multiple testing. f The expression of selected interferon-responsive genes in four indicated ATRT cell lines with either UNC2400 or UNC1999 treatment was measured by quantitative real-time PCR at day 6. g The CHLA02 (left) or BT16 (right) cell line was treated with UNC1999 in the presence or absence of the JAK1/JAK2 inhibitor Ruxolitinib (1 μM) or the JAK3 inhibitor CP-690550 (1 μM). The expression of four indicated interferon-responsive genes was measured by quantitative real-time PCR at day 6. Data are mean ± SD of three biologically independent replicates; P-value is calculated by multiple unpaired t tests (two-tailed) followed by correction for multiple testing (f, g). Source data are provided as a Source Data file.
Fig. 2
Fig. 2. UNC1999 treatment induces RNA sensing pathway through activating Alu IRs.
a Confocal microscopy of anti-dsRNA (K1) immunofluorescence in BT16 cells treated with either UNC2400 or UNC1999. Cellular dsRNA was stained in red, and nuclei were stained in blue (DAPI). Scale bars, 10 μm. b Quantification of dsRNA performed by measuring corrected total cell fluorescence (CTCF), using ImageJ. Data are mean ± SD of n = 4 biologically independent replicates; unpaired t test with Welch’s correction (two-tailed). c Representative immunoblot of MAVS aggregation assays analyzed by SDD-AGE in BT16 (left) and CHLA02 (right) cell lines with either UNC2400 or UNC1999 treatment. MAVS protein level was analyzed by SDS–PAGE. VDAC was used as a loading control in SDS–PAGE. d The BT16 cell line with or without sgRNA against MAVS was treated with either UNC2400 or UNC1999. The expression of four indicated ISGs was measured by qRT-PCR at day 6. Data are mean ± SD of n = 4 biologically independent replicates; multiple unpaired t tests (two-tailed) followed by correction for multiple testing. e Donut plots showing the proportions of repeat classes that are upregulated in RNA-seq UNC1999 versus UNC2400 at day 4 (top) and day 6 (bottom). Counts of repeat classes were compared with the whole-genome counts of repeat classes using the two-sided Fisher exact test to calculate the p-value and odds ratio. **p < 0.05; ****p < 0.0001. The p-values for day 4 plot (left) are 8.647e-07 for LTR, 0.51 for LINE, <2.2e-16 for SINE and Simple repeat, and 1.02e-3 for DNA. The p-values for the day 6 plot (right) are <2.2e-16 for LTR, SINE, LINE, and Simple repeat; and 7.6e-11 for DNA. f Mean average (MA) plots showing the upregulated Annotated IR-Alu elements in RNA-seq UNC1999 versus UNC2400 at day 4 (top) and day 6 (bottom). Red and blue dots represent the upregulated and downregulated IR-Alu elements respectively. The x axis represents the log2 count per million (CPM) in expression, and the y axis represents the log2 Fold-change. Dots in gray color represents IR-Alu elements that are not significantly regulated. Significance was determined by |log2FC|>1 and FDR < 0.05. Negative binomial likelihood ratio test with BH (Benjamini–Hochberg)-corrected for multiple testing. g Inverted repeat Alu elements analysis depicted by scatter plots of the log2FC of the IR pairs (i.e., repeat1 and repeat2) of UNC1999 to UNC2400 at day 4 (top) and day 6 (bottom). Gray dots represent Annotated IR pairs that are not upregulated. Red and blue dots represent Annotated IR pairs that are upregulated (Up IR) and downregulated (Down IR) in RNA-seq respectively, and green and purple dots represent Experimentally validated (EV) IR-Alu elements that are upregulated (EV Up IR) and downregulated (EV Down IR) in RNA-seq respectively. Significance was determined by abs(log2FC)>1 and FDR < 0.05 for both Alu elements. The count of the upregulated EV IR pairs was compared with the count of upregulated Annotated IR pairs using the two-sided Fisher exact test to calculate the odds ratio and p-value. h, i Error bar plots showing the enrichment of indicated transcripts of upregulated EV IR-Alus (h) or annotated IR-Alus (i) in the dsRNA species immunoprecipitated with J2 antibody from total RNA harvested from UNC1999- or UNC2400-treated BT16 cells. qRT-PCR was employed for analysis, with normalization to the corresponding input RNA). Data are mean ± SD of n = 3 biologically independent replicates; multiple unpaired t tests (two-tailed) followed by correction for multiple testing (h, i). Source data are provided as a Source Data file.
Fig. 3
Fig. 3. UNC1999 treatment induces intronic transcription that expresses IR-Alu elements.
a Donut plots showing the genomic distribution of the upregulated Annotated IR-Alu elements in RNA-seq UNC1999 versus UNC2400 day 4 (left) and day 6 (right). Counts of the upregulated Alu elements at genomic regions were compared with counts of all Annotated IR-Alu elements using the two-sided Fisher exact test to calculate the p-value and odds ratio. *p < 0.05; ****p < 0.0001. The p-values for day 4 plot (left) are <2.2e-16 for Intergenic, 4.187e-08 for Intron, <2.2e-16 for 3′ UTR, 9.276e-04 for 5′ UTR, and 4.816e-02 for Exon. The p-values for the day 6 plot (right) are <2.2e-16 for Intergenic, Intron, and 3′ UTR; 7.147e-09 for 5′ UTR; and 0.159 for Exon. b Counts of the upregulated intronic Annotated IR-Alu elements at day 4 (left, n = 406 Alu elements) and day 6 (right, n = 918 Alu elements) that have transcription in sense and anti-sense of their overlapping genes. c DeepTool’s aggregate profile plot (top) and heatmap (bottom) showing the RNA-seq signal in UNC1999 and UNC2400 samples of gene body regions as well as ±1 Kb up/downstream of the TSS and TES of the genes overlapping with upregulated intronic IRs in UNC1999 versus UNC2400 in day 4 (left, n = 169) and day 6 (right, n = 358). The orientation and strand of the RNA-seq signal are based on gene transcriptional orientation. d, DeepTool’s aggregate profile plot (top) and heatmap (bottom) of the RNA-seq signal in UNC1999 and UNC2400 samples of intronic regions of genes that overlap with upregulated intronic IRs in UNC1999 versus UNC2400 at day 4 (left, n = 169) and day 6 (right, n = 358). 5′end and 3′end labels are the 5′ end of the first intron and the 3′ end of the last intron in the gene respectively. The orientation and strand of the RNA-seq signal are based on gene transcriptional orientation. e, Scatter plots showing the Pearson correlation in the log2-fold change between genes and their overlapping upregulated Intragenic (Intronic and 3′UTR) IR pairs in UNC1999 versus UNC2400 at day 4 (left, n = 112) and day 6 (right, n = 214). For genes with multiple IR pairs, the IR pair with the highest FC was selected for this analysis. R represents the Pearson correlation coefficient, and the Pearson correlation p-value is calculated using the two-sided t test. f Pathway analysis of upregulated genes (n = 84) that overlap with upregulated intragenic IRs in UNC1999 versus UNC2400 in day 6. P-value is calculated using the one-sided hypergeometric test followed by correction for multiple testing. g Genome track plot showing signal of RNA-seq and H3K4me3 and H3K27me3 CUT&RUN marks at the DDX58 locus at day 6. DDX58 is significantly upregulated at day 6 UNC1999 versus UNC2400. The plot also includes at the track for the upregulated IR-Alu elements overlapping with the DDX58 gene. RNA-seq signal was plotted from the two strands separately. The RNA-seq forward strand signal was plotted in blue and positive range, while the RNA-seq reverse strand signal was plotted in red and negative range. RNA-seq tracks are plotted in log scale. The log scale of the forward strand signal was calculated as log(signaltrack+1), while the log scale of the reverse strand signal was calculated as –log(signaltrack+1). h Schematic representation of H3K27me3 deposition of IR associated genes by default and active transcription of intronic IR-Alu pairs upon UNC1999 treatment. Created in BioRender. De Carvalho, D. (2022) BioRender.com/e90j436.
Fig. 4
Fig. 4. UNC1999 treatment triggers cGAS-STING DNA sensing pathway.
a Confocal microscopy of anti-cGAS and anti-γH2A.X immunofluorescence in BT16 cells treated with either UNC2400 or UNC1999. cGAS was stained in green, γH2A.X was stained in red, and nuclei were stained in blue (DAPI). Scale bars, 10 μm. bd Quantification of γH2A.X foci per cell (b), the percentage of cells with micronuclei (c), and the percentage of cells with cGAS-positive micronuclei (d) in a. e Representative immunoblots showing the expression level of γH2A.X, cGAS, IRF7 and pSTAT1 with either UNC2400 or UNC1999 treatment in BT16 cell line. f The BT16 cell line was treated with UNC1999 in the presence or absence of the STING inhibitor H-151 (1 μM). The expression of indicated interferon-responsive genes was measured by quantitative real-time PCR at day 6. g The BT16 cell line with sgRNA against LUC, MAVS, cGAS, or both cGAS and MAVS was treated with either UNC2400 or UNC1999. The expression of indicated interferon-responsive genes was measured by quantitative real-time PCR at day 6. h Schematic representation of viral mimicry triggered by UNC1999 treatment dependent on both MAVS-mediated RNA sensing pathway and cGAS-mediated DNA sensing pathway. Created in BioRender. De Carvalho, D. (2022) BioRender.com/t86f257 Data are mean ± SD of three biologically independent replicates (b, c, f, g); P-value is calculated by unpaired t test with Welch’s correction (two-tailed) (b, c) or multiple unpaired t tests (two-tailed) followed by correction for multiple testing (f, g). Source data are provided as a Source Data file.
Fig. 5
Fig. 5. The UNC1999-induced DNA sensing is dependent on LINE-1 activity.
a Confocal microscopy of anti-H3K27me3 and anti-L1 ORF1p immunofluorescence in BT16 cells treated with either UNC2400 or UNC1999. H3K27me3 was stained in green, L1 ORF1p was stained in red, and nuclei were stained in blue (DAPI). Scale bars, 10 μm. b Confocal microscopy of anti-STING and anti-L1 ORF1p immunofluorescence in BT16 cells treated with either UNC2400 or UNC1999. STING was stained in green, L1 ORF1p was stained in red, and nuclei were stained in blue (DAPI). Scale bars, 10 μm. c Error bar plots showing the enrichment of indicated regions of LINE-1 elements in the ssDNA species extracted from UNC1999- or UNC2400-treated BT16 cells. qRT-PCR was employed for analysis, with normalization to the corresponding gDNA. d Confocal microscopy of anti-ssDNA immunofluorescence in BT16 cell line with sgRNAs against negative control, L1-5′UTR, or L1-ORF1 at day 4 post the UNC1999 or UNC2400 treatment. ssDNA was stained in red, and nuclei were stained in blue (DAPI). Scale bars, 10 μm. e Quantification of ssDNA puncta per cell in d. with a sample size of 150 cells as a stopping point for all conditions. f The expression of four indicated interferon-responsive genes in BT16 cell line with sgRNAs against negative control, L1-5′UTR (left), or L1-ORF1 (right) was measured by qRT-PCR at day 6 post the UNC1999 or UNC2400 treatment. Data are mean ± SD of three biologically independent replicates (c, f) or 150 data points (e); P-value is calculated by multiple unpaired t tests (two-tailed) followed by correction for multiple testing (c, f) or unpaired t test with Welch’s correction (two-tailed) (e). Source data are provided as a Source Data file.
Fig. 6
Fig. 6. UNC1999 treatment induces DNA damage through L1-mediated reverse transcription.
a Confocal microscopy of anti-ssDNA immunofluorescence in BT16 cells treated with UNC1999 in the presence or absence of RT inhibitors. ssDNA was stained in green, and nuclei were stained in blue (DAPI). 3RTi represents the combination of Zidovudine (AZT), Didanosine (ddI, DDI), Nevirapine (NVP). Scale bars, 10 μm. b Quantification of ssDNA puncta per cell in a. c Confocal microscopy of anti-γH2A.X immunofluorescence in BT16 cells treated with UNC1999 in the presence or absence of RT inhibitors. Scale bars, 10 μm. df Quantification of γH2A.X foci per cell (d), the percentage of cells with micronuclei (e), and the percentage of cells with cGAS-positive micronuclei (f) in c. g Representative immunoblots showing the expression level of γH2A.X, cGAS, IRF7, and pSTAT1 in BT16 cell line treated with UNC1999 in the presence or absence of RT inhibitors. h The BT16 cell line was treated with UNC1999 in the presence or absence of RT inhibitors. The expression of indicated interferon-responsive genes was measured by quantitative real-time PCR at day 6. Data are mean ± SD of three biologically independent replicates (b, d, e, f, h); P-value is calculated by unpaired t test with Welch′s correction (two-tailed) (b, d, e, f) or multiple unpaired t tests (two-tailed) followed by correction for multiple testing (h). Source data are provided as a Source Data file.

References

    1. Kadoch, C. et al. Proteomic and bioinformatic analysis of mammalian SWI/SNF complexes identifies extensive roles in human malignancy. Nat. Genet.45, 592–601 (2013). - PMC - PubMed
    1. Ginn, K. F. & Gajjar, A. Atypical teratoid rhabdoid tumor: current therapy and future directions. Front. Oncol.10.3389/fonc.2012.00114 (2012). - PMC - PubMed
    1. Versteege, I. et al. Truncating mutations of hSNF5/INI1 in aggressive paediatric cancer. Nature394, 203–206 (1998). - PubMed
    1. Wilson, B. G. et al. Epigenetic antagonism between polycomb and SWI/SNF complexes during oncogenic transformation. Cancer Cell18, 316–328 (2010). - PMC - PubMed
    1. Kia, S. K., Gorski, M. M., Giannakopoulos, S. & Verrijzer, C. P. SWI/SNF mediates polycomb eviction and epigenetic reprogramming of the INK4b-ARF-INK4a locus. Mol. Cell Biol.28, 3457–3464 (2008). - PMC - PubMed

Publication types

MeSH terms

Associated data