. 2024 Oct 29;15(1):9348.
doi: 10.1038/s41467-024-53816-y.

From emergence to endemicity of highly pathogenic H5 avian influenza viruses in Taiwan

Affiliations

From emergence to endemicity of highly pathogenic H5 avian influenza viruses in Taiwan

Yao-Tsun Li et al. Nat Commun. .

Abstract

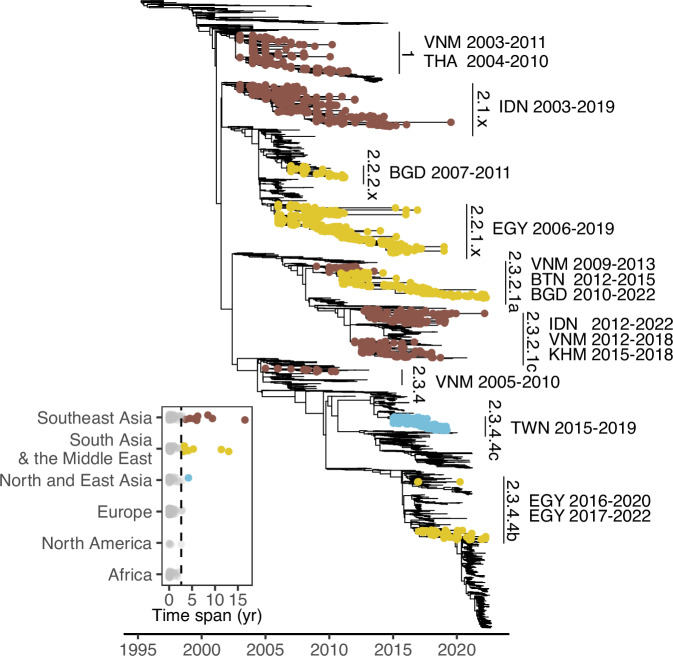
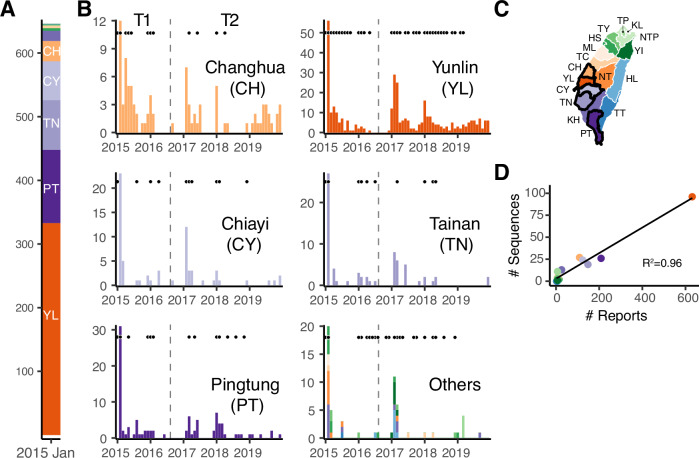
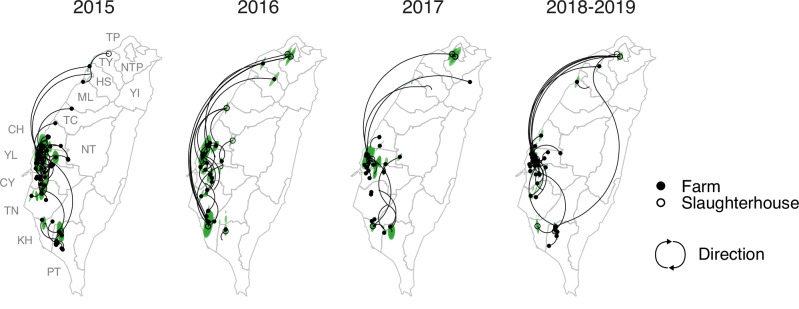
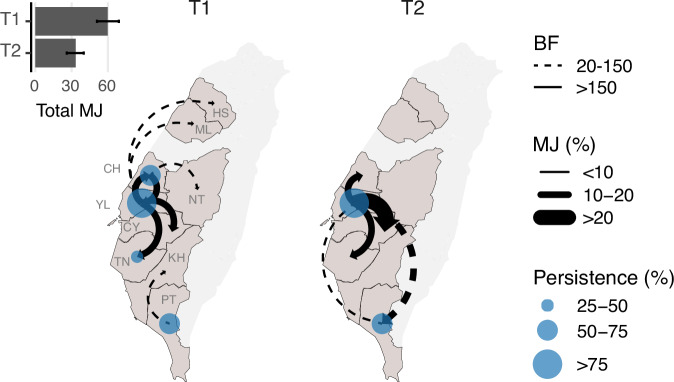
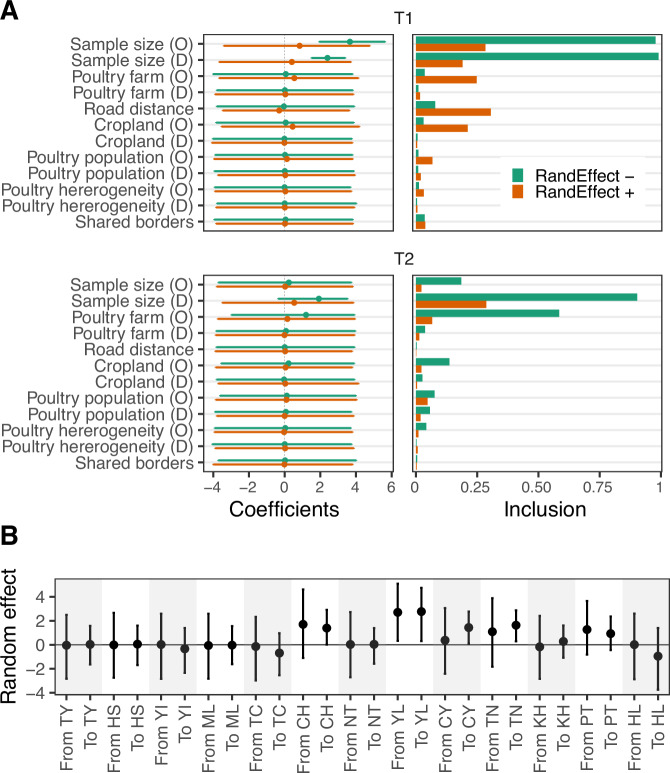
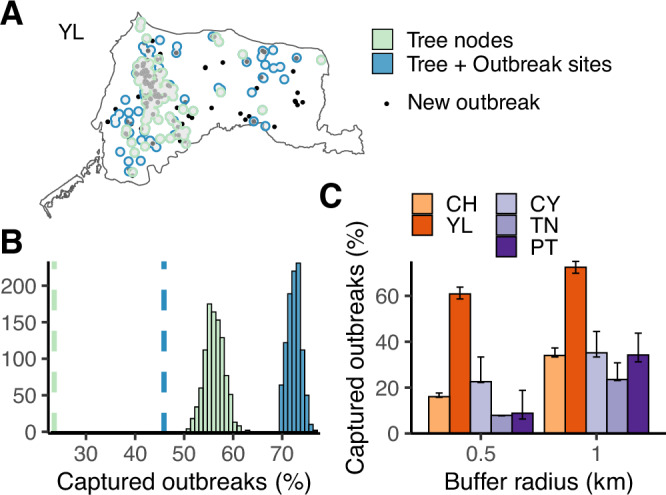
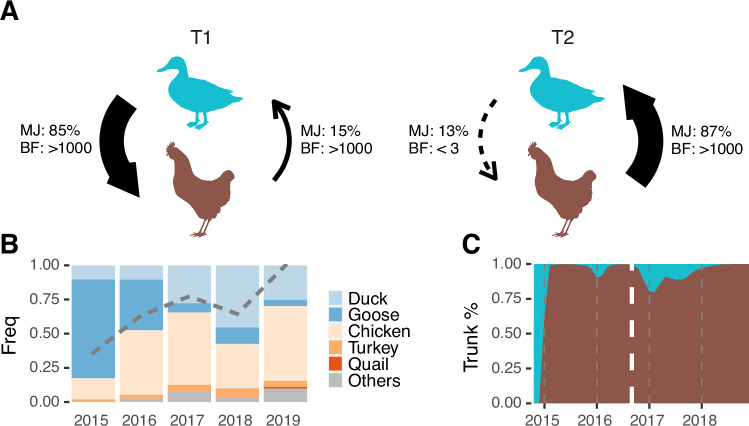
A/goose/Guangdong/1/96-like (GsGd) highly pathogenic avian influenza (HPAI) H5 viruses cause severe outbreaks in poultry when introduced. Since emergence in 1996, control measures in most countries have suppressed local GsGd transmission following introductions, making persistent transmission in domestic birds rare. However, geographical expansion of clade 2.3.4.4 sublineages has raised concern about establishment of endemic circulation, while mechanistic drivers leading to endemicity remain unknown. We reconstructed the evolutionary history of GsGd sublineage, clade 2.3.4.4c, in Taiwan using a time-heterogeneous rate phylogeographic model. During Taiwan's initial epidemic wave (January 2015 - August 2016), we inferred that localised outbreaks had multiple origins from rapid spread between counties/cities nationwide. Subsequently, outbreaks predominantly originated from a single county, Yunlin, where persistent transmission harbours the trunk viruses of the sublineage. Endemic hotspots determined by phylogeographic reconstruction largely predicted the locations of re-emerging outbreaks in Yunlin. The transition to endemicity involved a shift to chicken-dominant circulation, following the initial bidirectional spread between chicken and domestic waterfowl. Our results suggest that following their emergence in Taiwan, source-sink dynamics from a single county have maintained GsGd endemicity up until 2023, pointing to where control efforts should be targeted to eliminate the disease.


Conflict of interest statement

The authors declare no competing interests.

Figures

Fig. 1
Fig. 1. The duration of GsGd outbreak lineages.
The time-scaled phylogenetic tree inferred with HA genes highlights 15 lineages, which persistently circulated for at least 3 years. These are labelled with H5 nomenclature classification, country of isolation and duration. The inset shows the lineage duration classified by geographical area, with persistent sublineages highlighted as tips on the phylogeny. The dashed line denotes 95% quantile. VNM Vietnam, THA Thailand, IDN Indonesia, BGD Bangladesh, EGY Egypt, BTN Bhutan, KHM Cambodia, TWN Taiwan.
Fig. 2
Fig. 2. The emergence of HPAI GsGd clade 2.3.4.4c in Taiwan and subsequent circulation from 2015 to 2019.
A and B The number of reports of infected poultry in farms or abandoned dead poultry. The January 2015 numbers are pooled in panel A, while the monthly numbers of reports are presented by location in panel B. Black dots above the bars indicate the availability of genomic data in the corresponding months. The dashed vertical lines indicate the start of September 2016, the transition from the emergence (T1) to the endemic phase (T2). C The map highlights the five counties/cities with the most reports. D The correlation between reported outbreaks and available sequences for each of the 14 counties/cities. The points are coloured using the same colour scheme as the map and the other panels. NTP New Taipei, TP Taipei, KL Keelung, TY Taoyuan, HS Hsinchu, YI Yilan, ML Miaoli, TC Taichung, CH Changhua, NT Nantou, YL Yunlin, CY Chiayi, TN Tainan, KH Kaohsiung, PT Pingtung, HL Hualien, TT Taitung.
Fig. 3
Fig. 3. Reconstruction of the dispersal of clade 2.3.4.4c in Taiwan, 2015–2019.
The points on the maps indicate the location of the virus samples, while the coloured areas represent the 80% HPD (highest posterior density) of the nodes inferred by the continuous phylogeography. Curves represent the branches of the maximum clade credibility (MCC) tree and are categorised into four periods based on the timing of parental nodes. Dispersal direction (clockwise) of the viral lineage is indicated by the curvature.
Fig. 4
Fig. 4. Schematic illustration of the main diffusion routes of the Taiwan clade 2.3.4.4c virus during the first epidemic wave and subsequent transition to endemicity.
The statistically supported directions between counties/cities (Bayes factor > 20) inferred by the discrete phylogenetic analyses are indicated as curves with arrows. The different line types reflect the strength of support (BF). The thickness of the curve reflects the frequency of transition events, presented as the proportion of total Markov jumps in the time period (T1 or T2). Total Markov jumps are indicated on the upper left inset. The size of the blue circles reflects the degree of persistence, calculated by unifying phylogeny branches with both nodes inferred as the same geographical area divided by the T1/T2 time period. Only areas where viruses circulated for more than 25% of the period are labelled. T1, January 2015 to August 2016; T2, September 2016 to March 2019.
Fig. 5
Fig. 5. Potential predictors of dispersal of clade 2.3.4.4c virus between counties/cities in Taiwan.
A The conditional effect sizes quantified by coefficients (left) and the inclusion probabilities of predictors (right) estimated by the time-heterogeneous phylogenetic generalised linear model (GLM). Results of the models with and without random effect variables are shown. The predictor names are denoted by O in parentheses for origin and D for destination. B Location-specific random effects in the GLM model. The effect sizes are in log space and are presented as mean with 95% HPD interval.
Fig. 6
Fig. 6. Evaluating the spatial distribution of re-emergent H5 HPAI outbreaks in Yunlin county (YL).
A An example from a randomly selected posterior tree. The black points indicate reported outbreak sites that occurred between 2019 and 2022, after the latest available genetic data. The green/blue areas created by merged buffers indicate the inferred hotspots. B Distributions of captured new outbreaks by inferred epidemic hotspots based on 1 km-buffers with centres of nodes only (green) or nodes plus outbreak sites (blue). The vertical dashed lines indicate the mean of randomly generated circulating areas with identical buffer numbers as tree nodes (green) or tree nodes plus outbreak sites (blue). C Comparing the re-emergence of outbreaks within inferred hotspots in different locations. Proportions of captured outbreaks were calculated with buffers of two radius distances. The bars show the mean values based on 1000 posterior trees. Error bars indicate 95% credible intervals.
Fig. 7
Fig. 7. Transmission shifted from predominantly domestic waterfowl to chicken during the transition from epidemic to endemic circulation of 2.3.4.4c in Taiwan.
A Shift in diffusion patterns between Anseriformes (duck and goose) and Galliformes (chicken, turkey and quail). Frequencies of transition events (Markov jump, MJ) and statistical support (Bayes factor, BF) were inferred using the discrete phylogenetic method. B The host distribution over time is based on the surveillance data. The grey dashed line indicates the proportions of Galliformes in the genetic data. C Inferred host categories, i.e. Anseriformes or Galliformes species, of the trunk of clade 2.3.4.4c. The white dashed line divides T1 and T2, with areas coloured using the same scheme as panel (A).

References

    1. Karesh, W. B. et al. Ecology of zoonoses: natural and unnatural histories. Lancet380, 1936–1945 (2012). - PMC - PubMed
    1. Guan, Y. & Smith, G. J. D. The emergence and diversification of panzootic H5N1 influenza viruses. Virus Res.178, 35–43 (2013). - PMC - PubMed
    1. Smith, G. J. D., Donis, R. O. & World Health Organization/World. Organisation for Animal Health/Food and Agriculture Organization (WHO/OIE/FAO) H5 Evolution Working Group. Nomenclature updates resulting from the evolution of avian influenza A(H5) virus clades 2.1.3.2a, 2.2.1, and 2.3.4 during 2013–2014. Influenza Other Respir. Viruses9, 271–276 (2015). - PMC - PubMed
    1. Li, Y.-T., Su, Y. C. F. & Smith, G. J. D. H5Nx viruses emerged during the suppression of H5N1 virus populations in poultry. Microbiol. Spectr.9, e01309–e01321 (2021). - PMC - PubMed
    1. FAO. Approaches to controlling, preventing and eliminating H5N1 Highly Pathogenic Avian Influenza in endemic countries. Animal Production and Health Paper. No. 171, Rome (2011).

Publication types

MeSH terms

LinkOut - more resources