. 2025 Jan;9(1):87-98.
doi: 10.1038/s41559-024-02553-y. Epub 2024 Oct 29.

Diverse prehistoric cattle husbandry strategies in the forests of Central Europe

Affiliations

Diverse prehistoric cattle husbandry strategies in the forests of Central Europe

Rosalind E Gillis et al. Nat Ecol Evol. 2025 Jan.

Abstract

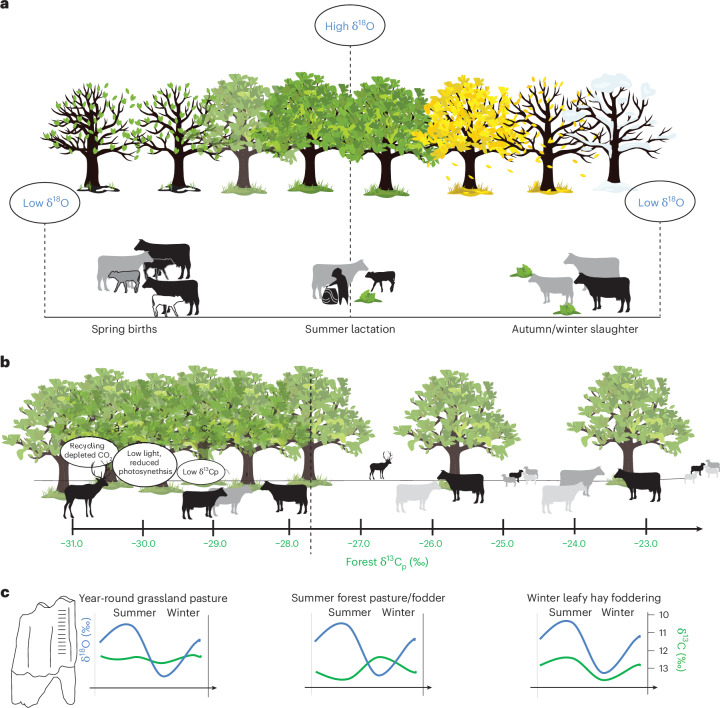
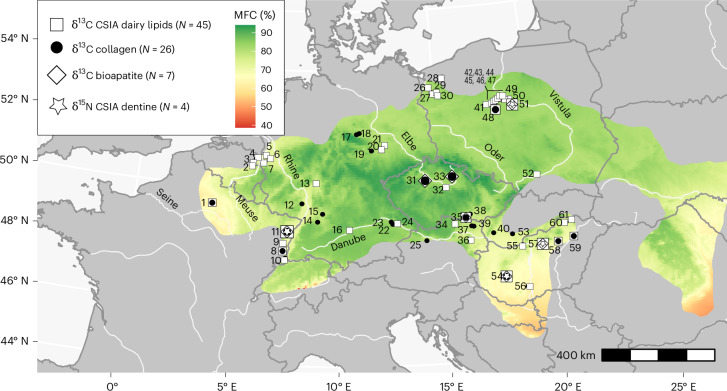
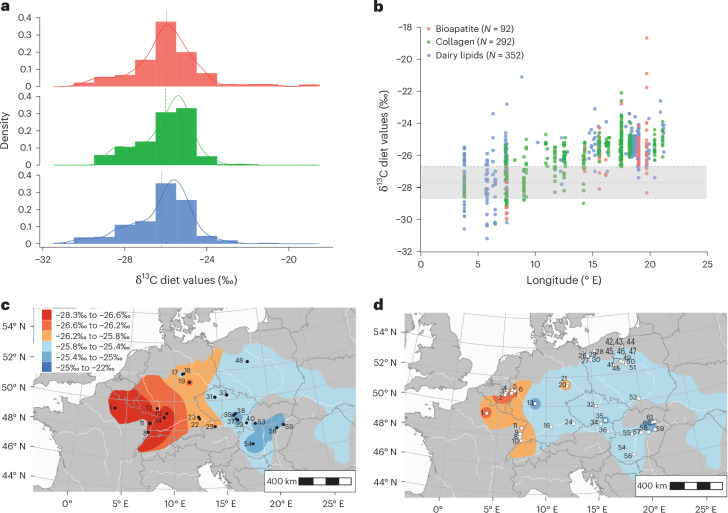
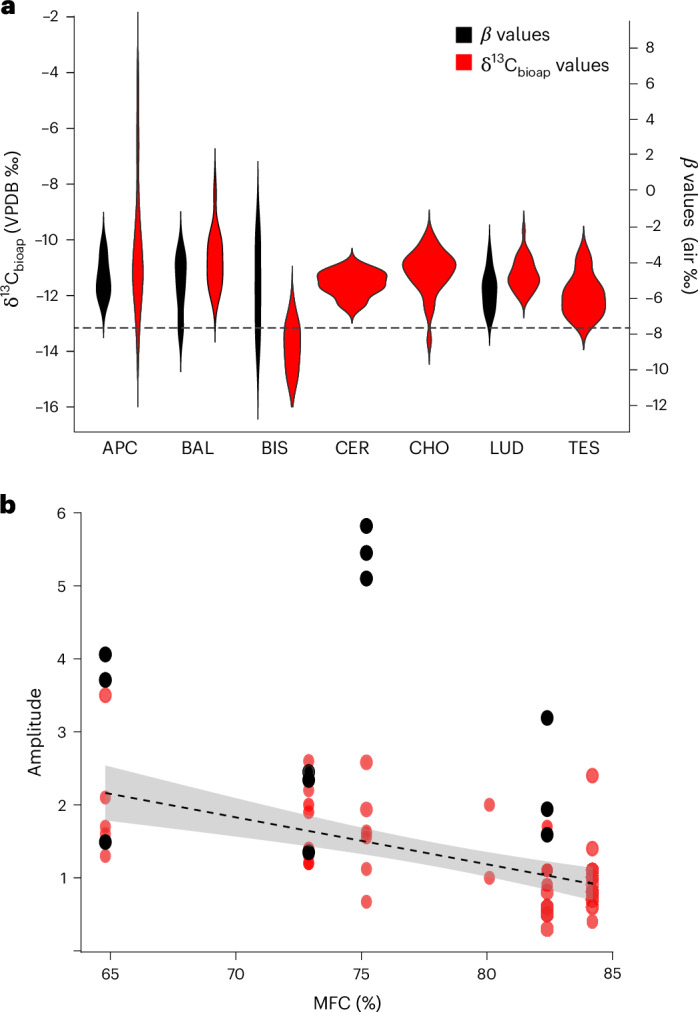
During the sixth millennium BCE, the first farmers of Central Europe rapidly expanded across a varied mosaic of forested environments. Such environments would have offered important sources of mineral-rich animal feed and shelter, prompting the question: to what extent did early farmers exploit forests to raise their herds? Here, to resolve this, we have assembled multi-regional datasets, comprising bulk and compound-specific stable isotope values from zooarchaeological remains and pottery, and conducted cross-correlation analyses within a palaeo-environmental framework. Our findings reveal a diversity of pasturing strategies for cattle employed by early farmers, with a notable emphasis on intensive utilization of forests for grazing and seasonal foddering in some regions. This experimentation with forest-based animal feeds by early farmers would have enhanced animal fertility and milk yields for human consumption, concurrently contributing to the expansion of prehistoric farming settlements and the transformation of forest ecosystems. Our study emphasizes the intricate relationship that existed between early farmers and forested landscapes, shedding light on the adaptive dynamics that shaped humans, animals and environments in the past.


Conflict of interest statement

Competing interests: The authors state there are no competing interests.

Figures

Fig. 1
Fig. 1. A model of LBK cattle herding and diet with reference to stable isotopes.
a, A model of LBK cattle husbandry across the annual seasons, represented by the trees. Oxygen isotopic ratios of drinking water will vary in temperate regions relative to local temperatures, with high values in summer and low in winter. During the seasonal calendar, we may expect animals to be supplied with additional feed from the forest, that is, leafy hay. We assume the autumn slaughter would remove unwanted males and old unproductive females. b, The canopy effect on plant δ13C values (δ13Cp) in temperate environments. c, Hypothetical stable isotope values of sequential samples of enamel bioapatite from cattle molars being raised in forested and open environments in different scenarios. Credit: trees, cattle, deer and sheep icons from Vecteezy.com.
Fig. 2
Fig. 2. Site location with reference to modelled MFC.
Site locations and MFC calculated from past forest reconstructions within the LBK distribution based on ref. (Methods). All sites are LBK, except for Alföld Linear Pottery (ALP, Supplementary Table 1). N, number of sites. (1) Cuiry-lès-Chaudardes, (2) Maastricht-Cannerberg, (3) Maastricht-Klinkers, (4) Geleen-Janskamperveld, (5) Erkelenz-Kückhoven, (6) Konigshoven 14 (FR 5), (7) Langweiler 8 (ref. ), (8) Ensisheim-Ratfeld,, (9) Colmar, (10) Sierentz, (11) Bischoffsheim,,, (12) Herxheim, (13) Kilianstädten, (14) Vaihingen an der Enz, (15) Heilbronn-Neckargartach, (16) Dillingen-Steinheim, (17) Derenburg Meerenstieg II, (18) Halberstadt Sonntagsfeld, (19) Karsdorf, (20) Altscherbitz, (21) Brodau, (22) Aiterhofen, (23) Lerchenhaid, (24) Stephansposching, (25) Rutzig/Haid, (26) Płonia 2, (27) Brzezin 7, (28) Karwowo 1, (29) Żalęcino, (30) Żuków, (31) Černý Vůl,,, (32) Bylany,, (33) Chotěbudice,,, (34) Stroegen, (35) Těšetice-Kyjovice,, (36) Brunn am Gebirge, (37) Gnadendorf, (38) Vedrovice-Sídliště, (39) Asparn a. d. Zaya/Schletz, (40) Blatné, (41) Chabsko 24, (42) Żegotki, (43) Bożejewice 22/23, (44) Rożniaty 2, (45) Radojewice 29, (46) Kuczkowo 5, (47) Siniarzewo 1, (48) Kopydłowo 6 (refs. ,), (49) Ludwinowo 7 (refs. ,,,), (50) Bodzia 1, (51) Kruszyn 13, (52) Modlnica 5, (53) Vráble-Veľké Lehemby, (54) Balatonszárszó-Kis-erdei-dűlő,, (55) Štúrovo, (56) Tolna-Mözs-Községi-Csádés-földek, (57) Apc-Berekalja I, (58) Füzesabony-Gubakút (ALP),, (59) Polgár-Ferenci-hát (ALP), (60) Garadna- Elkerülő út (ALP) and (61) Felsővadász-Várdomb (ALP). The outline of the LBK distribution was adapted from ref. under a Creative Commons licence CC BY 4.0.
Fig. 3
Fig. 3. Overview of cattle/ruminant diet δ13C values.
a, A histogram of the cattle/ruminant diet δ13C values (δ13Cdiet) based on new and published δ13C16:0 values from dairy lipids,,,,,, recovered from pottery vessels (blue, N = 352), δ13Ccoll values,,–, (green, N = 292) from bone collagen and max/min δ13Cbioap values from the sequential bioapatite samples from cattle molars,, (red, N = 92) (Supplementary Tables 2–4). b, A biplot of longitude and δ13Cdiet from the three datasets (colour legend as in a). The dotted line with error margins in a and b represents the diet value of −27.7‰, s.d. of 1‰ (1σ) for a forest dwelling ruminant animals based on the mean δ13Ccoll value from published contemporaneous deer bone collagen data,,,and new data (Supplementary Table 6). c, Interpolation map for cattle δ13Cdiet inferred from δ13Ccoll values (black circles). d, Interpolation map for dairy ruminant δ13Cdiet inferred from δ13Cdairy values (white squares, colour legend as in c). The outline of the LBK distribution was adapted from ref. under a Creative Commons licence CC BY 4.0.
Fig. 4
Fig. 4. Overview of δ13Cbioap and dietary β values from cattle molars.
a, Violin plots of δ13Cbioap values (red) from Apc-Berekalja I (APC), Balatonszárszó (BAL), Bischoffsheim (BIS), Chotěbudice (CHO),, Černý Vůl (CER), Ludwinowo 7 (LUD) and Těšetice-Kyjovice (TES), and dietary β values (Δ15NGlx–Phe, black) from APC, BAL, BIS and LUD. The dashed black line is the hypothetical δ13Cbioap value for forest-dwelling herbivore (−13.2‰, based on −27.7‰ adjusted for Δbioap-diet by −14.5‰ (ref. )) and dietary β values for woody plants (−7.7‰ (ref. )). b, The amplitude (max–min) in δ13Cbioap values (red) and dietary β values (black) from cattle molars in comparison with MFC (%). The linear regression line is the correlation between δ13Cbioap and MFC values (Pearson’s correlation, r = −0.7, P = 3.84 × 10−6) with a 95% confidence interval.
Fig. 5
Fig. 5. Integrated bioapatite δ13C, δ18O and dentine β values from cattle molars.
af, Integrated bioapatite δ13C (red diamonds), δ18O (dashed line) and dentine β values (black squares) from cattle molars from BAL3 (a), BAL5 (b), LUD1 (c), APC1 (d), BIS3 (e) and BIS7 (f). The β values have been adjusted by an estimated 6 months to account for the delay between mineralization of dentine and enamel. The dotted light-grey line is the upper limit of both dietary β values for woody plants (−7.7‰ (ref. )) and hypothetical δ13C value for forest dwelling herbivore (−13.2‰, based on −27.7‰ adjusted for Δbioap-diet by −14.5‰ (ref. )). The δ18O (dashed line) curve is based on modelled values. The light-grey boxes are an approximation of the cold season based on δ18O values. The x-axes increase in time from left to right, reflecting the development of the tooth over time.
Extended Data Fig. 1
Extended Data Fig. 1. Bioapatite results.
The δ18O and δ13C values from sampled teeth from Bischoffscheim (BIS), Těšetice-Kyjovice (TES), Ludwinowo 7 (LUD), Apc-Berekalja (APC) and Balatonszárszó (BAL). The grey box represents winter⁄cold season based on low δ18O value, while the dotted line is the hypothetical forest signal.
Extended Data Fig. 2
Extended Data Fig. 2. Uncorrected version of Fig. 5.
Raw values of bioapatite δ13Cbioap (red diamonds), δ18O (open diamonds) and dentine β values (black squares) from cattle molars: A. BAL3; B. BAL5; C. LUD1; D. APC1; E. BIS3; F. BIS4. The grey dotted line is the upper limit of both dietary β values for woody plants (−7.7‰ ref.) and hypothetical δ13C value for forest dwelling herbivore (−13.2‰, based on −27.7‰ adjusted for Δbioap-diet by −14.5‰).
Extended Data Fig. 3
Extended Data Fig. 3. Correlation Plot.
The correlation result from the proxies: Longitude; Latitude; Strahler stream order (SSO); mean forest cover (MFC); mean precipitation in summer (PMS); and winter (PMW), mean temperature in summer (TMS) and winter (TMW); δ13C diet values; river drainage systems (RDS); distance to nearest river (DNR).

References

    1. Bogucki, P. Animal traction and household economies in Neolithic Europe. Antiquity67, 492–503 (1993).
    1. Marciniak, A. Placing Animals in the Neolithic: Social Zooarchaeology of Prehistoric Farming Communities (Univ. College London, 2005).
    1. Bogucki, P. Forest Farmers and Stockherders. Early Agriculture and Its Consequences in North–Central Europe (Cambridge Univ. Press, 1988).
    1. Rowley-Conwy, P. & Layton, R. Foraging and farming as niche construction: stable and unstable adaptations. Philos. Trans. R. Soc. Lond. B366, 849–862 (2011). - PMC - PubMed
    1. Gillis, R. E. et al. The evolution of dual meat and milk cattle husbandry in Linearbandkeramik societies. Proc. R. Soc. Lond. B10.1098/rspb.2017.0905 (2017). - PMC - PubMed

Publication types

LinkOut - more resources