. 2024 Oct 29;14(1):26016.
doi: 10.1038/s41598-024-77841-5.

Sub-20-fs UV-XUV beamline for ultrafast molecular spectroscopy

Affiliations

Sub-20-fs UV-XUV beamline for ultrafast molecular spectroscopy

Aurora Crego et al. Sci Rep. .

Abstract

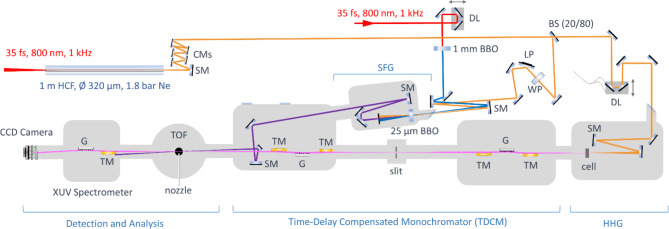
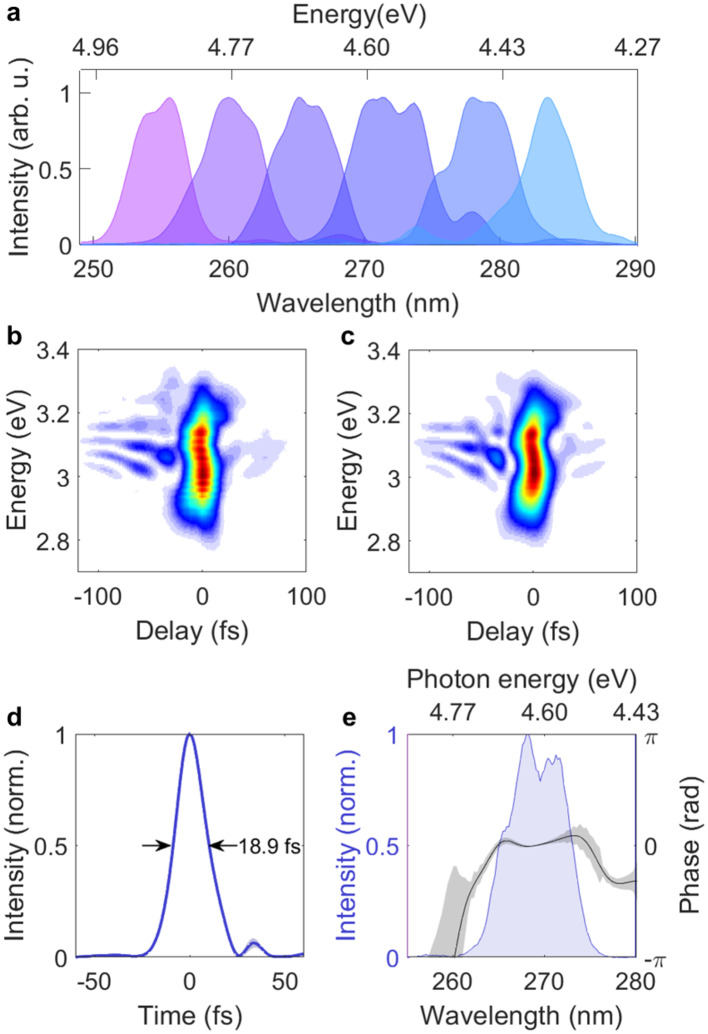
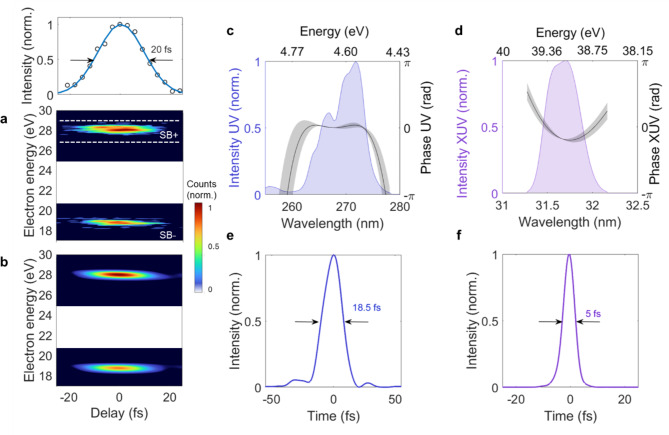
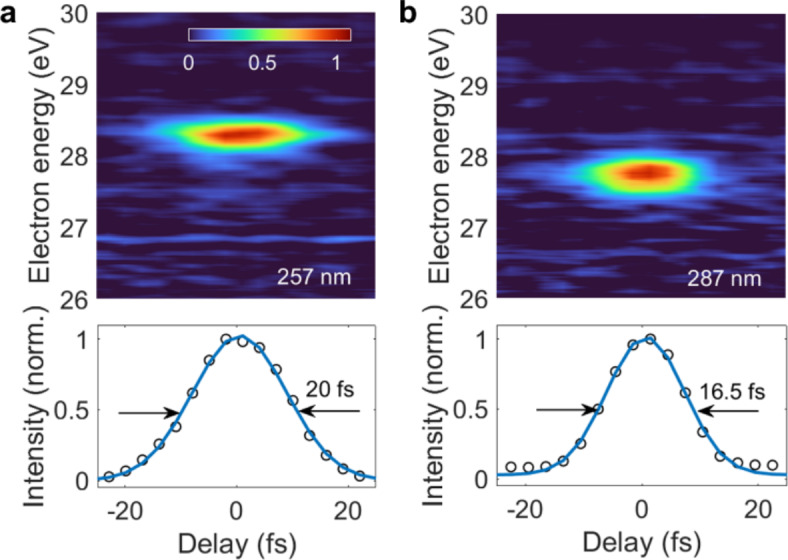
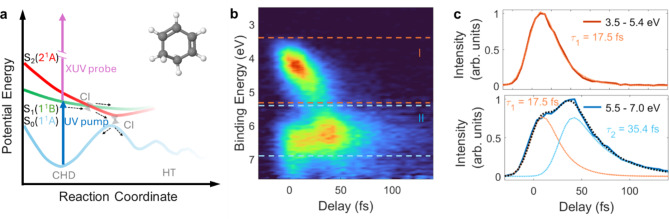
We present an ultraviolet (UV) - extreme-ultraviolet (XUV) pump-probe beamline with applications in ultrafast time-resolved photoelectron spectroscopy. The UV pump pulses, tuneable between 255 and 285 nm and with µJ-level energy, are generated by frequency up-conversion between ultrashort visible/infrared pulses and visible narrow-band pulses. Few-femtosecond XUV probe pulses are produced by a high-order harmonic generation source equipped with a state-of-the-art time-delay compensated monochromator. Two-colour UV-XUV sidebands are used for a complete in situ temporal characterization of the pulses, demonstrating a temporal resolution of better than 20 fs. We validate the performances of the beamline through a UV-XUV pump-probe measurement on 1,3-cyclohexadiene, resolving the ultrashort dynamics of the first conical intersection. This instrument opens exciting possibilities for investigating ultrafast UV-induced dynamics of organic molecules in ultrashort time scales.


Conflict of interest statement

The authors declare no competing interests.

Figures

Fig. 1
Fig. 1
Scheme of the TRPES beamline. The output of a Ti: Sa laser is post-compressed in a hollow core fiber compressor; additional chirped mirrors (CMs) impose a slightly negative chirp. A fraction of the beam, whose energy is controlled by a waveplate (WP) and a linear polarizer (LP), is upconverted in a broadband sum frequency generation (SFG) scheme with a narrowband second harmonic, resulting in sub-20 fs UV pulses. Spherical mirrors (SM) are used for focusing and collimation. The remaining beam is used for HHG. The generated harmonics are spectrally selected by a TDCM, composed of two stages consisting of two toroidal mirrors (TM) and a grating (G). The delay between the UV pump and the XUV probe pulses is controlled by a delay line (DL). Both pulses are focused into the time of flight spectrometer (TOF).
Fig. 2
Fig. 2
(a) Tuneable UV spectra. (b) Measured XFROG trace for a central wavelength of 270 nm. (c) Retrieved XFROG trace of (b) using an ePIE algorithm. (d) The retrieved intensity profile of the UV pulse with a FWHM is 18.9 ± 0.6 fs. (e) Spectrum and phase of the retrieved UV pulse (shaded purple area and black lines respectively). The shaded area in the phase represents the standard deviation calculated from 10 reconstructions with different input parameters.
Fig. 3
Fig. 3
(a) Experimental spectrogram obtained by an XUV pump – UV probe photoelectron measurement in argon. The main band has been removed (see text for details). Top: integrated photoelectron signal along the kinetic energy axis for the upper sideband in the region highlighted by the dotted lines. (b) Retrieved spectrogram using STRIPE. Experimental spectrum (shaded area) and retrieved phase for (c) the UV and (d) the XUV pulses and corresponding intensity profiles in the temporal domain (e, f). The grey shaded area represents the standard deviation calculated from 10 reconstructions with different input parameters.
Fig. 4
Fig. 4
Upper sideband obtained by an XUV pump – UV probe photoelectron measurement in argon (top) and integrated signals along the kinetic energy axis (bottom) for UV central wavelengths of (a) 257 nm and (b) 287 nm.
Fig. 5
Fig. 5
(a) Schematic representation of the decay pathways describing the electrocyclic ring-opening reaction of CHD as inferred from different works in literature,. Inset: chemical structure of CHD. (b) 2D map of photoelectron spectra. (c) Temporal lineouts of the integrated signals (solid lines) labelled as I and II in panel (b) and their least-squares fitting (dotted lines).

References

    1. Borrego-Varillas, R., Lucchini, M. & Nisoli, M. Attosecond spectroscopy for the investigation of ultrafast dynamics in atomic, molecular and solid-state physics. Rep. Prog Phys. 85, 006401 (2022). - PubMed
    1. Stolow, A. Femtosecond time-resolved photoelectron spectroscopy of polyatomic molecules. Annu. Rev. Phys. Chem. 54, 89–119 (2003). - PubMed
    1. Stolow, A., Bragg, A. E. & Neumark, D. M. Femtosecond time-resolved photoelectron spectroscopy. Chem. Rev. 104, 1719–1758 (2004). - PubMed
    1. Suzuki, T. Time-resolved photoelectron spectroscopy of non-adiabatic electronic dynamics in gas and liquid phases. Int. Rev. Phys. Chem. 31, 265–318 (2012).
    1. Stolow, A. Time-resolved photoelectron spectroscopy: Non-adiabatic dynamics in polyatomic molecules. Int. Rev. Phys. Chem. 22, 377–405 (2003). - PubMed

LinkOut - more resources