. 2024 Dec;21(12):1491-1504.
doi: 10.1038/s41423-024-01228-9. Epub 2024 Oct 29.

Specific ECM degradation potentiates the antitumor activity of CAR-T cells in solid tumors

Affiliations

Specific ECM degradation potentiates the antitumor activity of CAR-T cells in solid tumors

Rui Zheng et al. Cell Mol Immunol. 2024 Dec.

Abstract

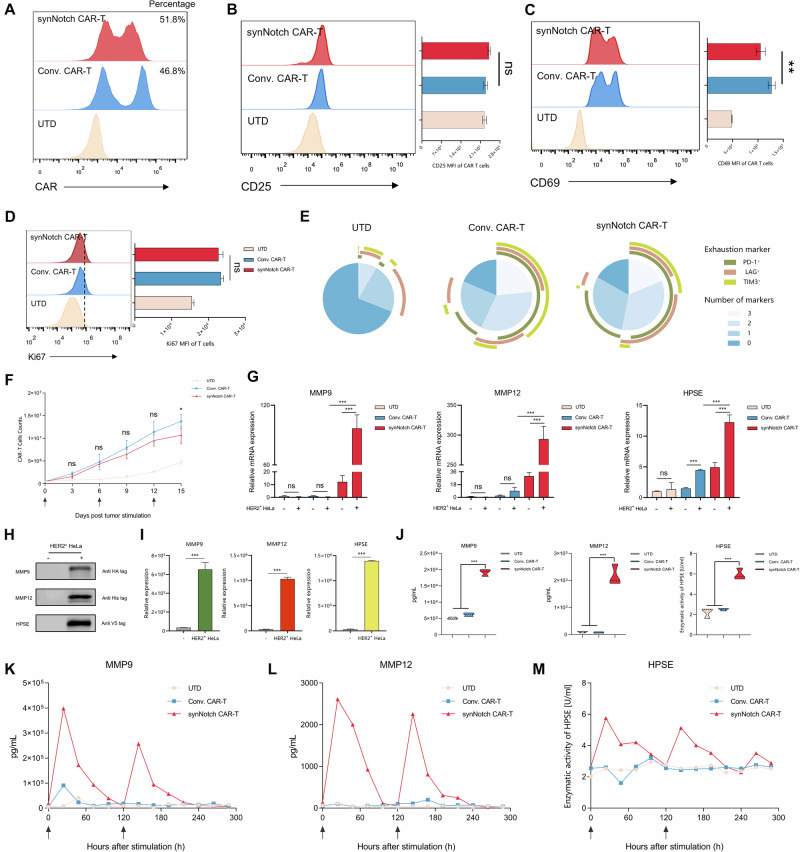
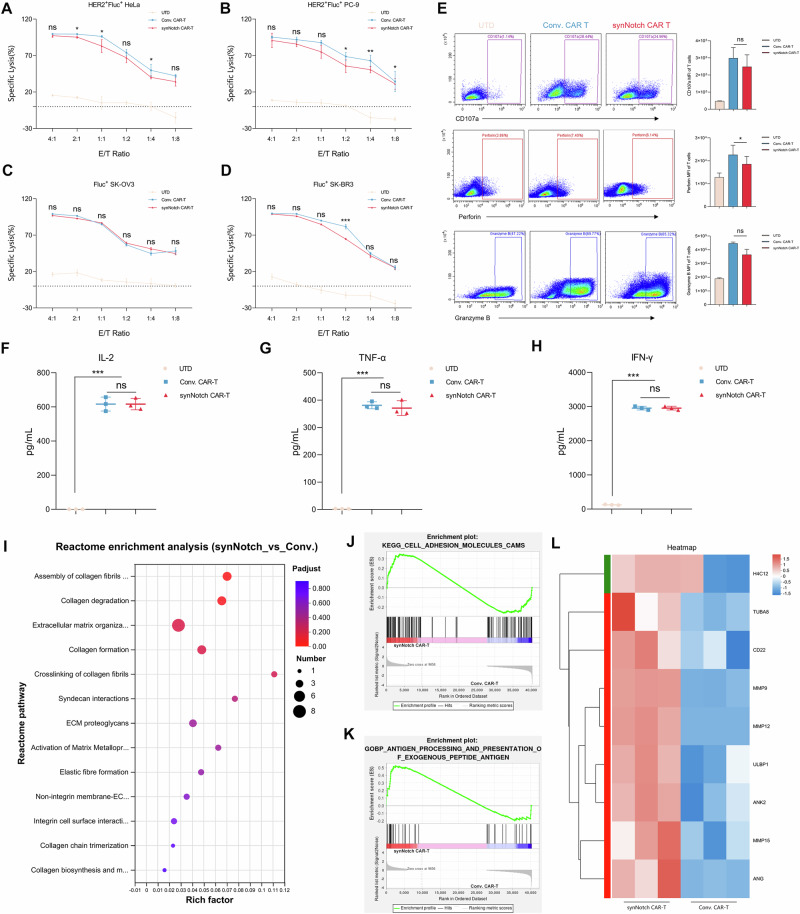
Although major progress has been made in the use of chimeric antigen receptor (CAR)-T-cell therapy for hematological malignancies, this method is ineffective against solid tumors largely because of the limited infiltration, activation and proliferation of CAR-T cells. To overcome this issue, we engineered CAR-T cells with synthetic Notch (synNotch) receptors, which induce local tumor-specific secretion of extracellular matrix (ECM)-degrading enzymes at the tumor site. SynNotch CAR-T cells achieve precise ECM recognition and robustly kill targeted tumors, with synNotch-induced enzyme production enabling the degradation of components of the tumor ECM. In addition, this regulation strongly increased the infiltration of CAR-T cells and the clearance of solid tumors, resulting in tumor regression without toxicity in vivo. Notably, synNotch CAR-T cells also promoted the persistent activation of CAR-T cells in patient-derived tumor organoids. Thus, we constructed a synthetic T-cell system that increases the infiltration and antitumor function of CAR-T cells, providing a strategy for targeting ECM-rich solid tumors.

Keywords: CAR-T cells; ECM-degrading enzymes; Infiltration; synNotch receptor.


Conflict of interest statement

Competing interests: The authors declare that the research was conducted in the absence of any commercial or financial relationships that could be construed as potential conflicts of interest.

Figures

Fig. 1
Fig. 1
Design and characterization of synNotch receptor-regulated enzymes in human primary T cells. A Representative FCM distributions showing CAR expression on engineered primary human T cells. FCM assays of the expression of the indicated markers. The activation markers CD25 B and CD69 C on the surface of T cells. The T-cell proliferative marker Ki67 D in T cells treated with fixation/permeabilization buffer. E Schematic of the coexpression of inhibitory receptors with single-, double-, and triple-positive expression of LAG3, PD-1, and TIM3. F UTD or CAR-T cells were cultured and intermittently stimulated with HER2+ HeLa cells (black arrows). The cells were then counted on the indicated days, and the numbers of cells were plotted. G Relative mRNA expression in T cells. UTD or CAR-T cells were stimulated with HER2+ HeLa cells, followed by qPCR validation of the pre- and poststimulation expression levels of MMP9, MMP12 and HPSE. Concentrations of the MMP9, MMP12 and HPSE proteins in the supernatants of T cells stimulated with HER2+ HeLa cells for 24 h, as determined via H, I Western blotting and J ELISAs. KM Production of K MMP9, L MMP12 and M HPSE by UTD/CAR-T cells intermittently stimulated with HER2+ HeLa cells (black arrows). All the data are shown as the means ± SDs. One-way ANOVA was applied for BD and GJ. Asterisks indicate a statistically significant difference; ns not significant; **P ≤ 0.01; ***P ≤ 0.001
Fig. 2
Fig. 2
CAR-T cells loaded with the synNotch receptor-regulated enzyme exhibit cytotoxicity comparable to that of Conv. CAR-T cells. CAR-T cells were incubated with HER2+ malignant cells A HER2+ HeLa cells, B HER2+ PC-9 cells, C SK-OV3 cells and D SK-BR3 cells at the indicated E/T ratios, and the percentages of cell lysis were calculated and plotted. E Representative FCM distributions showing the levels of CD107a, Granzyme B and perforin in UTD/CAR-T cells cocultured with HER2+ HeLa cells for 6 h at E/T = 1:1. Cytokine profiling of IL-2 F, TNF-α G and IFN-γ H in supernatants isolated from UTD/CAR-T cells cocultured with HER2+ HeLa cells for 16 h at E/T = 2:1. UTD/CAR-T cells were primed by incubation with HER2+ HeLa cells for 24 h at an E:T ratio of 2:1, after which the T cells were collected, and RNA-seq was performed. The obtained data were subjected to reactome enrichment analysis I and gene set enrichment analysis (GSEA) J, K, and the genes enriched in the reactome analysis are shown on a heatmap L. All the data are presented as the means ± SDs. One-way ANOVA was applied for AH. Asterisks indicate significant differences between Conv. CAR-T and synNotch CAR-T cells. ns not significant; *P ≤ 0.05; **P ≤ 0.01; ***P ≤ 0.001
Fig. 3
Fig. 3
Specific enzyme expression increases the infiltration and survival of CAR-T cells in vitro. A Schematic diagram of the design of the Transwell assays. The Matrigel matrix was spread over the whole upper chamber, and HER2+ HeLa cells were seeded on the Matrigel matrix. Then, UTD or CAR-T cells were added to the upper chamber. Thirty-six hours later, T cells from the upper and lower chambers were imaged B and counted C. Scale bars: 20 μm. D A schematic diagram of another Transwell assays. The Matrigel matrix mixed with MSLN protein was spread on the whole upper chamber, and then UTD or CAR-T cells were added to the upper chamber. After 36 h, the tumor cells in the lower chambers were imaged E, and the percentages of cell lysis were calculated and plotted F. Scale bars: 20 μm. T cells from the upper and lower chambers were collected and subjected to FCM analysis of the cell phenotype G and the percentages of CD4+ and CD8+ cells H. I A schematic diagram of the design of the 2.5D tumor spheroid experiments. J Representative images showing the infiltration of UTD or CAR-T cells. UTD/CAR-T cells were stained with CytoTell™ Red650 and are presented in purple. Apoptotic cells were detected via CellEvent™ Caspase-3/7 Green and are presented in green. Scale bars: 200 μm. K Concentrations of MMP9 and MMP12 and HPSE activity in the supernatants of T cells cultured with the 2.5D tumor model. Representative images of the fluorescence intensity of apoptotic cells L and CAR-T cells M in J. FCM analysis of the expression of exhaustion markers N and apoptosis O in CAR-T cells cocultured with 2.5D tumor spheroids. All the data are presented as the mean ± SD. One-way ANOVA was applied for C, FH, LM and K. An unpaired two-tailed Student’s t test was applied for O. Asterisks indicate significant differences. ns not significant; *P ≤ 0.05; **P ≤ 0.01; *** P ≤ 0.001
Fig. 4
Fig. 4
CAR-T cells with specific enzyme production induced by the synNotch reporter exhibit superior tumor infiltration of immune cells and antitumor activity in vivo. A Schematic diagram of the inoculation of NSG mice and treatment with infused CAR-T cells and additional PBMCs labeled with CTR. BD Concentrations of MMP9 and MMP12 and the activity of HPSE in the TME. E Representative images of tumor tissues subjected to H&E staining and IHC for CD45, HA-tag, His-tag and V5-tag (black arrows) after 7 days of treatment with UTD or CAR-T cells. Scale bars: 50 μm. F Representative images showing frozen sections of CTR+ PBMCs and statistical analysis of tumor tissues treated with UTD or CAR-T cells for 7 days. Nuclei were stained with DAPI (blue). Scale bars: 25 μm. Representative FCM distributions showing G CTR+, H CD45+, I CAR+ and J CD4+/CD8+ cells and the percentages of these cells. K Average tumor growth kinetics in different treatment groups. (UTD: n = 4, CAR-T: n = 5). Cytokine profiles of L human IL-2 (hIL-2), M TNF-α (hTNF-α), and N IFN-γ (hIFN-γ) in the tumor tissues of the mice treated with UTD or CAR-T cells for 7 days. All the data are presented as the means ± SDs. One-way ANOVA was applied for BD, FI and KN. An unpaired two-tailed Student’s t test was applied for J. Asterisks indicate significant differences. ns not significant; *P ≤ 0.05; **P ≤ 0.01; ***P ≤ 0.001
Fig. 5
Fig. 5
SynNotch CAR-T cells exhibit superior antitumor efficacy against solid tumors, have a good safety profile and induce memory T-cell subsets in vivo. A Schematic diagram of the inoculation of NSG mice and treatment with infused CAR-T cells. B The mice in A were subjected to BLI imaging on the indicated days postadministration of CAR-T cells. The total tumor flux C and survival D of the treated mice in A were recorded and plotted. E Representative FCM distributions showing the percentage of CAR-T cells in the tumors of the mice treated with UTD or CAR-T cells. F The concentrations of mouse IL-6 (mIL-6), CCL4, CXCL9 and CXCL10 in the serum of the mice treated for 28 days. G–L Representative FCM distributions showing the percentage of positive cells in the spleen GI and PB JL of mice after UTD or CAR-T-cell infusion for 28 days. The percentages of G, J CD45+ CD3+ cells, H, K CD4+/CD8+ cells and I, L T-cell phenotypes. All the data are presented as the means ± SDs. One-way ANOVA was applied for C, E and FJ. The log-rank (Mantel‒Cox) test was applied for D. An unpaired two-tailed Student’s t test was applied for HL. Asterisks indicate significant differences. ns not significant; *P ≤ 0.05; ** P ≤ 0.01; *** P ≤ 0.001
Fig. 6
Fig. 6
SynNotch receptor-regulated enzymes drive increased CAR-T-cell infiltration into PDOs. A A schematic diagram of the investigation of cytotoxicity in HER2+ MSLN+ OC organoids. OC organoids resected from patients were cultured and treated with CAR-T cells after confirming positivity for HER2 and MSLN antigen expression in the corresponding tissues. B Concentrations of MMP9 and MMP12 and the activity of HPSE in the supernatants of T cells cultured with HER2+ MSLN+ OC organoids. C Representative images showing the infiltration of UTD or CAR-T cells into HER2+ MSLN+ OC organoids. UTD/CAR-T cells were stained with CytoTell™ Red650 and are presented in purple. Apoptotic cells were detected via CellEvent™ Caspase-3/7 Green and are presented in green. Scale bars: 100 μm. (for data from additional records, see also Movie S2). D, E Representative images of the fluorescence intensity of CAR-T cells D and Caspase 3/7 E in C. F, G FCM assays of UTD or CAR-T cells cocultured with HER2+ MSLN+ OC organoids. Expression of the activation marker CD25 (F) and the proliferative marker Ki67 G on the surface of T cells isolated from OC organoids. H CytoTell Red 650 tracking of T cells and representative FCM distributions showing T-cell proliferation. T cells were cocultured with HER2+ MSLN+ OC organoids and subjected to FCM analysis of the cell phenotype I, percentage of CD4+ and CD8+ cells J and degree of apoptosis K. All the data are presented as the means ± SDs. One-way ANOVA was applied for B, FG and IK. An unpaired two-tailed Student’s t test was applied for D–E. Asterisks indicate significant differences. ns: not significant; *P ≤ 0.05; **P ≤ 0.01; ***P ≤ 0.001

References

    1. Rafiq S, Hackett CS, Brentjens RJ. Engineering strategies to overcome the current roadblocks in CAR T cell therapy. Nat Rev Clin Oncol. 2020;17:147–67. - PMC - PubMed
    1. Maus MV. A decade of CAR T-cell evolution. Nat Cancer. 2022;3:270–1. - PubMed
    1. Adachi K, Kano Y, Nagai T, Okuyama N, Sakoda Y, Tamada K. IL-7 and CCL19 expression in CAR-T cells improves immune cell infiltration and CAR-T-cell survival in the tumor. Nat Biotechnol. 2018;36:346–51. - PubMed
    1. Tian Y, Li Y, Shao Y, Zhang Y. Gene modification strategies for next-generation CAR T cells against solid cancers. J Hematol Oncol. 2020;13:54. - PMC - PubMed
    1. Zhao Z, Xiao X, Saw PE, Wu W, Huang H, Chen J, et al. Chimeric antigen receptor T cells in solid tumors: a war against the tumor microenvironment. Sci China Life Sci. 2020;63:180–205. - PubMed

Substances

LinkOut - more resources