. 2024 Oct 29;24(Suppl 4):318.
doi: 10.1186/s12911-024-02719-5.

Predicting clinical events characterizing the progression of amyotrophic lateral sclerosis via machine learning approaches using routine visits data: a feasibility study

Affiliations

Predicting clinical events characterizing the progression of amyotrophic lateral sclerosis via machine learning approaches using routine visits data: a feasibility study

Alessandro Guazzo et al. BMC Med Inform Decis Mak. .

Abstract

Background: Amyotrophic lateral sclerosis (ALS) is a progressive neurodegenerative disease that results in death within a short time span (3-5 years). One of the major challenges in treating ALS is its highly heterogeneous disease progression and the lack of effective prognostic tools to forecast it. The main aim of this study was, then, to test the feasibility of predicting relevant clinical outcomes that characterize the progression of ALS with a two-year prediction horizon via artificial intelligence techniques using routine visits data.

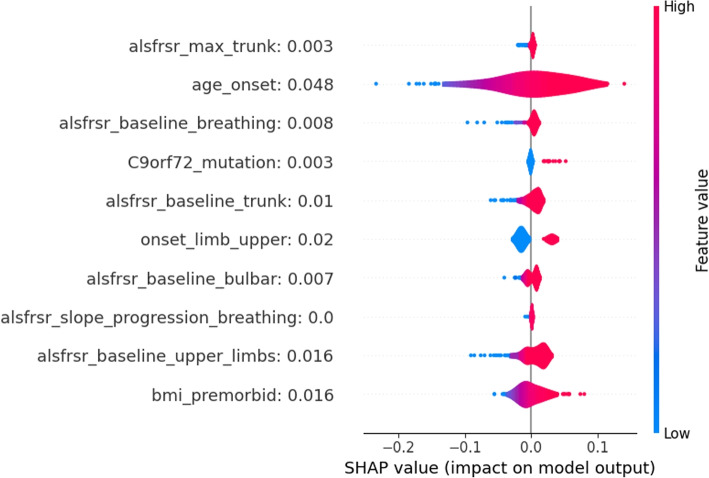
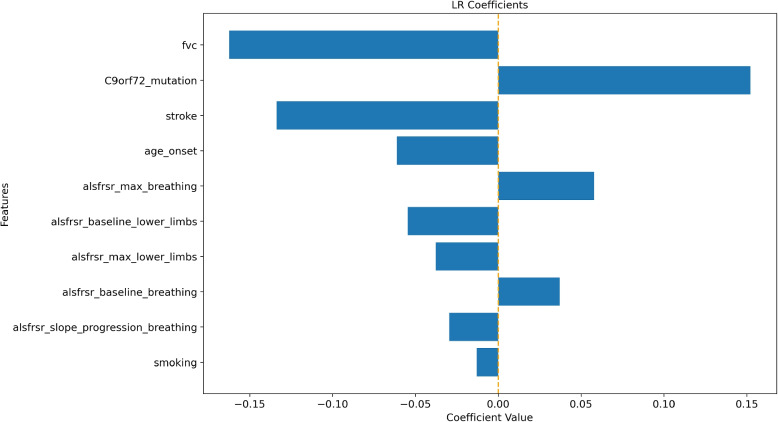
Methods: Three classification problems were considered: predicting death (binary problem), predicting death or percutaneous endoscopic gastrostomy (PEG) (multiclass problem), and predicting death or non-invasive ventilation (NIV) (multiclass problem). Two supervised learning models, a logistic regression (LR) and a deep learning multilayer perceptron (MLP), were trained ensuring technical robustness and reproducibility. Moreover, to provide insights into model explainability and result interpretability, model coefficients for LR and Shapley values for both LR and MLP were considered to characterize the relationship between each variable and the outcome.

Results: On the one hand, predicting death was successful as both models yielded F1 scores and accuracy well above 0.7. The model explainability analysis performed for this outcome allowed for the understanding of how different methodological approaches consider the input variables when performing the prediction. On the other hand, predicting death alongside PEG or NIV proved to be much more challenging (F1 scores and accuracy in the 0.4-0.6 interval).

Conclusions: In conclusion, predicting death due to ALS proved to be feasible. However, predicting PEG or NIV in a multiclass fashion proved to be unfeasible with these data, regardless of the complexity of the methodological approach. The observed results suggest a potential ceiling on the amount of information extractable from the database, e.g., due to the intrinsic difficulty of the prediction tasks at hand, or to the absence of crucial predictors that are, however, not currently collected during routine practice.

Keywords: Amyotrophic lateral sclerosis; Explainability; Logistic regression; Multi-layer perceptron.


Conflict of interest statement

The authors declare no competing interests.

Figures

Fig. 1
Fig. 1
LR coefficients for the 10 most impactful variables of the death prediction model. Positive coefficients (right side of the axis) are associated with factors that may increase the likelihood of death. Negative coefficients are associated with factors that may decrease the death probability
Fig. 2
Fig. 2
Pearson’s correlation coefficients for all variables combinations. The color blue is associated with a positive correlation meanwhile the color red signals a negative correlation
Fig. 3
Fig. 3
SHAP values distributions for the 10 most impactful variables of the LR death model. Positive SHAP values (right side of the figure) are associated with an increase in death probability. Negative SHAP values are associated with a decrease in death probability. Distributions are color-coded, red portions are associated with high variable values while blue portions with low variable values
Fig. 4
Fig. 4
SHAP values distributions for the 10 most impactful variables of the MLP death model. Positive SHAP values (right side of the figure) are associated with an increase in death probability. Negative SHAP values are associated with a decrease in death probability. Distributions are color-coded, red portions are associated with high variable values while blue portions with low variable values
Fig. 5
Fig. 5
LR coefficients for the 10 most impactful variables of the death or PEG model. Positive coefficients (right side of the axis) are associated with factors that may increase the likelihood of the outcome. Negative coefficients are associated with factors that may decrease the outcome probability
Fig. 6
Fig. 6
SHAP values distributions for the 10 most impactful variables of the LR death or PEG model. Positive SHAP values (right side of the figure) are associated with an increase in outcome probability. Negative SHAP values are associated with a decrease in outcome probability. Distributions are color-coded, red portions are associated with high variable values while blue portions with low variable values
Fig. 7
Fig. 7
SHAP values distributions for the 10 most impactful variables of the MLP death or PEG model. Positive SHAP values (right side of the figure) are associated with an increase in outcome probability. Negative SHAP values are associated with a decrease in outcome probability. Distributions are color-coded, red portions are associated with high variable values while blue portions with low variable values
Fig. 8
Fig. 8
LR coefficients for the 10 most impactful variables of the death or NIV model. Positive coefficients (right side of the axis) are associated with factors that may increase the likelihood of the outcome. Negative coefficients are associated with factors that may decrease the outcome probability
Fig. 9
Fig. 9
SHAP values distributions for the 10 most impactful variables of the LR death or NIV model. Positive SHAP values (right side of the figure) are associated with an increase in outcome probability. Negative SHAP values are associated with a decrease in outcome probability. Distributions are color-coded, red portions are associated with high variable values while blue portions with low variable values
Fig. 10
Fig. 10
SHAP values distributions for the 10 most impactful variables of the MLP death or NIV model. Positive SHAP values (right side of the figure) are associated with an increase in outcome probability. Negative SHAP values are associated with a decrease in outcome probability. Distributions are color-coded, red portions are associated with high variable values while blue portions with low variable values

References

    1. Brown RH, Al-Chalabi A. Amyotrophic lateral sclerosis. N Engl J Med. 2017.
    1. Atassi N, Berry J, Shui A, Zach N, Sherman A, Sinani E, et al. The PRO-ACT database: design, initial analyses, and predictive features. Neurology. 2014. - PMC - PubMed
    1. Tavazzi E, Daberdaku S, Zandoná A, Vasta R, Nefussy B, Lunetta C, et al. Predicting functional impairment trajectories in amyotrophic lateral sclerosis: a probabilistic, multifactorial model of disease progression. Neurology. 2022. - PMC - PubMed
    1. Martins AS, Gromicho M, Pinto S, de Carvalho M, Madeira SC. Learning prognostic models using disease progression patterns: predicting the need for non-invasive ventilation in amyotrophic lateral sclerosis. IEEE/ACM Trans Comput Biol Bioinforma. 2021. - PubMed
    1. Ackrivo J, Hansen-Flaschen J, Wileyto EP, Schwab RJ, Elman L, Kawut SM. Development of a prognostic model of respiratory insufficiency or death in amyotrophic lateral sclerosis. Eur Respir J. 2019. - PMC - PubMed

LinkOut - more resources