. 2024 Oct 11:18:1465531.
doi: 10.3389/fncel.2024.1465531. eCollection 2024.

Quantitative, real-time imaging of spreading depolarization-associated neuronal ROS production

Affiliations

Quantitative, real-time imaging of spreading depolarization-associated neuronal ROS production

Marc André Ackermann et al. Front Cell Neurosci. .

Abstract

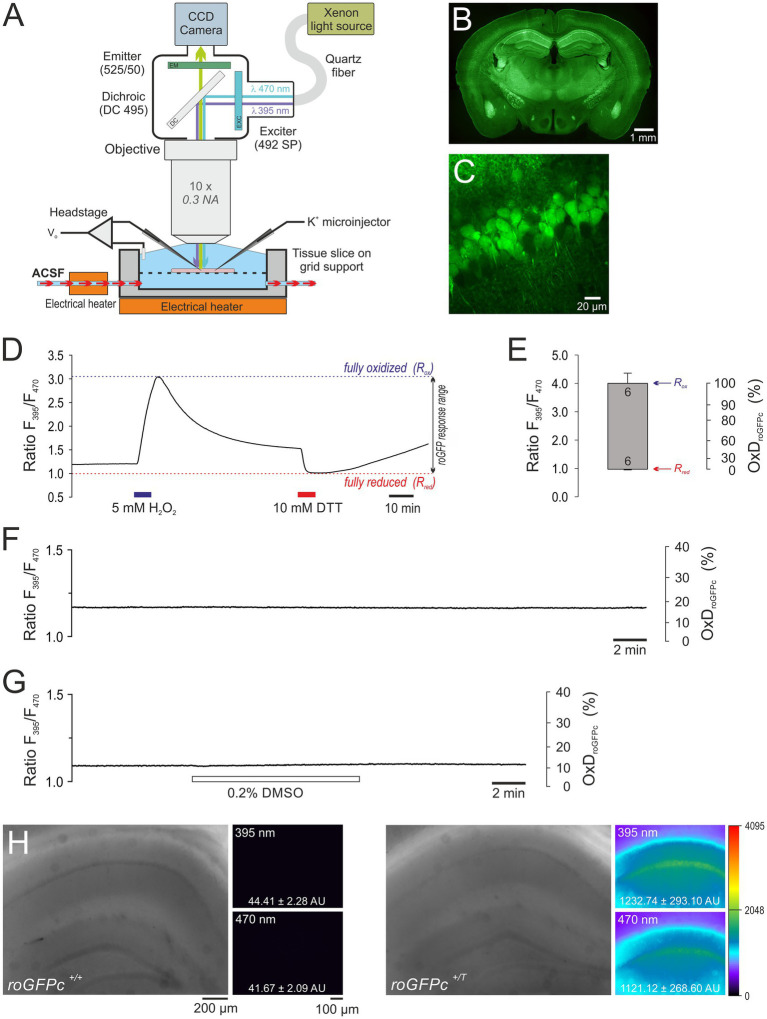
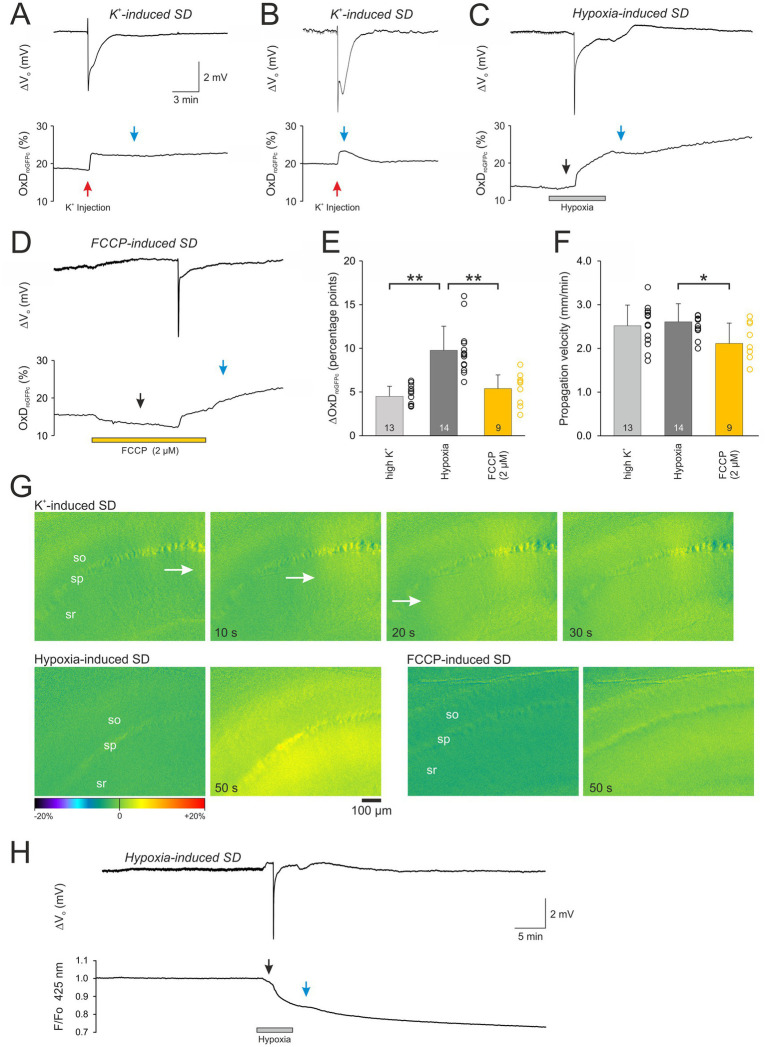
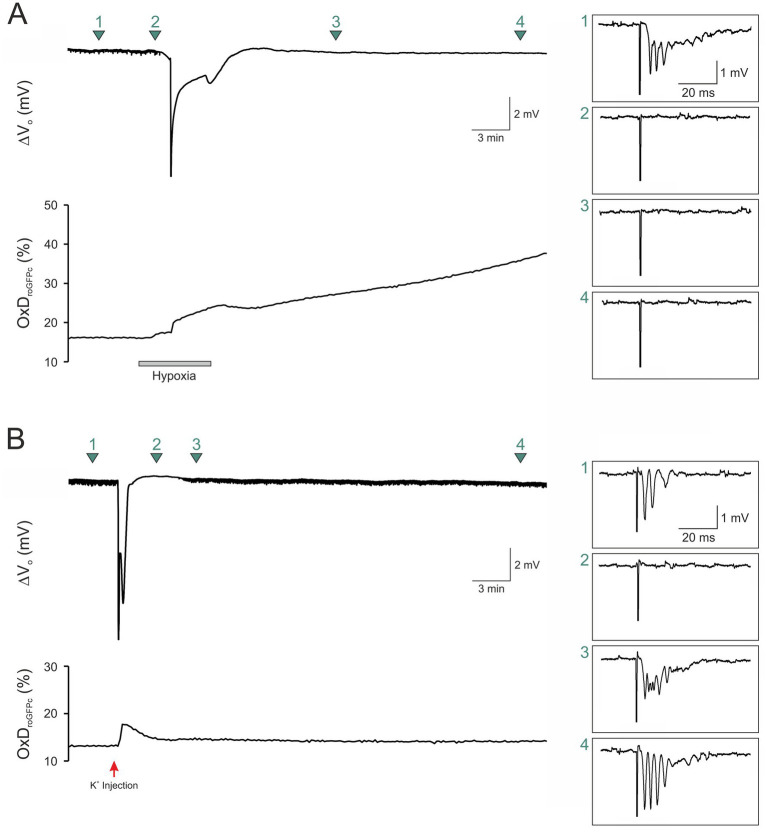
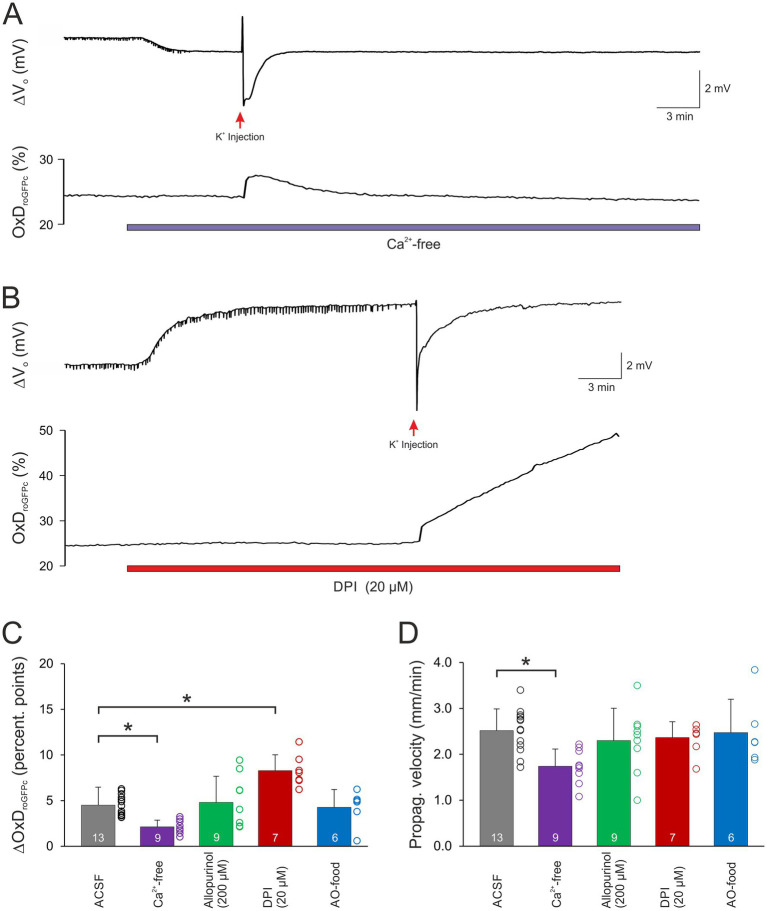
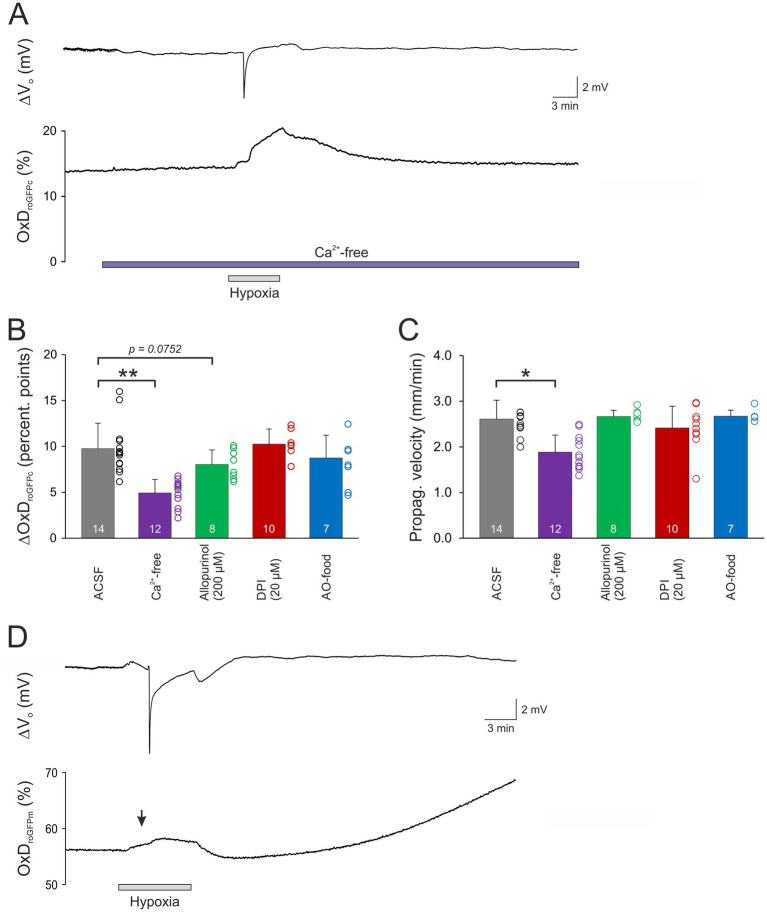
Spreading depolarization (SD) causes a massive neuronal/glial depolarization, disturbs ionic homeostasis and deranges neuronal network function. The metabolic burden imposed by SD may also generate marked amounts of reactive oxygen species (ROS). Yet, proper optical tools are required to study this aspect with spatiotemporal detail. Therefore, we earlier generated transgenic redox indicator mice. They express in excitatory projection neurons the cytosolic redox-sensor roGFP, a reduction/oxidation sensitive green fluorescent protein which is ratiometric by excitation and responds reversibly to redox alterations. Using adult male roGFPc mice, we analyzed SD-related ROS production in CA1 stratum pyramidale of submerged slices. SD was induced by K+ microinjection, O2 withdrawal or mitochondrial uncoupling (FCCP). The extracellular DC potential deflection was accompanied by a spreading wavefront of roGFP oxidation, confirming marked neuronal ROS generation. Hypoxia-induced SD was preceded by a moderate oxidation, which became intensified as the DC potential deflection occurred. Upon K+-induced SD, roGFP oxidation slowly recovered within 10-15 min in some slices. Upon FCCP-or hypoxia-induced SD, recovery was limited. Withdrawing extracellular Ca2+ markedly dampened the SD-related roGFP oxidation and improved its reversibility, confirming a key-role of neuronal Ca2+ load in SD-related ROS generation. Neither mitochondrial uncoupling, nor inhibition of NADPH oxidase or xanthine oxidase abolished the SD-related roGFP oxidation. Therefore, ROS generation during SD involves mitochondria as well as non-mitochondrial sources. This first-time analysis of SD-related ROS dynamics became possible based on quantitative redox imaging in roGFP mice, an advanced approach, which will contribute to further decipher the molecular understanding of SD in brain pathophysiology.

Keywords: mitochondria; oxidative stress; reactive oxygen species; redox imaging; roGFP; spreading depression.


Conflict of interest statement

The authors declare that the research was conducted in the absence of any commercial or financial relationships that could be construed as a potential conflict of interest.

Figures

Figure 1
Figure 1
Combined electrophysiological and optical redox imaging experiments in acute slices from roGFPc redox indicator mice. (A) Sensitive detection of roGFP fluorescence demands an immersion objective. Thus we were facing the challenge of eliciting SD in submerged brain tissue slices. To ensure tissue viability at the required experimental temperature of 35.5–36.0°C, high flow rates of ACSF (8 mL/min), a slice thickness of 350 μm, and unrestricted access of fresh solution to the upper and lower slice surface turned out to be crucial. SD was triggered by either O2 withdrawal, mitochondrial uncoupling or K+ microinjection into the slice. (B) PFA-fixed transverse slice (30 μm thickness) of a female roGFPc mouse (6 month old) showing the widespread expression of the redox indicator. Note the particularly high expression in hippocampus and the CA1 subfield. The displayed overview is a stitched composition of 12 smaller images; roGFPc fluorescence is displayed in pseudo-colors. (C) Close-up view of the CA1 pyramidal cell layer confirming the expression of roGFPc in virtually every pyramidal neuron. Image was taken from an acute brain tissue slice (400 μm thickness, 3 weeks old female roGFPc mouse) with a 2-photon imaging system (TrimScope 2, LaVision BioTec) at 740 nm excitation and 195 nm/pixel resolution. (D) Response calibration of roGFPc recorded in stratum pyramidale of the hippocampal CA1 subfield. It represents the maximum oxidation (Rox) and reduction (Rred) of roGFPc induced by exposure to H2O2 and DTT, respectively. During calibration, sufficiently long wash-out and recovery times are essential to prevent direct interactions of the two redox-active compounds. (E) Determined roGFPc response range. The upper margin of the box represents the averaged Rox, the lower margin the averaged Rred. Error bars represent the respective standard deviations; the number of slices measured is indicated. Based on the determined calibration parameters, the average degree of roGFPc oxidation (OxDroGFPc) is calculated for quantitative redox analysis. (F) Control recording confirming that repeated illumination per se does not evoke any obvious changes in roGFPc ratio. In the displayed experiment a 3-fold increased frame rate of 0.33 Hz was applied. (G) The solvent DMSO (0.2%, 15 min) did not markedly affect roGFPc fluorescence. (H) Comparing slices from roGFPc transgenic (roGFPc+/T) and non-transgenic (roGFPc+/+) male mice (5 months old siblings) confirms that a contribution of tissue autofluorescence is of no concern. Hardly any fluorescence could be detected in non-transgenic slices. Overview images were taken with an 5x objective and white light illumination. Fluorescence images were acquired under imaging conditions using the 10x water immersion objective. Excitation wavelengths are indicated, and the averaged pixel intensities of the entire fluorescence image are reported in arbitrary units (AU). Fluorescence intensities are displayed in a 12 bit pseudocolor palette spanning 4,096 intensity levels.
Figure 2
Figure 2
The different modes of SD evoke a pronounced oxidative shift in cellular redox balance. (A,B) Normoxic, K+-induced SD recorded as extracellular DC potential deflection (ΔVo) with the associated redox alterations expressed as degree of roGFPc oxidation (OxDroGFPc). Note the variable reversibility of the redox changes. Red arrows indicate the time point of K+ microinjection, blue arrows the time point at which roGFPc oxidation was quantified. (C) Hypoxia (N2 + 2 mM sulfite)-induced SD with the associated irreversible redox alterations. Note that a moderate roGFPc oxidation started already before SD onset (black arrow). (D) FCCP-induced SD with associated irreversible redox alterations. Administration of FCCP and the resulting mitochondrial uncoupling evoked a noticeable reducing shift before SD occurred (black arrow). (E) Magnitude of the SD-related oxidative changes in the neuronal cytosolic redox balance. Plotted are the changes in the degree of roGFP oxidation (ΔOxDroGFPc) as mean ± standard deviation; the number of slices analyzed is reported for each bar. The dots next to each bar represent the scatter of the underlying data points. Note that most pronounced redox changes occurred during HSD. The extent of roGFPc oxidation was quantified either at the peak or in those conditions not reaching a clear peak, 300 s after SD onset, see blue arrow marks. (F) Propagation velocity of the oxidative wavefront during the different modes of SD. Propagation of SD was lowest in the case of FCCP-induced SDs. Asterisks indicate significantly different changes (* p < 0.05, ** p < 0.01; one way ANOVA and Holm-Šídák comparison versus hypoxic SD). (G) Image series depicting the onset and propagation of the SD-associated redox wavefronts for the conditions of K+-, hypoxia-, and FCCP-induced SDs. The hippocampal layers are indicated (so stratum oriens, sp stratum pyramidale, sr stratum radiatum). Time tags of the respective images indicate the time passed from the first images displayed. Scale bar is identical for all images. The white arrows indicate the propagating wavefront. Images are subtraction images (first image of the time series subtracted from all subsequent images). The displayed changes in roGFPc fluorescence ratios (± 20% range) are displayed in pseudo-colors, with warmer colors indicating a change toward oxidation (i.e., increased roGFPs ratios). (H) Imaging roGFPc fluorescence at its isosbestic point (425 nm excitation) reveals the non-redox-related optical changes during HSD, most of which can be expected to be cell swelling diluting the cytosolic fluorophore concentration. A recovery of the fluorescence decrease did not occur upon reoxygenation.
Figure 3
Figure 3
Sustained roGFP oxidation is accompanied by a loss of cellular viability. (A) Eliciting fEPSPs (1.0 mA orthodromic stimuli) revealed a loss of synaptic function during hypoxia even before HSD onset. Upon reoxygenation, neither the roGFPc oxidation nor synapses recovered. Green arrow marks indicate the exact time points at which the displayed fEPSPs were recorded. Stimulation artifacts were truncated to fit the boxes. (B) Normoxic, K+-induced SD also blocked synaptic function, but within minutes, roGFPc oxidation as well as fEPSPs (0.5 mA orthodromic stimuli) fully recovered. Red arrow indicates the time point of K+ microinjection.
Figure 4
Figure 4
Modulation of normoxic SD-related redox changes. (A) Ca2+ withdrawal dampened the roGFPc oxidation associated with normoxic SD. Furthermore, the oxidative shift became fully reversible. (B) Upon pre-treatment with DPI (20 μM, 15 min), the SD-associated roGFPc oxidation became irreversible. Wash-in of DPI caused a positive shift of the extracellular DC potential, which is due to an offset induced by this compound at the reference electrode; it occurred in all experiments with DPI and averaged 5.3 ± 3.7 mV (n = 17). (C) Magnitude of the normoxic SD-associated oxidative shift, quantified as changes in OxDroGFPc. In Ca2+-free solutions, the oxidative shift was significantly less pronounced, in the presence of DPI it became more intense (*p < 0.05; one way ANOVA on ranks with Dunn’s test multiple comparisons versus ACSF). (D) The propagation velocity of the oxidative wavefront during normoxic SD was not significantly affected by most treatments. Only upon withdrawal of extracellular Ca2+ a slower propagation was observed (*p < 0.05; one way ANOVA and Holm-Šídák multiple comparisons versus ACSF).
Figure 5
Figure 5
Modulation of HSD-related redox changes. (A) In the absence of extracellular Ca2+ the magnitude of the roGFPc oxidation associated with HSD was significantly dampened and became largely reversible upon reoxygenation. (B) Statistical summary of the redox alterations confirms a significant decrease in Ca2+ free solution and a tendency of dampening upon allopurinol treatment. The number of slices studied is indicated for each group (**p < 0.01; one way ANOVA with Holm-Šídák multiple comparisons versus ACSF). (C) The propagation velocity of the oxidative wavefront was also decreased in Ca2+ free solutions, whereas the other treatments did not mediate any significant changes. The number of slices is reported (*p < 0.05, Kruskal Wallis one way ANOVA on ranks with Dunn’s test multiple comparisons versus ACSF). (D) HSD-induced oxidation of mitochondrial matrix. Mice expressing roGFP in mitochondria (roGFPm mice) revealed that mitochondrial matrix shows markedly less intense redox changes than cytosol. Induction of hypoxia evoked already a moderate oxidation (see black arrow mark). As HSD occurred, this initial oxidation became only slightly more intense and it quickly recovered upon reoxygenation, before mitochondrial matrix then underwent a secondary, slowly progressing oxidation for the remaining duration of the experiment. Note that redox baseline-conditions in mitochondrial matrix are more oxidized than in cytosol.

Similar articles

Cited by

References

    1. Aboghazleh R., Parker E., Yang L. T., Kaufer D., Dreier J. P., Friedman A., et al. . (2021). Brainstem and cortical spreading depolarization in a closed head injury rat model. Int. J. Mol. Sci. 22. doi: 10.3390/ijms222111642, PMID: - DOI - PMC - PubMed
    1. Abramov A. Y., Scorziello A., Duchen M. R. (2007). Three distinct mechanisms generate oxygen free radicals in neurons and contribute to cell death during anoxia and reoxygenation. J. Neurosci. 27, 1129–1138. doi: 10.1523/JNEUROSCI.4468-06.2007, PMID: - DOI - PMC - PubMed
    1. Adam-Vizi V., Starkov A. A. (2010). Calcium and mitochondrial reactive oxygen species generation: how to read the facts. J. Alzheimers Dis. 20, S413–S426. doi: 10.3233/JAD-2010-100465, PMID: - DOI - PMC - PubMed
    1. Amemori T., Gorelova N. A., Bures J. (1987). Spreading depression in the olfactory bulb of rats: reliable initiation and boundaries of propagation. Neuroscience 22, 29–36. doi: 10.1016/0306-4522(87)90195-3, PMID: - DOI - PubMed
    1. Andrew R. D., Farkas E., Hartings J. A., Brennan K. C., Herreras O., Müller M., et al. . (2022a). Questioning glutamate excitotoxicity in acute brain damage: the importance of spreading depolarization. Neurocrit. Care. 37, 11–30. doi: 10.1007/s12028-021-01429-4, PMID: - DOI - PMC - PubMed

LinkOut - more resources