

The relationship between BMI and physical fitness among 7451 college freshmen: a cross-sectional study in Beijing, China
- PMID: 39473612
- PMCID: PMC11519527
- DOI: 10.3389/fphys.2024.1435157
The relationship between BMI and physical fitness among 7451 college freshmen: a cross-sectional study in Beijing, China
Abstract
Objective: To identify trends in physical fitness test scores of college freshmen and their physical fitness from 2018 to 2021, and to analyze the relationship between college students' Body Mass Index (BMI) and Physical Fitness Index (PFI).
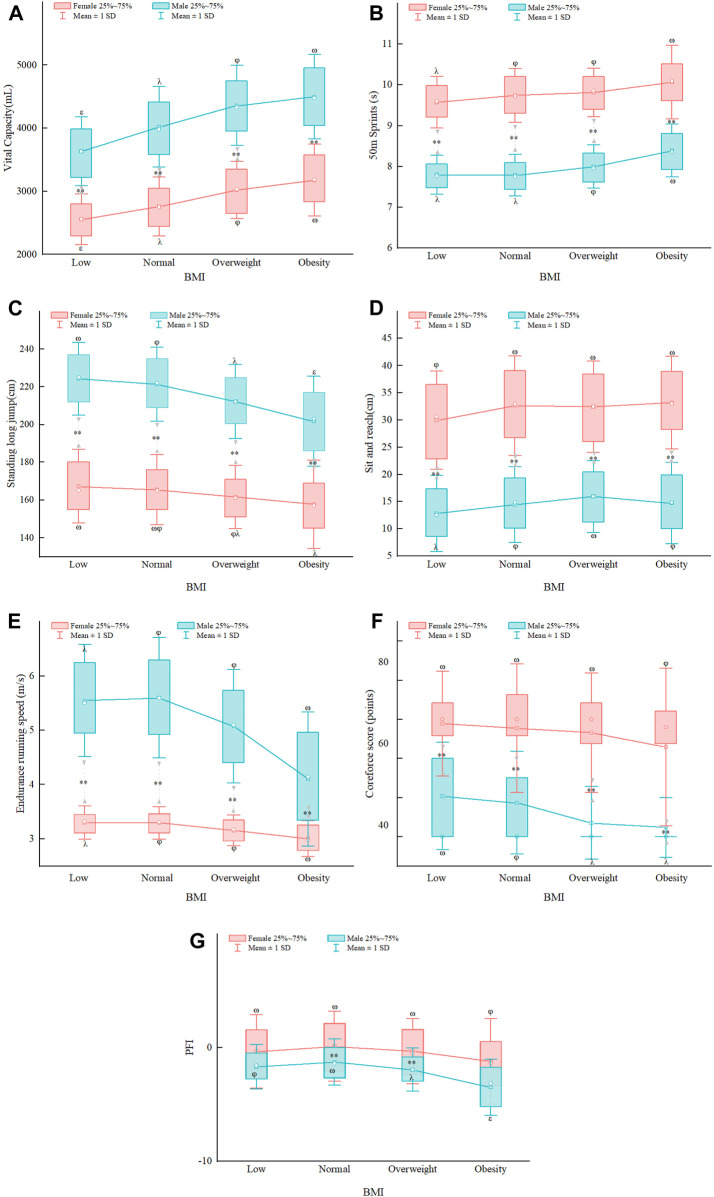
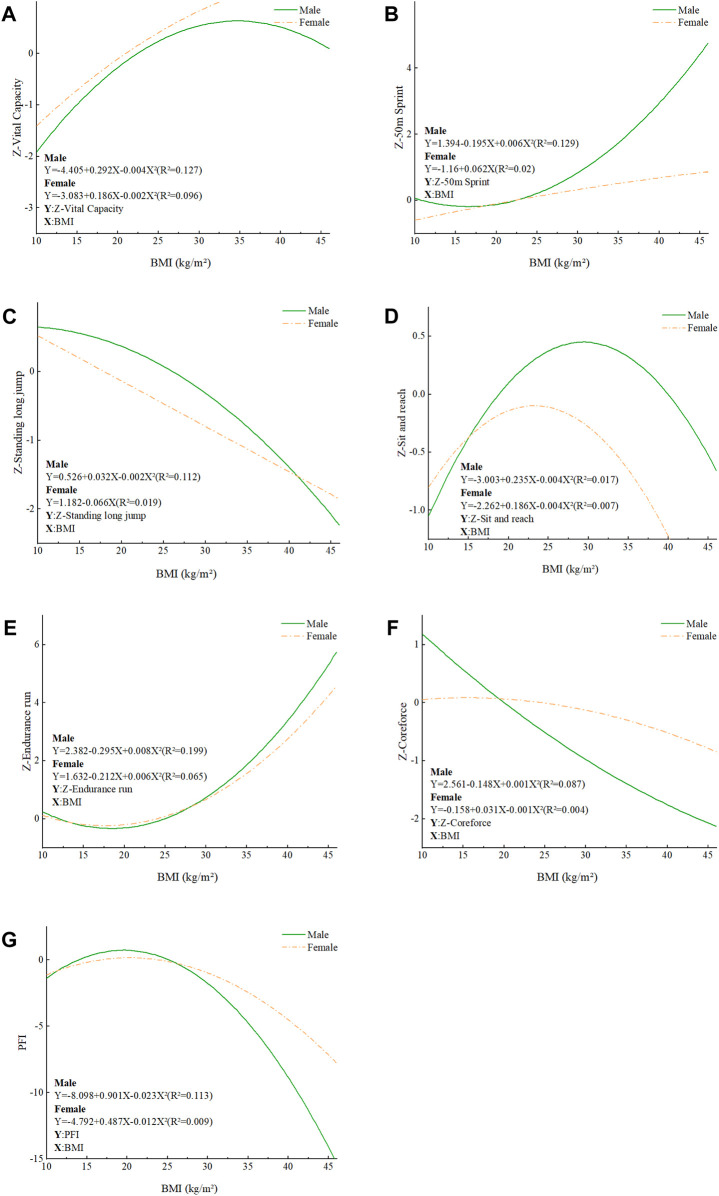
Methods: This study obtained physical fitness test data from 7,541 freshmen at a university in Beijing, China, from 2018 to 2021. Analysis of variance (ANOVA) was used to compare the physical fitness indicators among different BMI levels by gender. A nonlinear quadratic regression model was used to evaluate the relationship between BMI and each indicator within gender groups.
Results: The BMI of freshmen in China was generally increased over the study period, and BMI levels influenced students' physical fitness indexes to varying degrees. BMI was significantly correlated with the physical fitness indexes and PFI. The increase in BMI had a greater influence on the PFI of males than females.
Conclusion: Students with a normal BMI show better physical fitness. A BMI below or above the normal range may result in poor physical fitness. The relationship between BMI and PFI has an inverted u-shaped curve. Physical education programs should be tailored to students with different fitness levels and fundamentals, including but not limited to the development of strength, speed, and other qualities.
Keywords: BMI levels; college freshmen; physical activity; physical education; physical fitness index.
Copyright © 2024 Guo, Shen, Yang and Yang.
Conflict of interest statement
Author FY was employed by Li Ning (China) Sports Goods Company Limited. The remaining authors declare that the research was conducted in the absence of any commercial or financial relationships that could be construed as a potential conflict of interest.
Figures
Similar articles
-
[Comparative research on the relationship between body mass index and physical fitness index among the Uygur, Kazakh and Han ethnic college students].Beijing Da Xue Xue Bao Yi Xue Ban. 2024 Jun 18;56(3):411-417. doi: 10.19723/j.issn.1671-167X.2024.03.006. Beijing Da Xue Xue Bao Yi Xue Ban. 2024. PMID: 38864125 Free PMC article. Chinese.
-
Relationship between body mass index and physical fitness index in Chinese college students: Results from a cross-sectional survey.Am J Hum Biol. 2023 May;35(5):e23854. doi: 10.1002/ajhb.23854. Epub 2022 Dec 28. Am J Hum Biol. 2023. PMID: 36576438
-
The Association between Body Mass Index and Muscular Fitness in Chinese College Freshmen.Int J Environ Res Public Health. 2022 Oct 28;19(21):14060. doi: 10.3390/ijerph192114060. Int J Environ Res Public Health. 2022. PMID: 36360937 Free PMC article.
-
The association between BMI and health-related physical fitness among Chinese college students: a cross-sectional study.BMC Public Health. 2020 Apr 5;20(1):444. doi: 10.1186/s12889-020-08517-8. BMC Public Health. 2020. PMID: 32248800 Free PMC article.
-
A comparative study on the physical fitness of college students from different grades and majors in Jiangxi province.PLoS One. 2024 Oct 16;19(10):e0308483. doi: 10.1371/journal.pone.0308483. eCollection 2024. PLoS One. 2024. PMID: 39413092 Free PMC article.
Cited by
-
Sex comparison of the association between weight-adjusted waist index and physical fitness index: a cross-sectional survey of adolescents in Xinjiang, China.Sci Rep. 2025 May 28;15(1):18723. doi: 10.1038/s41598-025-03131-3. Sci Rep. 2025. PMID: 40437112 Free PMC article.
-
Effects of physical activity on eating disorder tendencies in college students: the chain-mediated effects of trait positivity and physical self-esteem.Front Psychol. 2025 Jul 14;16:1588744. doi: 10.3389/fpsyg.2025.1588744. eCollection 2025. Front Psychol. 2025. PMID: 40727057 Free PMC article.
-
Exploring the link between BMI and physical fitness in Sichuan's ethnic minority primary school students: insights from quantile regression analysis.BMC Pediatr. 2025 Jul 1;25(1):478. doi: 10.1186/s12887-025-05647-z. BMC Pediatr. 2025. PMID: 40596982 Free PMC article.
References
-
- Bao D., Xiao Z., Zhang Y., Chen G., Miao X., Wang B., et al. (2020). Mandatory physical education classes of two hours per week can Be comparable to losing more than five kilograms for Chinese college students. Int. J. Environ. Res. Public Health 17, 9182. 10.3390/ijerph17249182 - DOI - PMC - PubMed
-
- Barnett L. M., Morgan P. J., van Beurden E., Beard J. R. (2008). Perceived sports competence mediates the relationship between childhood motor skill proficiency and adolescent physical activity and fitness: a longitudinal assessment. Int. J. Behav. Nutr. Phys. Act. 5, 40. 10.1186/1479-5868-5-40 - DOI - PMC - PubMed
LinkOut - more resources
Full Text Sources