. 2023 Jun 6;1(3):234-241.
doi: 10.1021/cbmi.3c00043. eCollection 2023 Jun 26.

Recognition of Single Fluorescence Events by Temporal Pixel Intensity Fluctuation

Affiliations

Recognition of Single Fluorescence Events by Temporal Pixel Intensity Fluctuation

Kai Gu et al. Chem Biomed Imaging. .

Abstract

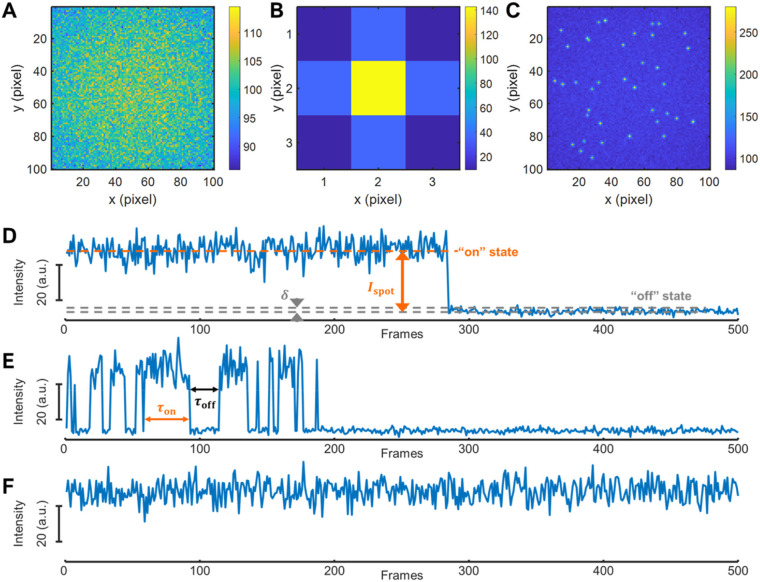
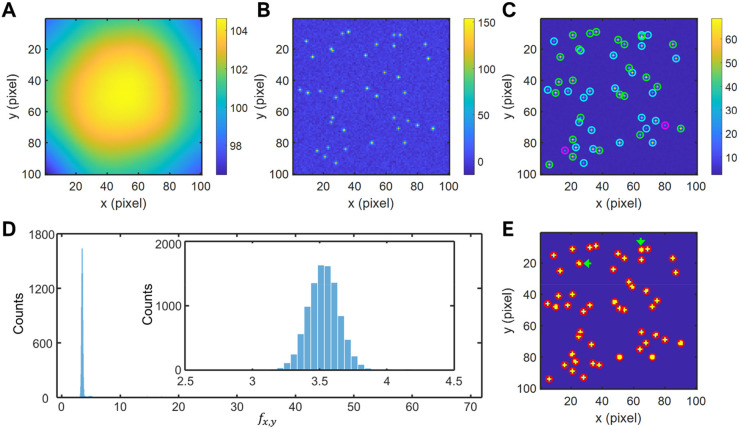
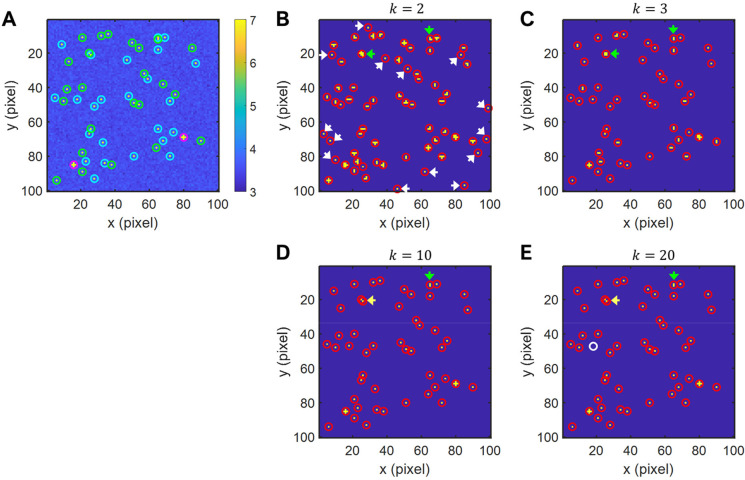
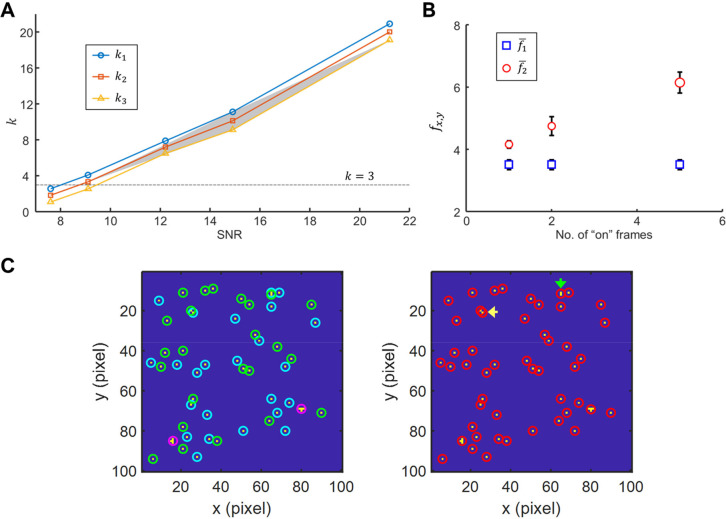
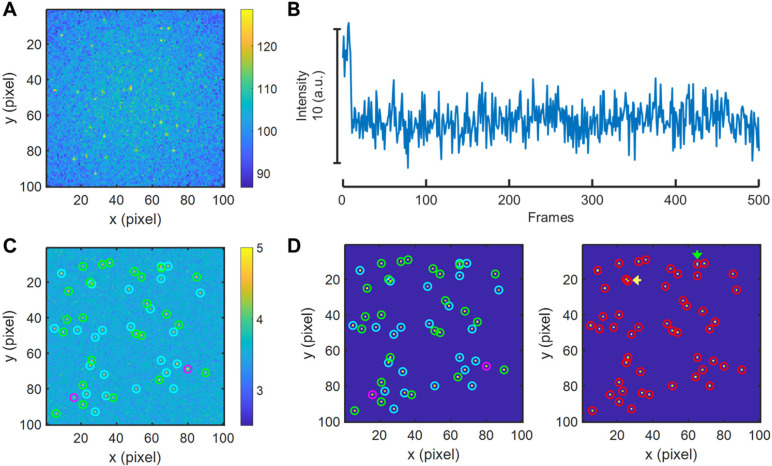
Single-molecule localization microscopy circumvents the diffraction limit of traditional fluorescence microscopy by detecting the photoemission signals of individual fluorescent molecules. The accurate recognitions of fluorescence molecules/events are critical to single-molecule/super-resolution imaging experiments, which determine the precision of molecular localizations and the quality of the image reconstruction. Herein, we presented a single-molecule detection method which relied on the temporal pixel intensity fluctuation. The method was capable of quickly determining the approximate localizations of fluorescence events with high sensitivity. We evaluated the performance of the method under a series of signal-to-noise ratios (SNR) and discussed the criterion of setting the temporal fluctuation threshold to achieve the optimized spots recognition results.


Conflict of interest statement

The authors declare no competing financial interest.

Figures

Figure 1
Figure 1
Simulated image sequence. (A–C) Profiles of (A) the simulated background, (B) a simulated bright spot, and (C) the 1st frame of the simulated image sequence. (D–F) Intensity–time trajectories of (D) photobleached spots, (E) spots with intermittent fluorescence events, and (F) spots with constant fluorescence.
Figure 2
Figure 2
Recognition of bright spots by temporal pixel intensity fluctuations. (A) Background generated by fitting the 1st frame of the simulated sequence (Figure 1C) using imgaussfilt function. (B) Image of the 1st frame of the simulated sequence (Figure 1C) after background subtraction. (C) Temporal pixel intensity fluctuation fx,y map of the simulated image sequence. The locations of the simulated bright spots are marked by circles (cyan: photobleached spots, green: spots with intermittent fluorescence events, magenta: spots with constant fluorescence). (D) Histogram of fx,y values on the temporal pixel intensity fluctuation map in C. Inset is the zoom-in of the peak at low fx,y regime that corresponds to the fx,y of the background pixels. (E) Binary image generated from (D) by setting f* = 1 + 10s1. The locations of the recognized spots are marked by red circles. The two pairs of unseparated partially overlapping bright spots are indicated by the green arrows.
Figure 3
Figure 3
Recognition of bright spots with a single “on” frame in the image sequence. (A) The fx,y map of the image sequence with the locations of the simulated bright spots marked by circles (cyan: photobleached spots, green: spots with intermittent fluorescence events, magenta: spots with constant fluorescence). (B–E) Binary images and bright spots recognition results obtained by setting (B) f* = 1 + 2s1, (C) f* = 1 + 3s1, (D) f* = 1 + 10s1, and (E) f* = 1 + 20s1, with the locations of the recognized spots marked by red circles (white arrow: wrongly recognized spots; green arrow: unseparated partially overlapping bright spots; yellow arrow: separated partially overlapping bright spots; white circle: unrecognized bright spot).
Figure 4
Figure 4
(A) Correlation plot between the threshold k and the SNR. The shaded regime indicates that 100% accurate bright spot recognition was achieved. The gray dashed line is k = 3. (B) Effect of the number of “on” frames on 1 and 2 at SNR = 7.6. The corresponding error bars are s1 and s2. (C) Final binary image when each bright spot contains 2 “on” frames, generated using the f* defined by k = 3.33. Left: binary image with the locations of the simulated bright spots marked by circles (cyan: photobleached spots, green: spots with intermittent fluorescence events, magenta: spots with constant fluorescence). Right: binary image with the locations of the recognized spots marked by red circles (green arrow: unseparated partially overlapping bright spots; yellow arrow: separated partially overlapping bright spots).
Figure 5
Figure 5
Bright spots recognition results at SNR = 2.95 and 10 “on” frames in the image sequence. (A) First frame of the image sequence. (B) Representative intensity trajectory of the bright spot. (C) The fx,y map of the image sequence. (D) Final binary image generated by setting f* = 1 + 3.33s1. Left: binary image with the locations of the simulated bright spots marked by circles (cyan: photobleached spots, green: spots with intermittent fluorescence events, magenta: spots with constant fluorescence). Right: binary image with the locations of the recognized spots marked by red circles (green arrow: unseparated partially overlapping bright spots; yellow arrow: separated partially overlapping bright spots).

Similar articles

References

    1. Rust M. J.; Bates M.; Zhuang X. Sub-diffraction-limit imaging by stochastic optical reconstruction microscopy (STORM). Nat. Methods 2006, 3 (10), 793–5. 10.1038/nmeth929. - DOI - PMC - PubMed
    1. Betzig E.; Patterson G. H.; Sougrat R.; Lindwasser O. W.; Olenych S.; Bonifacino J. S.; Davidson M. W.; Lippincott-Schwartz J.; Hess H. F. Imaging intracellular fluorescent proteins at nanometer resolution. Science 2006, 313 (5793), 1642–5. 10.1126/science.1127344. - DOI - PubMed
    1. Huang B.; Bates M.; Zhuang X. Super-resolution fluorescence microscopy. Annu. Rev. Biochem. 2009, 78, 993–1016. 10.1146/annurev.biochem.77.061906.092014. - DOI - PMC - PubMed
    1. Letschert S.; Gohler A.; Franke C.; Bertleff-Zieschang N.; Memmel E.; Doose S.; Seibel J.; Sauer M. Super-resolution imaging of plasma membrane glycans. Angew. Chem., Int. Ed. Engl. 2014, 53 (41), 10921–4. 10.1002/anie.201406045. - DOI - PubMed
    1. Wang Y.; Kuang C.; Cai H.; Li S.; Liu W.; Hao X.; Ge J.; Liu X. Sub-diffraction imaging with confocal fluorescence microscopy by stochastic photobleaching. Opt. Commun. 2014, 312, 62–67. 10.1016/j.optcom.2013.09.022. - DOI

LinkOut - more resources