. 2024 Sep 11;27(10):110917.
doi: 10.1016/j.isci.2024.110917. eCollection 2024 Oct 18.

Olanzapine enhances early brain maturation through activation of the NODAL/FOXH1 axis

Affiliations

Olanzapine enhances early brain maturation through activation of the NODAL/FOXH1 axis

Ziwei Teng et al. iScience. .

Abstract

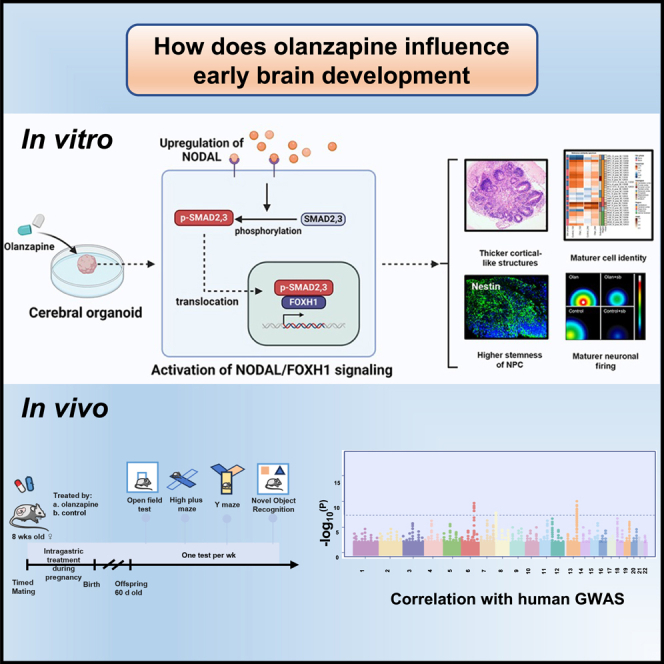
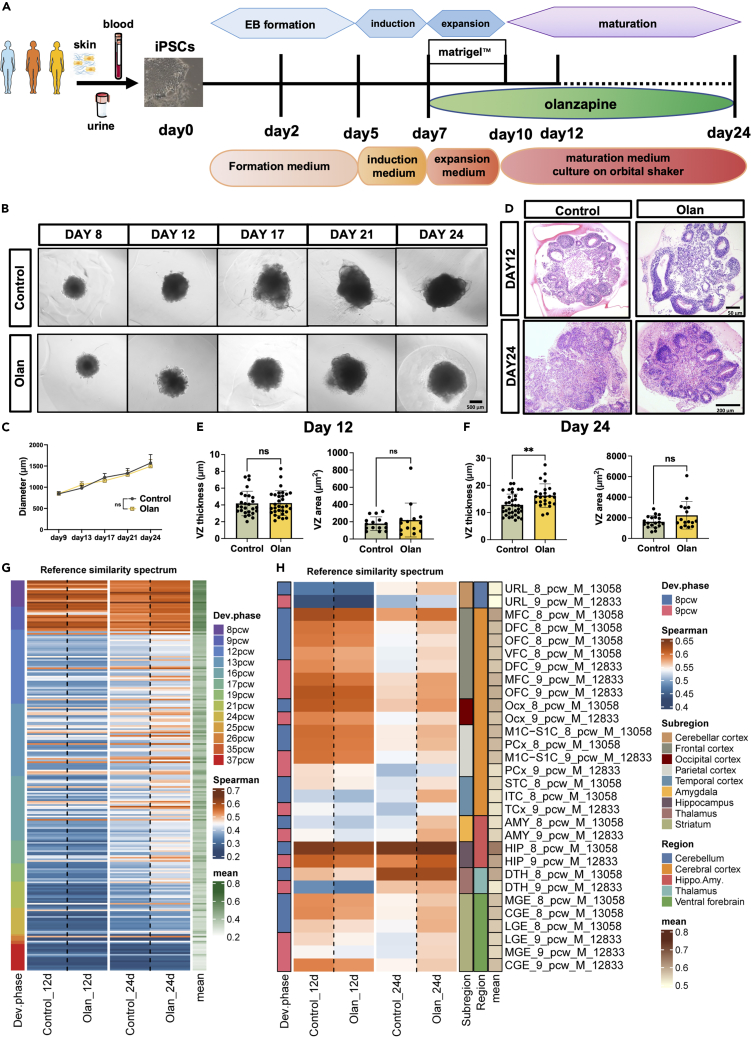
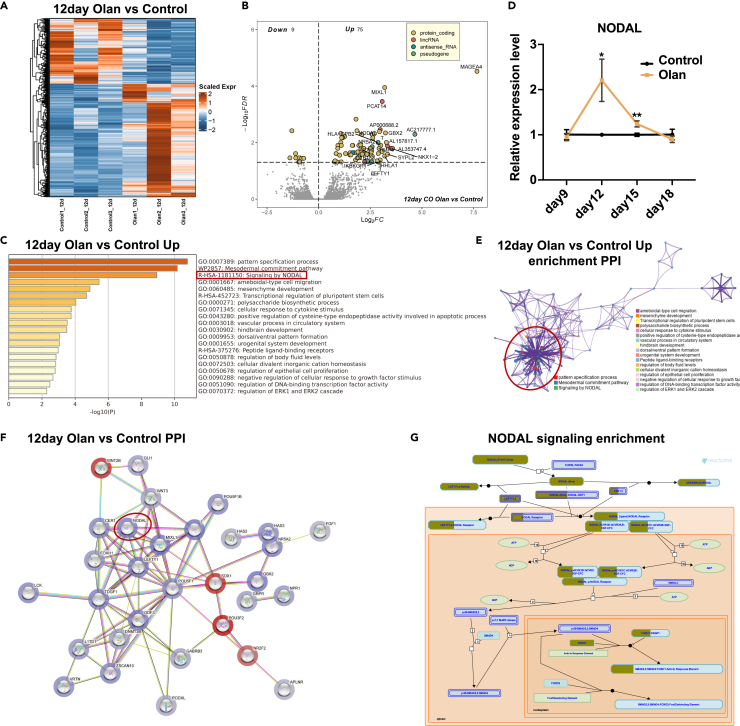
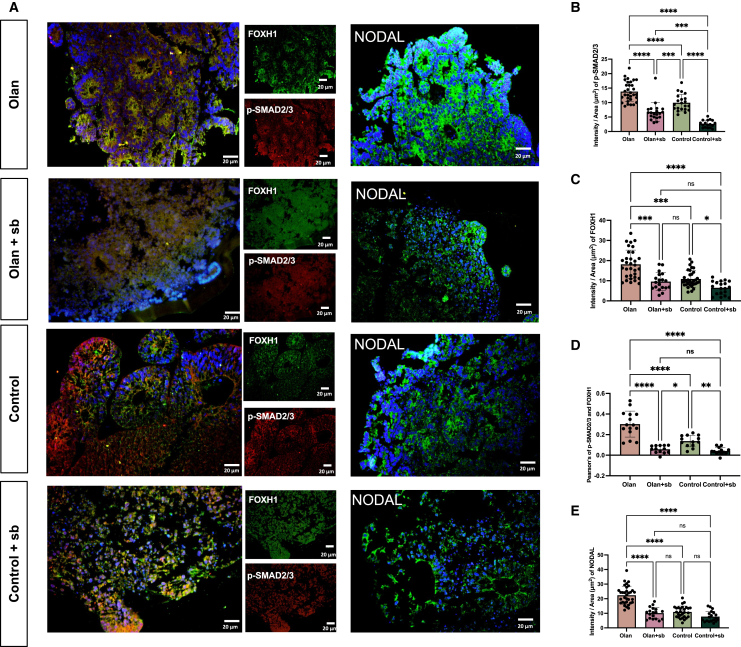
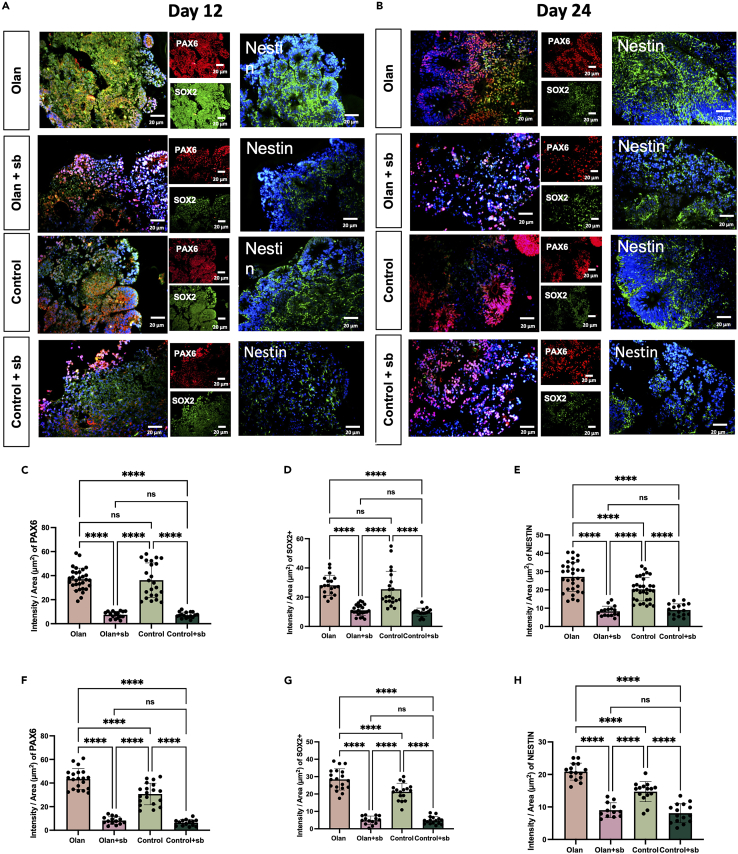
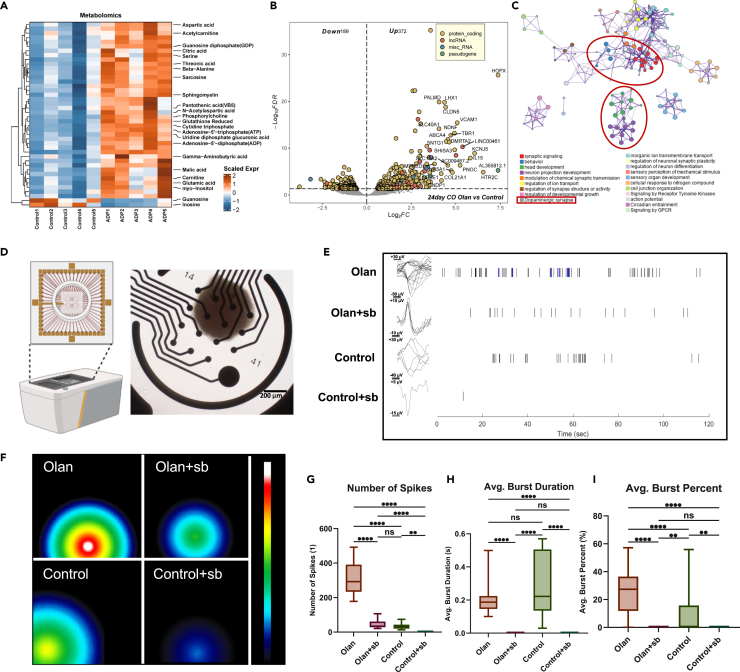
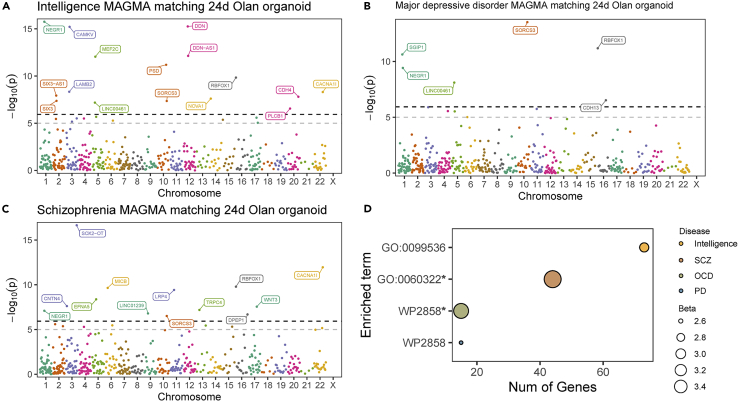
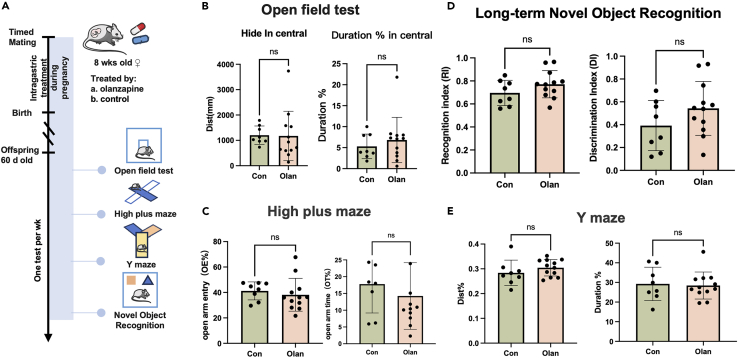
The portrayed effects of olanzapine on brain development and neuronal response remain unclear under the genetic background of Homo sapiens. Here, we constructed therapeutic-dosage olanzapine-treated cerebral organoid (CO) models using induced pluripotent stem cells from human samples. We found that the activation of NODAL/FOXH1 axis mediated the early response to olanzapine up to day 15, which subsequently caused thicker cortical-like structures, cell identity maturation, higher stemness of neural progenitor cells (NPCs), and mature neuronal firing of early neurons in day 24. Transcriptomics and targeted metabolomics confirmed the upregulation of neurodevelopmental-related terms and glutamate production on day 24. Gene enrichment of transcriptomics into large-scale genome-wide association studies (GWAS) showed possible relationships with intelligence, major depressive disorder, schizophrenia. We did not observe the negative effects of in-utero exposure to olanzapine in mice. Collectively, we tended to conclude that olanzapine treatment had beneficial effects instead of harmful on early brain development.

Keywords: Biological sciences; Cellular neuroscience; Developmental neuroscience; Natural sciences; Neuroscience.


Conflict of interest statement

The authors declare no competing interests.

Figures

None
Graphical abstract
Figure 1
Figure 1
Long-term olanzapine-treated CO showed a more mature cortical-like structure (A) The flow chart of CO induction and timeline of olanzapine treatment (B) Phase contrast microscopy showing the somatotype of COs under control and olanzapine treatment conditions. (C) The line chart comparing the maximal diameter of olanzapine-treated or control CO. (D) H&E staining showing the development of COs under control and olanzapine treatment conditions. (E and F) Barplot showing the difference of ventricular zone thickness and area in 12-day CO (E) and 24-day CO (F) treated by olanzapine or control. ANCOVA adjusting for three cell lines. ∗∗p < 0.01. ns: p > 0.05. (Detailed statistical data can be found in Table S11). (G and H) Heatmap showing the similarity of 12-day or 24-day CO group samples treated using olanzapine or control culture to the Human Developing Brain atlas (BrainSpan). The reference similarity spectrum was defined using Spearman’s correlation test based on log2(TPM+1) normalized data of reference samples from 8pcw to 37pcw (G), or exclusively 8 and 9pcw (H). The cerebral organoids in days 12 and 24 were sequenced in two batches. pcw, post conception weeks; URL, upper (rostral) rhombic lip; MFC, anterior (rostral) cingulate (medial prefrontal) cortex; DFC, dorsolateral prefrontal cortex; OFC, orbital frontal cortex; VFC, ventrolateral prefrontal cortex; Ocx, occipital neocortex; M1C-S1C, primary motor-sensory cortex; PCx, parietal neocortex; STC, posterior (caudal) superior temporal cortex; ITC, inferolateral temporal cortex; TCx, temporal neocortex; AMY, amygdaloid complex; HIP, hippocampus; DTH, dorsal thalamus; MGE, medial ganglionic eminence; CGE, caudal ganglionic eminence; LGE, lateral ganglionic. Data are represented as mean ± SD.
Figure 2
Figure 2
NODAL signaling is upregulated in the early-phase development of olanzapine-treated CO (A) Heatmap showing the scaled expression level of differentially expressed genes in 12-day COs (induced from hiPSC-U2 cell line) between olanzapine-treated and control conditions. (B) Volcano plot showing the DEGs in the olanzapine-treated CO group compared with the control group on day 12. FDR<0.05. (C) Barplot showing the gene annotation terms of upregulated DEGs in the 12-day olanzapine-treated CO group. (D) The line chart showing the temporal change of genes, including NODAL in COs, between olanzapine-treated and control conditions using qRT-PCR and two-way ANOVA. ∗p < 0.05. (E) Protein-protein interaction network analysis was conducted to determine the intimacy of each gene annotation term in 12-day olanzapine-treated CO. (F) Protein-protein interaction network analysis was conducted to determine the putative interactions between DEGs in 12-day olanzapine-treated CO. The upregulated genes were blue while the downregulated genes were red. The color depth is proportional to the strength of genetic changes. Note that NODAL signaling members NODAL, TDGF1, FOXH1 were hub genes that closely linked to brain development-related genes. (G) The scheme showing the DEGs enriched in NODAL signaling in the 12-day olanzapine-treated CO group. Tan-stained rectangles represent the upregulated gene in the specific pathway section. 1. Data are represented as mean ± SD.
Figure 3
Figure 3
Inhibition of NODAL signaling counteracted the expression of NODAL and FOXH1, and the colocalization of FOXH1 and p-SMAD2/3 (A) Sample images and quantification among multiple iPSC cell lines and clones for immunostaining of organoids at day 12. The immunofluorescence imaging showing the spatial expression of FOXH1, p-SMAD2/3, and NODAL in CO treated by olanzapine-treated (Olan), olanzapine+SB431542 dual-treated (Olan+sb), control, and SB431542 single-treated (Control+sb) groups. Scale bar, 20μm. Values represent mean ± SEM (11–30 total rosette structures from at least three organoids). (B–E) The results of the intensity of p-SMAD2/3 (B), FOXH1(C) the Pearson’s of p-SMAD2/3 and FOXH1 (D) and NODAL (E) between four groups. ∗∗∗∗p < 0.0001, ∗∗∗p < 0.001, ∗∗p < 0.01, p < 0.05, ns: p > 0.05. ANCOVA adjusting for three cell lines. Post-hoc analyses were conducted using Least Significant Difference (LSD) adjustment method. Data are represented as mean ± SD. (Detailed statistical data can be found in Table S11).
Figure 4
Figure 4
Inhibition of NODAL signaling counteracts the effects of olanzapine on the promotion of stemness (A) Sample images among multiple iPSC cell lines and clones for immunostaining of organoids at day 12. The immunofluorescence signal showing the spatial expression of PAX6, SOX2, and Nestin in 12-day CO treated by olanzapine-treated (Olan), olanzapine+SB431542 dual-treated (Olan+sb), control and SB431542 single-treated (Control+sb) groups. Scale bar, 20μm. (11–30 total rosette structures from at least three organoids). (B) Sample images among multiple iPSC cell lines and clones for immunostaining of organoids at day 24.The immunofluorescence signal showing the spatial expression of PAX6, SOX2, and Nestin in 24-day CO treated by olanzapine-treated (Olan), olanzapine+SB431542 dual-treated (Olan+sb), control and SB431542 single-treated (Control+sb) groups. Scale bar, 20μm. (11–30 total rosette structures from at least three organoids). (C–E) The results of the intensity of PAX6 (C), SOX2(D), and NESTIN (E) between four groups at day 12. (F–H) The results of the intensity of PAX6 (F), SOX2(G), and NESTIN (H) between four groups at day 24.∗∗∗∗p < 0.0001, ∗∗∗p < 0.001, ∗∗p < 0.01, p < 0.05, ns: p > 0.05. ANCOVA adjusting for three cell lines. Post-hoc analyses were conducted using the LSD adjustment method. Data are represented as mean ± SD. (Detailed statistical data can be found in Table S11).
Figure 5
Figure 5
Early surging of NODAL signaling is essential to the later formation of functional neural networks in CO (A) Heatmap showing the important metabolites that differed between the olanzapine-treated and control CO group on day 24. Data were scaled before visualization. (B) Volcano plot showing the DEGs in the olanzapine-treated group compared with the control group on day 24. FDR< 0.05. (C) PPI network analysis was conducted to determine the intimacy of each gene annotation term in 24-day olanzapine-treated CO. (D) Diagram of MEA assay of this study. COs were placed in the middle of the opening in the CytoView MEA 24 (Axion BioSystems, Inc.), which was covered by 16 electrodes at the bottom. The whole orifice was then placed in the Maestro Edge (Axion BioSystems, Inc.) for discharge detection. (E) Representative signals of spike recording the single neuronal discharge of CO in the olanzapine-treated (Olan), olanzapine+SB431542 dual-treated (Olan+sb), control, and SB431542 single-treated (Control+sb) groups. The blue signals refer to a burst, a discharge mode that appears in consecutive discharge and resting periods. (F) Representative heatmap showing the maximal discharge intensity of each CO in the Olan, Olan+sb, N, and N + sb groups. Different locations of signal refer to different electrodes that detected the signals. (G–I) Boxplot showing the number of spikes (G), the average burst duration (H) and the average burst percentage in all the neuronal discharge (I) of COs in the Olan, Olan+sb, N, and N + sb groups. The number of spikes was counted each in a 2-min recording. At least 3 organoids (only hiPSC-U2 cell line) for each group were included. Kruskal-Wallis test with Dunn’s multiple comparison adjustment. ∗p < 0.05, ∗∗∗p < 0.001, ∗∗∗∗p < 0.0001, ns: p > 0.05. Data are represented as median ± IQR. (Detailed statistical data can be found in Table S11).
Figure 6
Figure 6
Olanzapine-responsive genes in CO were related to neuropsychiatric traits (A–C) Manhattan plot showing the olanzapine-responsive genes matched to intelligence (A), major depressive disorder (B), and schizophrenia (C) GWAS data. Genes with P-Bonferroni<0.05 were labeled. (D) Bubble plot showing the terms enriched by olanzapine-responsive genes that mapped to neuropsychiatric conditions. ∗P-Bonferroni<0.05.
Figure 7
Figure 7
Prenatal exposure to olanzapine will not cause deficiency in cognition and mood in the offspring (A) The experimental design to investigate the intergenerational effects of olanzapine on F1 mice. Note that the F0 mice were only treated by olanzapine during pregnancy to simulate in utero exposure. (B–E) The results of open field test (B), high plus maze (C), long-term novel object recognition (D), and Y maze (E) between olanzapine-treated and control F1 mice. Student’s t test. ns: p > 0.05. Data are represented as mean ± SD. (Detailed statistical data can be found in Table S11).

References

    1. Thomas K., Saadabadi A. StatPearls. 2023. Olanzapine.
    1. Chouinard G., Samaha A.N., Chouinard V.A., Peretti C.S., Kanahara N., Takase M., Iyo M. Antipsychotic-Induced Dopamine Supersensitivity Psychosis: Pharmacology, Criteria, and Therapy. Psychother. Psychosom. 2017;86:189–219. doi: 10.1159/000477313. - DOI - PubMed
    1. Luppi A.I., Girn M., Rosas F.E., Timmermann C., Roseman L., Erritzoe D., Nutt D.J., Stamatakis E.A., Spreng R.N., Xing L., et al. A role for the serotonin 2A receptor in the expansion and functioning of human transmodal cortex. Brain. 2024;147:56–80. doi: 10.1093/brain/awad311. - DOI - PubMed
    1. Frost D.O., Page S.C., Carroll C., Kolb B. Early exposure to haloperidol or olanzapine induces long-term alterations of dendritic form. Synapse. 2010;64:191–199. doi: 10.1002/syn.20715. - DOI - PMC - PubMed
    1. Rosengarten H., Quartermain D. Effect of prenatal administration of haloperidol, risperidone, quetiapine and olanzapine on spatial learning and retention in adult rats. Pharmacol. Biochem. Behav. 2002;72:575–579. doi: 10.1016/s0091-3057(02)00727-x. - DOI - PubMed

LinkOut - more resources