. 2024 Oct 2;5(1):916-956.
doi: 10.1089/neur.2024.0090. eCollection 2024.

Association Between Clinical Measures of Depth of Sedation and Multimodal Cerebral Physiology in Acute Traumatic Neural Injury

Affiliations

Association Between Clinical Measures of Depth of Sedation and Multimodal Cerebral Physiology in Acute Traumatic Neural Injury

Kangyun Park et al. Neurotrauma Rep. .

Abstract

Neurointensive care primarily focuses on secondary injury reduction, utilizing a variety of guideline-based approaches (including administration of high-dose sedation) to reduce the injured state. However, titration of sedation is currently based on the Richmond Agitation Sedation Scale (RASS), a subjective clinical grading score of a patient's response to external physical stimuli, and not an objective measure. Therefore, it is likely that there exists substantial variation in objective sedation depth for a given clinical grade in these patients, leading to undesired sedation depths and cerebral physiological consequences. Improper sedation can impede cerebral autoregulation, emphasizing the critical need for optimal sedation in traumatic brain injury (TBI) patients. This study evaluates the relationship between RASS to an objective measure of depth of sedation (bispectral index, BIS) and cerebral physiological measures. Fifty-nine patients were assessed using Jonckheere-Terpstra testing to compare various key physiologies with RASS. RASS (-5 through 0 categories) showed no statistically significant relationship between BIS and cerebral physiological parameters, after adjusting for multiple comparisons. Furthermore, it is crucial to note that within each RASS value, the distribution of the physiological measures all had high variability. As an exemplar, for RASS values of -5 and -4, BIS ranged from near 0 (burst suppression levels) up to over 80 (near awake states). BIS and other cerebral physiologies displayed substantial variation across each RASS category. This suggests that RASS as a means to titrate sedative medication for the goal of neuroprotection is insufficient. More momentary, individualized determination of sedation depth is required for TBI patients.

Keywords: Bispectral Index; Cerebral Autoregulation; Critical Care; Depth of Sedation; Intracranial Pressure; Pressure Reactivity Index; RASS; Richmond Agitation Sedation Scale; Traumatic Brain Injury.


Figures

FIG. 1.
FIG. 1.
Example of Windowing method for cerebral physiology around RASS measures. Figure 1 is an example to visualize how the data was managed, and how the time intervals were created. The dotted line in the figure at time 0 min depicts when the RASS reading was recorded at the bedside by a health care professional. The highlighted portion is where RASS is assumed to be constant (60 min before and after the RASS reading). Thus, the highlighted portion makes up 120 min, creating our 120-min window of time. BIS, bispectral index; ICP, intracranial pressure; CPP, cerebral perfusion pressure; PRx, pressure reactivity index; Au, arbitrary units; mmHg, millimeters of mercury.
FIG. 2.
FIG. 2.
Histograms for when RASS is −5 to 0, for BIS right at the 120-min time frame. Panel A is a histogram of BIS_R when RASS is −5. Panel B is a histogram of BIS_R when RASS is −4. Panel C is a histogram of BIS_R when RASS is −3. Panel D is a histogram of BIS_R when RASS is −2. Panel E is a histogram of BIS_R when RASS is −1. Panel F is a histogram of BIS_R when RASS is 0. RASS, Richmond Agitation Sedation Scale; BIS, bispectral index; au, arbitrary unit.
FIG. 3.
FIG. 3.
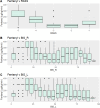
Boxplots of RASS versus BIS left and BIS right at the 120-min time frame. Panel A is a boxplot of BIS_L for RASS values −5 to 0. Panel B is a boxplot of BIS_R for RASS values −5 to 0. RASS, Richmond Agitation Sedation Scale; BIS, bispectral index; au, arbitrary units.
FIG. 4.
FIG. 4.
Histograms of PRx with RASS scores of −5 to 0. Panel A is a histogram of PRx when RASS is −5. Panel B is a histogram of PRx when RASS is −4. Panel C is a histogram of PRx when RASS is −3. Panel D is a histogram of PRx when RASS is −2. Panel E is a histogram of PRx when RASS is −1. Panel F is a histogram of PRx when RASS is 0. PRx, pressure reactivity index; RASS, Richmond Agitation Sedation Scale; au, arbitrary units.
FIG. 5.
FIG. 5.
RASS versus mean ICP, CPP, and PRx thresholds in the 120-min time frame. Panel A is a boxplot of mean ICP for RASS values −5 to 0. Panel B is a boxplot of mean CPP for RASS values −5 to 0. Panel C is a boxplot of % time above ICP 20 mmHg for RASS values −5 to 0. Panel D is a boxplot of % time below CPP 60 mmHg for RASS values −5 to 0. Panel E is a boxplot of mean PRx for RASS values −5 to 0. Panel F is a boxplot of % time above PRx 0.25 for RASS values −5 to 0. RASS, Richmond Agitation Sedation Scale; ICP, intracranial pressure; CPP, cerebral perfusion pressure; PRx, pressure reactivity index; au, arbitrary unit; mmHg, millimeters of mercury.
FIG. 6.
FIG. 6.
Contour plots of drug/sedation relationship. Panels show the contour plots that demonstrate the heat map relationship between propofol, fentanyl, BIS, and RASS. Panel A is propofol, fentanyl, and RASS, Panel B is propofol, fentanyl, and BIS, Panel C is propofol, BIS, and RASS, and Panel D is fentanyl, BIS, and RASS. RASS, Richmond Agitation Sedation Scale; h, hour; kg, kilogram; mg, milligram; min, minute; BIS, bispectral index; µg, microgram.
FIG. A1.
FIG. A1.
Histograms for BIS left with RASS scores of −5 to 0. BIS, bispectral index; RASS, Richmond Agitation Sedation Scale; Au, arbitrary units.
FIG. A2.
FIG. A2.
Histograms for BIS Right with RASS scores of −5 to 0. BIS, bispectral index; RASS, Richmond Agitation Sedation Scale; Au, arbitrary units.
FIG. A3.
FIG. A3.
Histograms of mean ICP with RASS scores of −5 to 0. ICP, intracranial pressure; RASS, Richmond Agitation Sedation Scale; mmHg, millimeters of mercury.
FIG. A4.
FIG. A4.
Histograms of mean CPP with RASS scores of −5 to 0. CPP, cerebral perfusion pressure; RASS, Richmond Agitation Sedation Scale; mmHg, millimeters of mercury.
FIG. A5.
FIG. A5.
Histograms of mean PRx with RASS scores of −5 to 0. PRx, pressure reactivity index; RASS, Richmond Agitation Sedation Scale; Au, arbitrary units.
FIG. A6.
FIG. A6.
Histograms of mean PAx with RASS scores of −5 to 0. PAx, pulse amplitude index; RASS, Richmond Agitation Sedation Scale; Au, arbitrary units.
FIG. A7.
FIG. A7.
Histograms of mean RAC with RASS scores of −5 to 0. RAC, correlation between slow-waves of AMP and CPP; RASS, Richmond Agitation Sedation Scale; Au, arbitrary units.
FIG. A8.
FIG. A8.
Histograms of mean RAP with RASS scores of −5 to 0. RAP, compensatory reserve; RASS, Richmond Agitation Sedation Scale; Au, arbitrary units.
FIG. A9.
FIG. A9.
Histograms of mean rSO2 right with RASS scores of −5 to 0.rSO2, regional oxygen saturation; RASS, Richmond Agitation Sedation Scale; mmHg, millimeters of mercury.
FIG. A10.
FIG. A10.
Boxplots of RASS versus BIS left and right with Jonckheere–Terpstra testing. RASS, Richmond Agitation Sedation Scale; BIS, bispectral index; Au, arbitrary units. Cerebral physiology (ICP, CPP).
FIG. A11.
FIG. A11.
Boxplots of RASS versus ICP and CPP (mean and literature-defined thresholds) with Jonckheere–Terpstra testing. RASS, Richmond Agitation Sedation Scale; ICP, intracranial pressure; CPP, cerebral perfusion pressure; mmHg, millimeters of mercury.
FIG. A12.
FIG. A12.
Boxplot of RASS versus PRx (mean and literature-defined thresholds) with Jonckheere–Terpstra testing. RASS, Richmond Agitation Sedation Scale; PRx, pressure reactivity index; Au, arbitrary units.
FIG. A13.
FIG. A13.
Boxplot of RASS versus PAx (mean and literature-defined thresholds) with Jonckheere–Terpstra testing. RASS, Richmond Agitation Sedation Scale; PAx, pulse amplitude index; Au, arbitrary units.
FIG. A14.
FIG. A14.
Boxplot of RASS versus RAC (mean and literature-defined thresholds) with Jonckheere–Terpstra testing. RASS, Richmond Agitation Sedation Scale; RAC, a correlation between the pulse amplitude of ICP and cerebral perfusion pressure.
FIG. A15.
FIG. A15.
Boxplot of RASS versus RAP (mean and literature-defined thresholds) with Jonckheere–Terpstra testing. RASS, Richmond Agitation Sedation Scale; RAP, compensatory reserve; Au, arbitrary units.
FIG. A16.
FIG. A16.
Boxplot of RASS versus mean rSO2 left and various rSO2 literature thresholds with Jonckheere–Terpstra testing. RASS, Richmond Agitation Sedation Scale; rSO2, regional cerebral oxygen saturation.
FIG. A17.
FIG. A17.
Boxplot of RASS versus mean rSO2 right and various rSO2 literature thresholds with Jonckheere–Terpstra testing. RASS, Richmond Agitation Sedation Scale; rSO2, regional cerebral oxygen saturation.
FIG. A18.
FIG. A18.
Boxplot of RASS versus MAP with Jonckheere–Terpstra testing. RASS, Richmond Agitation Sedation Scale; MAP, mean arterial pressure; mmHg, millimeters of mercury.
FIG. A19.
FIG. A19.
Propofol and RASS/BIS. RASS, Richmond Agitation Sedation Scale; h, hour; kg, kilogram; mg, milligram; min, minute; BIS, bispectral index; µg, microgram; Panel A demonstrates propofol and RASS, Panels B/C are propofol of BIS left/right side using boxplots.
FIG. A20.
FIG. A20.
Fentanyl and RASS/BIS. RASS, Richmond Agitation Sedation Scale; h, hour; kg, kilogram; mg, milligram; min, minute; BIS, bispectral index; µg, microgram; Panel A demonstrates fentanyl and RASS, Panels B/C are propofol of BIS left/right side using boxplots.
FIG. A21.
FIG. A21.
Midazolam and RASS/BIS. RASS, Richmond Agitation Sedation Scale; h, hour; kg, kilogram; mg, milligram; min, min; BIS, bispectral index; µg, microgram; Panel A demonstrates midazolam and RASS, Panels B/C are propofol of BIS left/right side using boxplots.
None
None
None
None
None
None
None

References

    1. Popescu C, Anghelescu A, Daia C, et al. Actual data on epidemiological evolution and prevention endeavours regarding traumatic brain injury. J Med Life 2015;8(3):272–277. - PMC - PubMed
    1. Maas AIR, Menon DK, Manley GT, et al. InTBIR Participants and Investigators . Traumatic brain injury: Progress and challenges in prevention, clinical care, and research. Lancet Neurol 2022;21(11):1004–1060; doi: 10.1016/S1474-4422(22)00309-X - DOI - PMC - PubMed
    1. Carney N, Totten AM, O’Reilly C, et al. Guidelines for the management of severe traumatic brain injury. Neurosurg 2016:244.
    1. SRLF Trial Group. Impact of oversedation prevention in ventilated critically ill patients: A randomized trial-the AWARE study. Ann Intensive Care 2018;8(1):93; doi: 10.1186/s13613-018-0425-3 - DOI - PMC - PubMed
    1. Matchett KB, Lynam-Lennon N, Watson RW, et al. Advances in precision medicine: Tailoring individualized therapies. Cancers (Basel) 2017;9(11); doi: 10.3390/cancers9110146 - DOI - PMC - PubMed

LinkOut - more resources