Review
. 2024 Apr 17;2(5):313-330.
doi: 10.1021/cbmi.4c00012. eCollection 2024 May 27.

Imaging-Assisted Antisense Oligonucleotide Delivery for Tumor-Targeted Gene Therapy

Affiliations
Review

Imaging-Assisted Antisense Oligonucleotide Delivery for Tumor-Targeted Gene Therapy

Hanwen Liao et al. Chem Biomed Imaging. .

Abstract

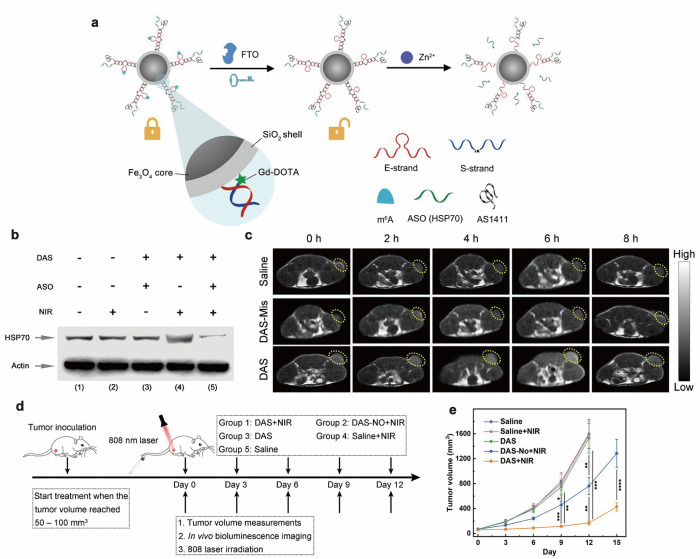
Antisense oligonucleotide (ASO) represents a class of practical tools for targeting undruggable oncogenes with several candidates currently undergoing clinical investigation. The advancement of antisense therapeutics necessitates comprehensive approaches for evaluating their efficacy and improving their accuracy. Molecular imaging techniques offer a qualitative and quantitative means to assess therapeutics at the molecular, cellular, and in vivo levels, as well as to elucidate biodistribution and pharmacokinetics. These capabilities play a pivotal role in enhancing therapeutic evaluation and efficiency. This review systematically explores the current landscape of ASO delivery by leveraging a synergistic combination of imaging techniques and delivery vehicles to enhance oligonucleotide distribution and accumulation at tumor sites and thereby optimizing therapeutic outcomes.


Conflict of interest statement

The authors declare no competing financial interest.

Figures

Figure 1
Figure 1
Schematic illustration depicting the typical mechanisms of ASO. Upon cellular internalization, ASO modulates gene expression through diverse pathways, including splice-switching of pre-mRNA, recruitment of RNase H to facilitate degradation of pre-mRNA/mRNA/microRNA, or complementary binding with the target mRNA to sequester it. Created with BioRender.
Figure 2
Figure 2
Schematic illustration of various delivery strategies for reporter-embedded ASO therapeutics. (a) General structure for reporter-embedded ASO therapeutics. (b) GalNAc moiety conjugated at the terminus of the ASO. (c) Peptide–ASO monoconjugate. (d) Aptamer–ASO conjugate. (e) Antibody–ASO conjugate. (f) Spherical nucleic acid consisting of a core with densely coated ASOs. (g) DNA tetrahedron is one of the DNA nanostructures. ASO is usually integrated into the DNA nanostructure via base pairing. (h) Polymer vehicle for ASO delivery. Polymer nanoparticles with positive charges happen through electrostatic interaction with negatively charged ASO.
Figure 3
Figure 3
(a) siRNA and pASO are linked via a thioketal bond with photosensitizers and self-assembly into spherical nucleic acid (PSNA). (b) NIR light as an external stimulus to trigger PSNA disassembly. (c) Representative Cy3 fluorescence images of HeLa tumor-bearing mice. (d) Representative Cy3 fluorescence images of major organs resected from mice at 12 h postinjection (p.i.). (e) Body weights and (f) tumor weights of HeLa tumor-bearing mice that received an intravenous injection of saline, CSNA (5 nmol ONDs), or PSNA (5 nmol ONDs). The treatments were performed every 3 days, and tumors were irradiated with 670 nm light (500 mW/cm2) for 5 min at 6 and 8 h p.i. of each treatment. (g) Western blotting analysis of HIF-1α and Bcl-2 levels in tumor tissues from different treatment groups. Adapted with permission from ref (57). Copyright 2021 American Chemical Society.
Figure 4
Figure 4
(a) Schematic illustration of the strategy for targeting KSHV-encoded miRNAs by Cdots-mediated delivery of locked nucleic acid (LNA) for treating KSHV-induced cancers. (b) Uptake of Cdots/LNA by KSHV-infected adherent KMM cells at different time points. (c) Relative levels of KSHV miR-K1, -K4, or -K11 measured by quantitative real-time reverse transcription PCR (RT-qPCR) after treatment with 100 nM of Cdots/LNA-K1, -K4, or -K11; the combination of the three suppressors; or Cdots/LNA-NC for 3 days in KMM cells. (d) Biodistribution of Cdots/LNAs 4 h after the injection in NOD/SCID mice intraperitoneally engrafted with BCBL1-Luc cells. (e) Timeline of the experiment. (f) In vivo luminescence images of mice before and after the indicated treatments for 7 days. Adapted with permission from ref (94). Copyright 2020 American Chemical Society.
Figure 5
Figure 5
(a) Schematic illustration of the design and principle of DAS for FTO and Zn2+ dual-responsive activation. (b) Western blot analysis of HSP70 protein levels in 4T1 cells with different treatments: (1) PBS, (2) PBS + NIR, (3) DAS, (4) DAS-ASO + NIR, and (5) DAS + NIR. (c) T1-weighted MR phantom images of the 4T1 tumor-bearing mice after the intravenous injection of DAS, control with nonresponsive DNAzyme linker (DAS-Mis), or saline. (d) Schematic illustration of the process of tumor treatment. (e) Average tumor size change of mice in each group. Adapted with permission from ref (98). Copyright 2023 Wiley.
Figure 6
Figure 6
(a) Schematic illustration of the preparation of the DOX/Fe-nG@Z. (b) Fluorescence images of MCF-7 cells treated with DOX/Fe-G@Z for different times. (c) T2-weighted MR images of tumors (white circles) in mice injected with DOX/Fe-G@Z via tail veins. (d) Fluorescence images showing that Fe-G@Z allows higher accumulation of G3139 in tumor sites than free G3139. (e) Fluorescence images of ex vivo organs and tumors harvested at 6 h postinjection of Fe-G@Z. (f) Tumor growth curves after exposure to different treatments (7: DOX/Fe-G@Z). Adapted with permission from ref (101). Copyright 2019 Wiley.
Figure 7
Figure 7
(a) Schematic illustration of synthesis of radiolabeled MSNAs. (b) In vivo distribution kinetics of [18F] MSNA-PO (phosphodiester), [18F] MSNA-PS, and [18F] ON6 in HCC1954 in HCC1954 tumor-bearing female mice shown as time–activity curves for blood, tumor/muscle ratio, liver, urine, muscle, tumor, and kidney expressed as standardized uptake value (SUV). (c) Maximum intensity projection coronal (top) and axial plane (bottom) PET/CT images at 15–60 min postinjection of [18F] MSNA-PS in HCC1954 tumor-bearing female mice. (d) Ex vivo biodistribution of [18F] MSNA-PO, [18F] MSNA-PS, [18F] ON6 in HCC1954 tumor-bearing female mice at 60 min after injection expressed as percentage of injected radioactivity dose per gram of tissue. Adapted with permission from ref (67). Copyright 2023 American Chemical Society.
Figure 8
Figure 8
(a) Structures of DOTA–PNA–peptide conjugates. (b) Western blot analysis of the bcl-2 protein. Lane 1, untreated control; lane 2, cells treated with compound 1; lane 3, untreated control; lane 4, cells treated with compound 2; lane 5, cells treated with compound 3. (c) (Top) SPECT images of 111In-DOTA–pASO–peptide conjugates in Mec-1 bearing SCID mice. A, 111In-DOTA-Tyr3-octreotate (1 h). B, 111In-DOTA-antibcl-2-pASO-Tyr3-octreotate (48 h). C, 111In-DOTA-nonsense-pASO-Tyr3-octreotate (48 h). D, 111In-DOTA-antibcl-2-pASO-Ala[3,4,5,6] (48 h). (Bottom) Corresponding transaxial slices through the centers of the tumors. Adapted with permission from ref (69). Copyright 2008 Society of Nuclear Medicine and Molecular Imaging.
Figure 9
Figure 9
(a) Schematic illustration of Au DENPs-based delivery system for UTMD-promoted codelivery of drug and gene for pancreatic cancer treatment. (b) Confocal microscopy images of SW1990 cells cultivated with Gem-Au DENPs/Cy3-miR-21i nanocomplex for different time. (c) B-mode ultrasound image; the yellow dots indicate the region of tumor. (d) Contrast-enhanced ultrasound (CEUS) image. (e) Tumor volume change after different treatments in vivo. (f) Survival rate of tumor-bearing mice in different treatment groups. Adapted with permission from ref (73). Copyright 2018 Ivyspring International Publisher.
Figure 10
Figure 10
(a) Schematic illustration delineating the fabrication process of IPP/MB nanobeacon and detailing the sequential events encompassing HSP90α mRNA detection, imaging, and subsequent downregulation within living cells, alongside the augmented T2-weighted MR imaging in a tumor model. (b,c) Potential secondary structures and target sequence recognition of the HSP90α mRNA-specific molecular beacon. (d) FLI and 3D reconstructed images of MDA-MB-231 cells incubated with the nanobeacon for 4, 24, and 48 h, which show the intracellular location and distribution of the nanobeacon. (e) Western blotting confirmed the protein levels of HSP90α decreased significantly after incubation with the IPP/MB nanobeacon. (f) Images of the T2-weighted MR imaging of a tumor model before and at different time points after injection of either IPP/MB or saline. Adapted with permission from ref (74). Copyright 2019 Ivyspring International Publisher.

References

    1. Crooke S. T.; Baker B. F.; Crooke R. M.; Liang X.-h. Antisense technology: an overview and prospectus. Nat. Rev. Drug Discovery 2021, 20 (6), 427–453. 10.1038/s41573-021-00162-z. - DOI - PubMed
    1. Crooke S. T.; Liang X.-H.; Baker B. F.; Crooke R. M. Antisense technology: A review. J. Biol. Chem. 2021, 296, 100416.10.1016/j.jbc.2021.100416. - DOI - PMC - PubMed
    1. Stephenson M. L.; Zamecnik P. C. Inhibition of Rous sarcoma viral RNA translation by a specific oligodeoxyribonucleotide. Proc. Natl. Acad. Sci. U. S. A. 1978, 75 (1), 285–288. 10.1073/pnas.75.1.285. - DOI - PMC - PubMed
    1. Zamecnik P. C.; Stephenson M. L. Inhibition of Rous sarcoma virus replication and cell transformation by a specific oligodeoxynucleotide. Proc. Natl. Acad. Sci. U. S. A. 1978, 75 (1), 280–284. 10.1073/pnas.75.1.280. - DOI - PMC - PubMed
    1. Collotta D.; Bertocchi I.; Chiapello E.; Collino M. Antisense oligonucleotides: a novel Frontier in pharmacological strategy. Front. Pharmacol. 2023, 14, 1304342.10.3389/fphar.2023.1304342. - DOI - PMC - PubMed

LinkOut - more resources