. 2023 Sep 28;1(7):648-658.
doi: 10.1021/cbmi.3c00042. eCollection 2023 Oct 23.

Imaging and Simulation of Ruthenium Derivative Coating Microbeads at the Opaque Electrode with Electrogenerated Chemiluminescence

Affiliations

Imaging and Simulation of Ruthenium Derivative Coating Microbeads at the Opaque Electrode with Electrogenerated Chemiluminescence

Yanlong Feng et al. Chem Biomed Imaging. .

Abstract

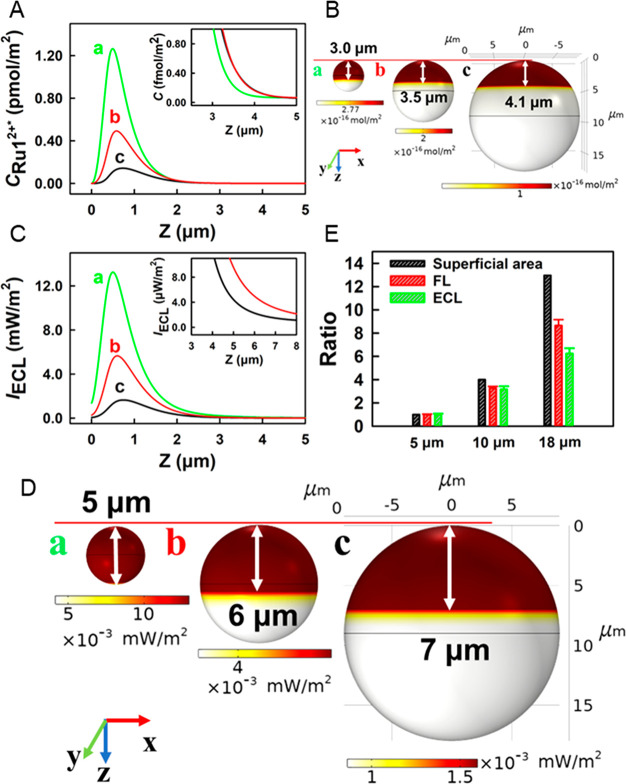
Electrogenerated chemiluminescence (ECL) imaging is gaining increasing attention in various fields because of its high sensitivity, low background, and good temporal and spatial resolution. However, ECL imaging of microsized objects at the opaque electrode via top-view configuration is challenged with the reactants' diffusion and light propagation. Here, we imaged and numerically simulated ruthenium derivative coating polystyrene microbeads (Ru1-PS@MB) at the glassy carbon electrode (GCE) via top-view configuration by ECL imaging. The ruthenium derivative (bis(2,2'-bipyridine)-4'-methyl-4-carboxybipyridine-ruthenium N-succinimidyl ester-bis (hexafluorophosphate), Ru1), a typical ECL reagent, was covalently linked onto the surface of aminated PS@MBs via the amide reaction. "Strong emission in edge and weak emission in center" phenomena for fluorescence (FL) and ECL emissions were obtained from Ru1-PS@MB on GCE. Z-Stack imaging of the microsized Ru1-PS@MB luminescence was performed on GCE in the presence of tri-n-propylamine (TPA). It is found that the clear luminescence range of Ru1-PS@MB perpendicular to the electrode surface in ECL image is slightly smaller than that in the FL image. The bigger was the diameter of the microbeads (from 5 to 18 μm), the larger was the ECL luminescence range of Ru1-PS@MB perpendicular to the electrode surface (from 5 to 7 μm). Our findings, which are also supported by numerical simulation, provide insights into the ECL imaging of microsized objects at the electrode surface, which will raise promising ECL applications in bioassays and cell imaging at the microscale level.


Conflict of interest statement

The authors declare no competing financial interest.

Figures

Scheme 1
Scheme 1. (A) Schematic Diagram of the Synthesis of Ru1-PS@MB via the Amide Reaction, (B) Ru1-PS@MBs with Different Diameters Modified on the Surface of the GCE, and (C) Schematic Diagram of Top-View Configurations of FL and ECL Imaging
(a) FL imaging power source device; (b) ECL imaging power source device.
Figure 1
Figure 1
FE-SEM images of (A) 5 μm, (B) 10 μm, and (C) 18 μm NH2-PS@MB. (D) FL spectra of (a) 10 μg/mL 10 μm NH2-PS@MB suspension, (b) 5 μg/mL 5 μm Ru1-PS@MB suspension, (c) 10 μg/mL 10 μm Ru1-PS@MB suspension, (d) 20 μg/mL 18 μm Ru1-PS@MB suspension, and (e) 10 μM Ru1 solution. λex = 457 nm. (E) Schematic diagram of CLSM imaging of Ru1-PS@MB deposited on the glass bottom of the culture dish. (F) CLSM images of single 10 μm Ru1-PS@MB deposited on the glass bottom of the culture dish at different focal slices from Z = 0 to Z = 10 μm. (G) 3D-reconstructed CLSM image of one single Ru1-PS@MB.
Figure 2
Figure 2
Representative pseudocolor FL images (A0–C0) and ECL images (A2–C2) of 5, 10, and 18 μm Ru1-PS@MB modified GCE recorded in 0.1 M PBS (pH 7.4) containing 50 mM TPA (Z = 0). Enlarged FL images (A1–C1) and ECL images (A3–C3) of the region of interest in the red square of images (A0–C0, A2–C2) for one single Ru1-PS@MB. (A4–C4) Representative plots of the gray value across one indicated Ru1-PS @MB with the line in images A1–C1 and A3–C3. (D0) The comparison of bead diameter for 20 different Ru1-PS@MBs from ECL images and FL images. (D1–D3) Simulated emission images of 5, 10, and 18 μm Ru1-PS@MBs. (D4) Comparison of the gray value across the indicated Ru1-PS@MB with the line in images D1–D3.
Figure 3
Figure 3
(A) Representative pseudocolor FL images of one 10 μm Ru1-PS@MB at different Z values (0–10 μm) at 40× objective. (B) Schematic diagram of the relationship among actual luminous range dtot, ds, and df for FL imaging of Ru1-PS@MB. (C) The relationship between the experimental diameter of Ru1-PS@MBs (dot) and the theoretical diameter of the dispersion circle (line) with Z values of 5, 10, and 18 μm Ru1-PS@MBs at 40× objective.
Figure 4
Figure 4
Representative pseudocolor experimental ECL images of single 10 μm (A), 5 μm (B), and 18 μm (C) Ru1-PS@MBs modified on GCE in 0.1 M PBS (pH 7.4) containing 50 mM TPA at different Z values.
Figure 5
Figure 5
Simulated relationship between different Z values with surface concentration of Ru12+* (A) and 3D surface concentration distribution of Ru12+* (B) for 5 μm (a), 10 μm (b), and 18 μm (c) Ru1-PS@MBs. Inset in (A): Enlarged Ru12+* concentration distributions. Simulated relationship between different Z values with surface intensity of IECL (C) and 3D surface intensity distribution of IECL (D) for 5 μm (a), 10 μm (b), and 18 μm (c) Ru1-PS@MBs. Inset in (C): Enlarged IECL distributions. (E) Ratios of three Ru1-PS@MBs in terms of superficial area, FL intensity (n = 20), and ECL intensity (n = 20), in which they are normalized with that of 5 μm Ru1-PS@MB at Z = 0.

References

    1. Qi H.; Zhang C. Electrogenerated chemiluminescence biosensing. Anal. Chem. 2020, 92, 524–534. 10.1021/acs.analchem.9b03425. - DOI - PubMed
    1. Shi Z.; Li G.; Hu Y. Progress on the application of electrochemiluminescence biosensor based on nanomaterials. Chin. Chem. Lett. 2019, 30, 1600–1606. 10.1016/j.cclet.2019.04.066. - DOI
    1. Liu Y.; Guo W.; Su B. Recent advances in electrochemiluminescence imaging analysis based on nanomaterials and micro-/nanostructures. Chin. Chem. Lett. 2019, 30, 1593–1599. 10.1016/j.cclet.2019.05.038. - DOI
    1. Engstrom R. C.; Pharr C. M.; Koppang M. D. Visualization of the edge effect with electrogenerated chemiluminescence. J. Electroanal. Chem. 1987, 221, 251–255. 10.1016/0022-0728(87)80262-0. - DOI
    1. Maus R. G.; McDonald E. M.; Wightman R. M. Imaging of nonuniform current density at microelectrodes by electrogenerated chemiluminescence. Anal. Chem. 1999, 71, 4944–4950. 10.1021/ac9905827. - DOI - PubMed

LinkOut - more resources