. 2024 Oct 15:15:1480091.
doi: 10.3389/fimmu.2024.1480091. eCollection 2024.

Making the effect visible - OX40 targeting nanobodies for in vivo imaging of activated T cells

Affiliations

Making the effect visible - OX40 targeting nanobodies for in vivo imaging of activated T cells

Desiree I Frecot et al. Front Immunol. .

Abstract

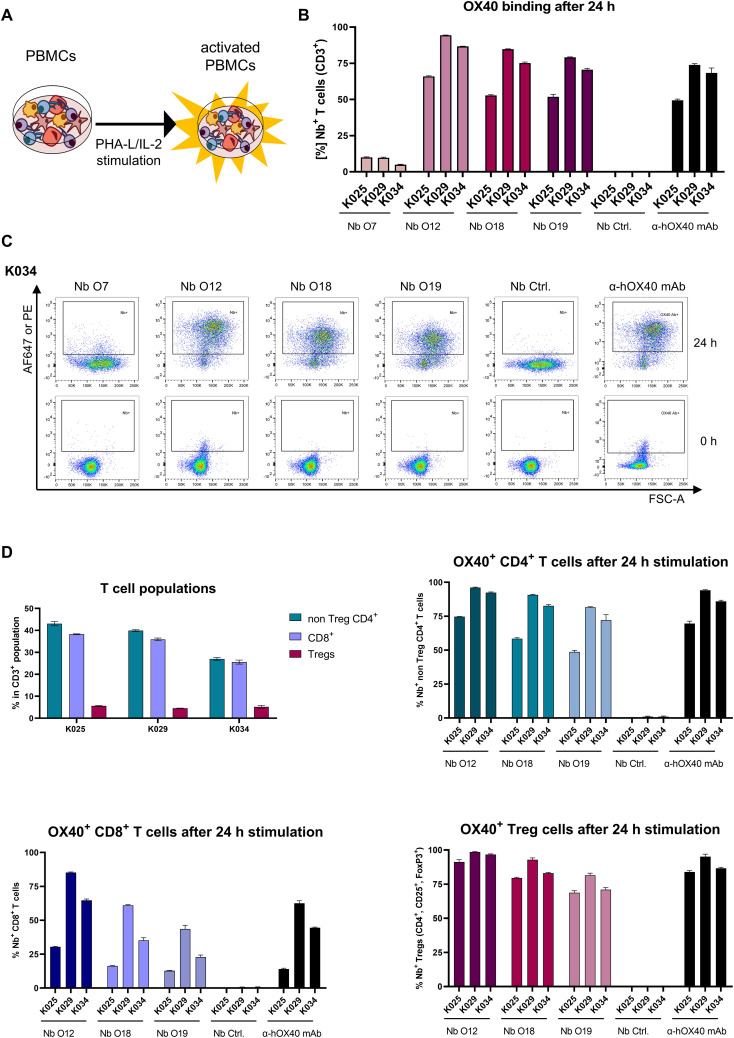
Purpose: Human OX40 (hOX40/CD134), a member of the TNF receptor superfamily, is mainly expressed on activated T lymphocytes. Triggered by its ligand OX40L (CD252), it provides costimulatory signals that support the differentiation, proliferation and long-term survival of T cells. Besides being a relevant therapeutic target, hOX40 is also an important biomarker for monitoring the presence or infiltration of activated T cells within the tumor microenvironment (TME), the inflammatory microenvironment (IME) in immune-mediated diseases (IMIDs) and the lymphatic organs. Here, we developed novel single domain antibodies (nanobodies, Nbs) targeting hOX40 to monitor the activation status of T cells by in vivo molecular imaging.

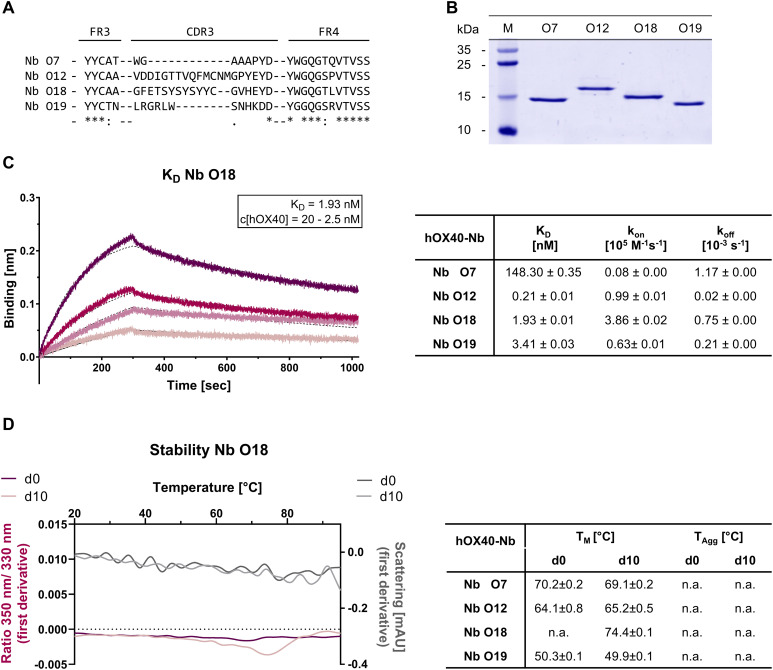
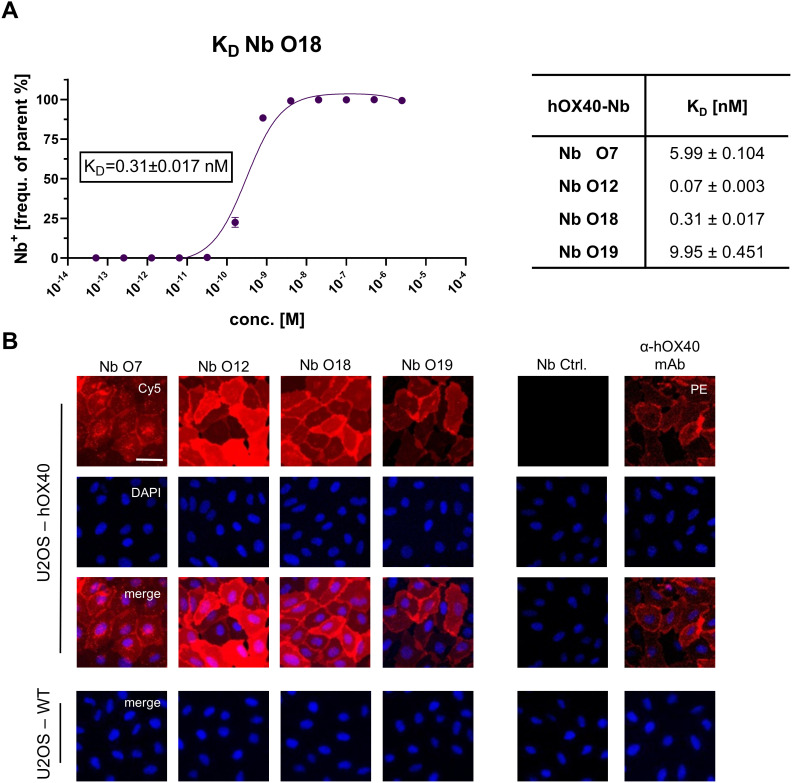
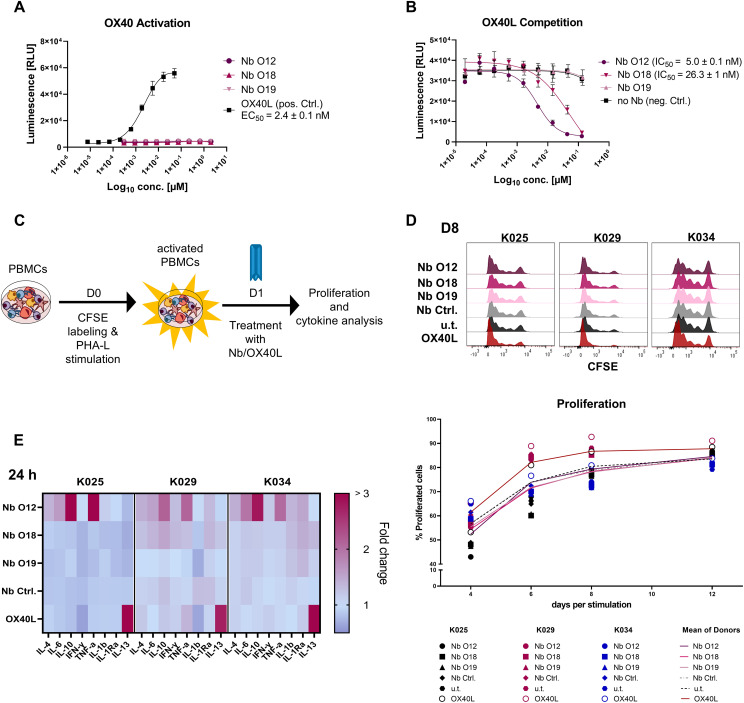
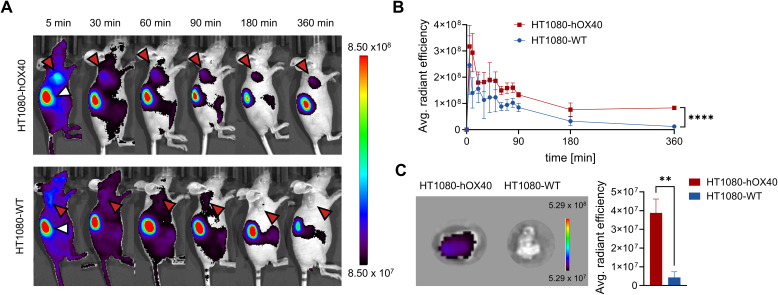
Methods: Nbs against hOX40 (hOX40-Nbs) were selected from an immunized Nb-library by phage display. The identified hOX40-Nbs were characterized in vitro, including determination of their specificity, affinity, stability, epitope recognition and their impact on OX40 signaling and T cell function. A lead candidate was site-specifically conjugated with a fluorophore via sortagging and applied for noninvasive in vivo optical imaging (OI) of hOX40-expressing cells in a xenograft mouse model.

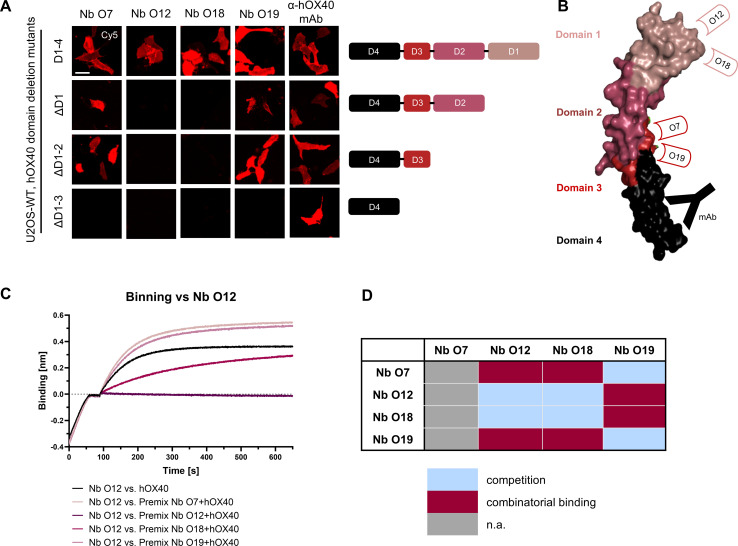
Results: Our selection campaign revealed four unique Nbs that exhibit strong binding affinities and high stabilities under physiological conditions. Epitope binning and domain mapping indicated the targeting of at least two different epitopes on hOX40. When analyzing their impact on OX40 signaling, an agonistic effect was excluded for all validated Nbs. Incubation of activated T cells with hOX40-Nbs did not affect cell viability or proliferation patterns, whereas differences in cytokine release were observed. In vivo OI with a fluorophore-conjugated lead candidate in experimental mice with hOX40-expressing xenografts demonstrated its specificity and functionality as an imaging probe.

Conclusion: Considering the need for advanced probes for noninvasive in vivo monitoring of T cell activation dynamics, we propose, that our hOX40-Nbs have a great potential as imaging probes for noninvasive and longitudinal in vivo diagnostics. Quantification of OX40+ T cells in TME or IME will provide crucial insights into the activation state of infiltrating T cells, offering a valuable biomarker for assessing immune responses, predicting treatment efficacy, and guiding personalized immunotherapy strategies in patients with cancer or IMIDs.

Keywords: OX40; T cell activation; in vivo imaging; monitoring immunotherapies; nanobody; tumor microenvironment (TME).


Conflict of interest statement

DF, DS, MK, BP, TW, BT, PK, and UR are named as inventors on a patent application claiming the use of the described nanobodies for diagnosis and therapeutics filed by the Natural and Medical Sciences Institute, the Werner Siemens Imaging Center and the University of Tuebingen. The remaining authors declare that the research was conducted in the absence of any commercial or financial relationships that could be construed as a potential conflict of interest.

Figures

Figure 1
Figure 1
Biochemical characterization of hOX40-Nbs. (A) Amino acid (aa) sequences of the complementarity determining region (CDR) 3 from 4 unique hOX40-Nbs identified by two consecutive rounds of bio panning (full sequences are displayed in Supplementary Table S1 ). (B) Coomassie-stained SDS-PAGE of 2 µg purified hOX40-Nbs after purification using immobilized metal affinity chromatography (IMAC) and size exclusion chromatography (SEC). (C) Biolayer interferometry (BLI)-based affinity measurements exemplarily shown for Nb O18. Biotinylated Nb was immobilized on streptavidin biosensors. Kinetic measurements were performed using four concentrations of recombinant hOX40 ranging from 2.5 nM - 20 nM (displayed with gradually lighter shades of color; left). Summary table (right) shows affinities (KD), association constants (kon), and dissociation constants (koff) determined by BLI using four concentrations of purified Nbs as mean ± SD. (D) Stability analysis using nano scale differential scanning fluorimetry (nanoDSF) displaying fluorescence ratio (350 nm/330 nm) (red) and light scattering (gray) shown as first derivative for day 0 (dark shade) and after an accelerated aging period of 10 days at 37°C (light shade), exemplary shown for Nb O18 (left) and summarized for all hOX40-Nbs in the table (right). Data are shown as mean value of three technical replicates.
Figure 2
Figure 2
Characterization of cellular binding of hOX40-Nbs. (A) Determination of hOX40-Nb binding to cellular expressed hOX40 by flow cytometry (n=3), exemplary shown for Nb O18 labeled with AlexaFluor647 (AF647; left). The percentage of positively stained U2OS-hOX40 (frequency of parent) was plotted against indicated concentrations of AF647-labeled hOX40-Nbs and KD values shown in table (right) were calculated from a four-parametric sigmoidal model based on the mean ± SD of three replicates. (B) Representative images of U2OS-hOX40 cells (upper panel) and U2OS-WT cells (lower panel) stained with 1000 nM AF647-labeled hOX40-Nbs (left) as well as non-binding AF647-labeled PEP-Nb (Nb Ctrl.) as negative and phycoerythrin (PE)-labeled anti-hOX40 mAb as positive control (right). Shown are individual Nb staining (red), nuclei staining (Hoechst, blue) and merged signals; scale bar: 50 µm.
Figure 3
Figure 3
Characterization of binding epitopes of hOX40-Nbs. (A) Domain mapping by immunofluorescence staining with hOX40-Nbs on U2OS cells displaying either surface exposed hOX40 full length (D1-4), or domain deletion mutants as indicated. Shown are representative images of living cells stained with individual AF647-labeled Nbs or anti-hOX40 mAb; scale bar: 50 µm. (B) Schematic overview summarizing the results of domain mapping analysis (crystal structure OX40 PDB: 2HEV). (C) Epitope binning analysis of hOX40-Nbs by BLI. Representative sensograms of combinatorial Nb binding to recombinant hOX40 on sharing/overlapping epitopes or on different epitopes are shown. (D) Graphical summary of epitope binning analysis.
Figure 4
Figure 4
Validation of hOX40-Nb binding to activated T cells. (A) Schematic outline of activation of human peripheral blood mononuclear cells (hPBMCs) by phytohaemagglutinin L (PHA-L) and IL-2. (B) Flow cytometry analysis of hOX40-Nbs staining on CD3+ hPBMCs from three different donors (K025, K029 and K034) after 24 h of PHA-L and IL-2 stimulation shown as bar graph. Data are presented as mean ± SD of three replicate stains. (C) Exemplary results of flow cytometry analysis of CD3+ hPBMCs derived from donor K034 stained with AF647-labeled hOX40-Nbs, a non-binding PEP-Nb (Nb. Ctrl.) or a PE-labeled anti-hOX40 mAb before (0 h, lower panel) and after (24 h, upper panel) stimulation. (D) Flow cytometry analysis of hOX40-Nb staining on non Treg CD4+, CD8+ and regulatory (Treg) T cells from the three same donors after 24 h of PHA-L and IL-2 stimulation. Bar graphs summarizing the percentages of the different T cell subpopulations for each donor (upper left), Nb binding to non Treg CD4+ T cells (upper right), Nb binding to CD8+ T cells (lower left) and Nb binding to Tregs (lower right) in comparison to non-binding PEP-Nb (Nb. Ctrl.) or a PE-labeled anti-hOX40 mAb. Data are presented as mean ± SD of three replicate stains.
Figure 5
Figure 5
Analysis of hOX40-Nbs on OX40 signaling. (A, B) Assessment of agonistic or antagonistic activities of hOX40-Nbs on OX40 signaling in a cell-based OX40 bioassay. (A) For determining agonistic effects OX40 effector cells were treated for 5 h with serial dilutions of Nbs O12, O18, O19 or OX40L as positive control (pos. Ctrl.) followed by luminescence detection. Data are shown as a three-parameter logistic regression dose-response curve based on the mean ± SD of three replicates (n = 3), with EC50 value of ~ 2.4 nM for OX40L. (B) For analysis of a potential OX40L competition, OX40 effector cells were preincubated with serial dilutions of Nbs ranging from 0.13 µM to 0.002 nM before adding OX40L at the saturation concentration of 0.12 µM followed by luminescence detection. Three-parameter logistic regression dose-response curves based on the mean ± SD of three replicates showed an antagonistic effect of Nb O12 and O18 with IC50 values of ~ 5.0 nM or 26.3 nM, respectively. (C) Schematic workflow for testing the impact of Nbs on T cell proliferation and cytokine release. hPBMCs of three donors (K025, K029, K034) were CFSE-labeled and stimulated with PHA-L/IL-2. After 24 h, hPBMCs were treated with 0.5 µM hOX40-Nbs, non-binding PEP-Nb (Nb Ctrl.), OX40L or left untreated (u.t.). Proliferation at days 4, 6, 8 and 12 after stimulation and cytokine release after 24, 72 and 168 hours of Nb treatment were monitored. (D) Proliferation was analyzed by flow cytometry (CFSE-low/negative fraction), exemplary shown for day 8 (D8, upper panel). Mean percentages of all three donors are shown as plain or dotted lines (lower panel). (E) Determination of cytokines secreted after treatment with hOX40-Nbs displayed as a heat map, exemplary shown for 24 hours (24 h) after Nb treatment. Values are shown as fold change compared to the untreated control based on the mean of three technical replicates.
Figure 6
Figure 6
In vivo optical imaging (OI) with O18AF647 in HT1080-hOX40 and HT1080-WT tumor bearing mice. 5 µg of O18AF647 were administered intravenously (i.v.) to CD1 nude mice which previously were subcutaneously injected with human HT1080-hOX40 or HT1080-WT cells at the right upper flank for tumor formation. Tumor biodistribution of O18AF647 was monitored by repetitive OI measurements over the course of 6 h. (A) Acquired images of different measurement time points of one representative O18AF647-injected mouse with HT1080-hOX40 tumor (top) or HT1080-WT tumor (bottom, control). Red arrows indicate the tumor localization at the right upper flank. The kidney is marked with a white arrow at the 5 min time point. (B) Quantification of the fluorescence signal from the tumors (n = 3 per group, arithmetic mean of the average radiant efficiency ± SD, unpaired t test, corrected for multiple comparisons using the Holm-Sidak method revealing a significance of p = 0,00004 indicated by ****) determined at indicated time points. (C) Representative ex vivo OI of harvested tumor (left) and organ quantification of O18AF647 in HT1080-hOX40 and HT1080-WT tumors. After the last imaging time point, tumors were harvested for ex vivo OI, confirming significantly increased accumulation of O18AF647 in HT1080-hOX40 tumors (n = 3 per group, arithmetic mean ± SD; unpaired t test revealing a significance of p = 0,0017 indicated by **). Data are shown as individual and mean value of three technical replicates. p < 0.05 was considered statistically significant (*) and marked as ** for p < 0.01 and **** for p < 0.0001.

Similar articles

Cited by

References

    1. Twomey JD, Zhang B. Cancer immunotherapy update: FDA-approved checkpoint inhibitors and companion diagnostics. AAPS J. (2021) 23:39. doi: 10.1208/s12248-021-00574-0 - DOI - PMC - PubMed
    1. Ghobadinezhad F, Ebrahimi N, Mozaffari F, Moradi N, Beiranvand S, Pournazari M, et al. . The emerging role of regulatory cell-based therapy in autoimmune disease. Front Immunol. (2022) 13:1075813. doi: 10.3389/fimmu.2022.1075813 - DOI - PMC - PubMed
    1. Liu C, Yang M, Zhang D, Chen M, Zhu D. Clinical cancer immunotherapy: Current progress and prospects. Front Immunol. (2022) 13:961805. doi: 10.3389/fimmu.2022.961805 - DOI - PMC - PubMed
    1. Chasov V, Zmievskaya E, Ganeeva I, Gilyazova E, Davletshin D, Khaliulin M, et al. . Immunotherapy strategy for systemic autoimmune diseases: betting on CAR-T cells and antibodies. Antibodies. (2024) 13:10. doi: 10.3390/antib13010010 - DOI - PMC - PubMed
    1. Wierstra P, Sandker G, Aarntzen E, Gotthardt M, Adema G, Bussink J, et al. . Tracers for non-invasive radionuclide imaging of immune checkpoint expression in cancer. EJNMMI Radiopharm Chem. (2019) 4:29. doi: 10.1186/s41181-019-0078-z - DOI - PMC - PubMed

LinkOut - more resources