. 2023 Nov 29;2(2):135-146.
doi: 10.1021/cbmi.3c00109. eCollection 2024 Feb 26.

A Patching and Coding Lipid Raft-Localized Universal Imaging Platform

Affiliations

A Patching and Coding Lipid Raft-Localized Universal Imaging Platform

Tong Zhong et al. Chem Biomed Imaging. .

Abstract

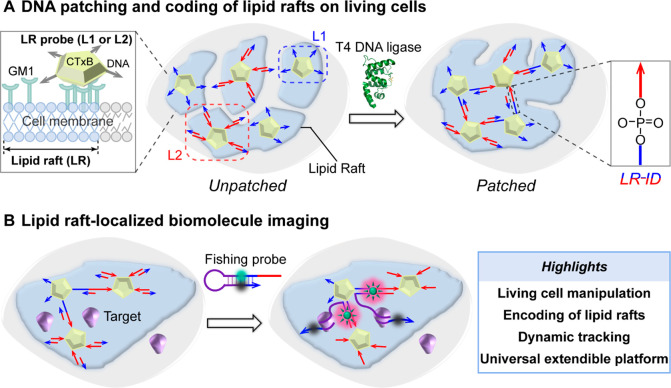
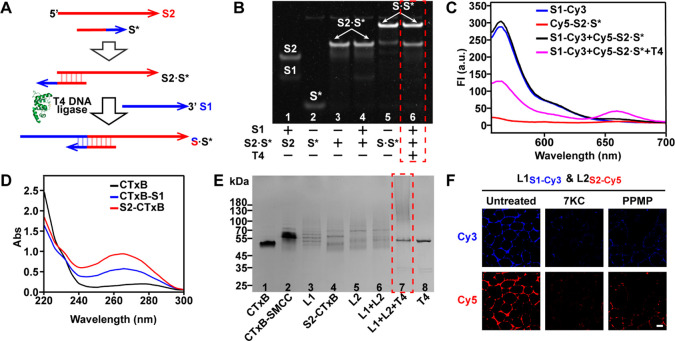
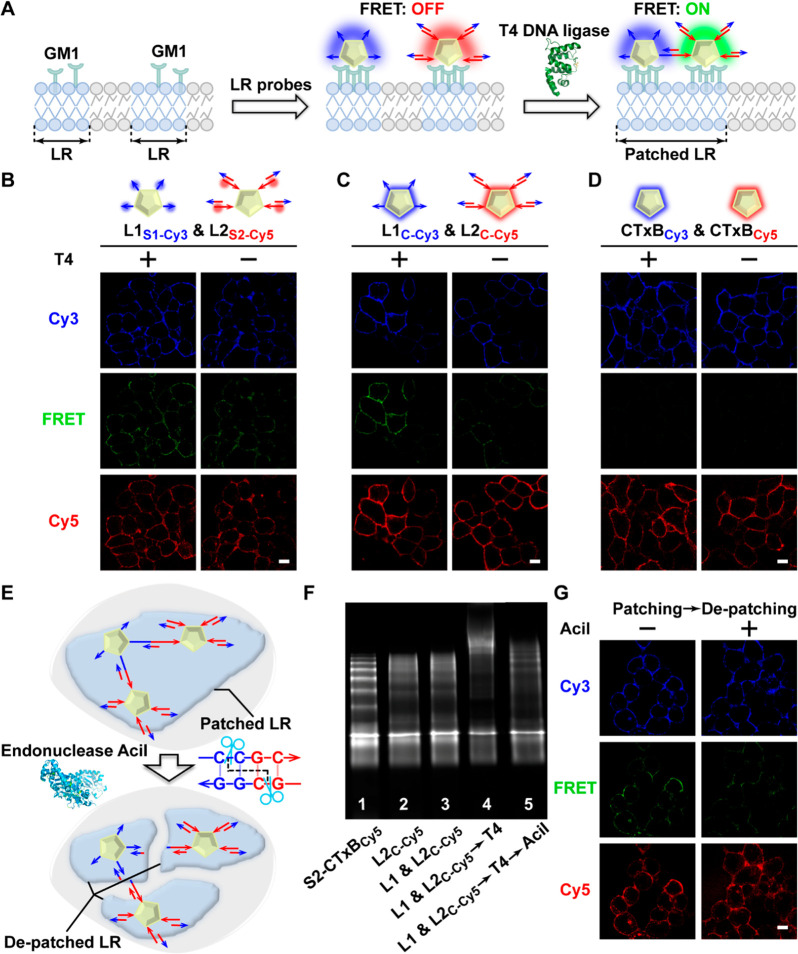
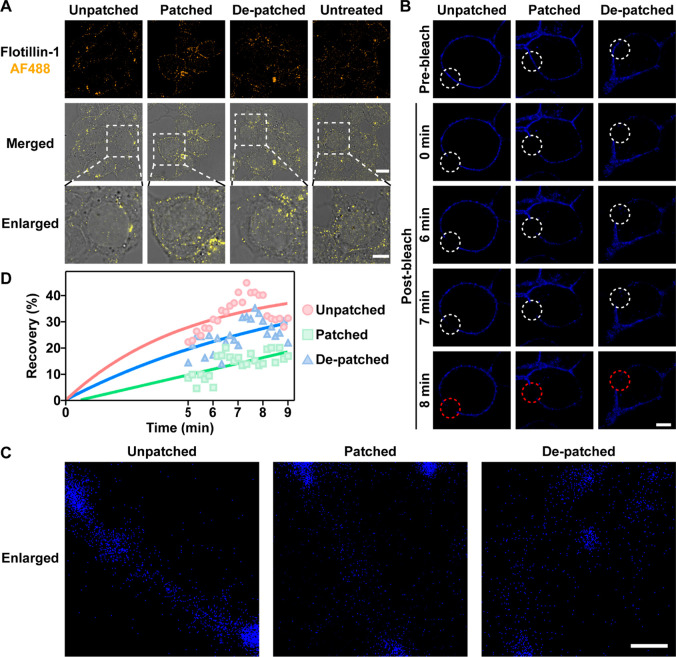
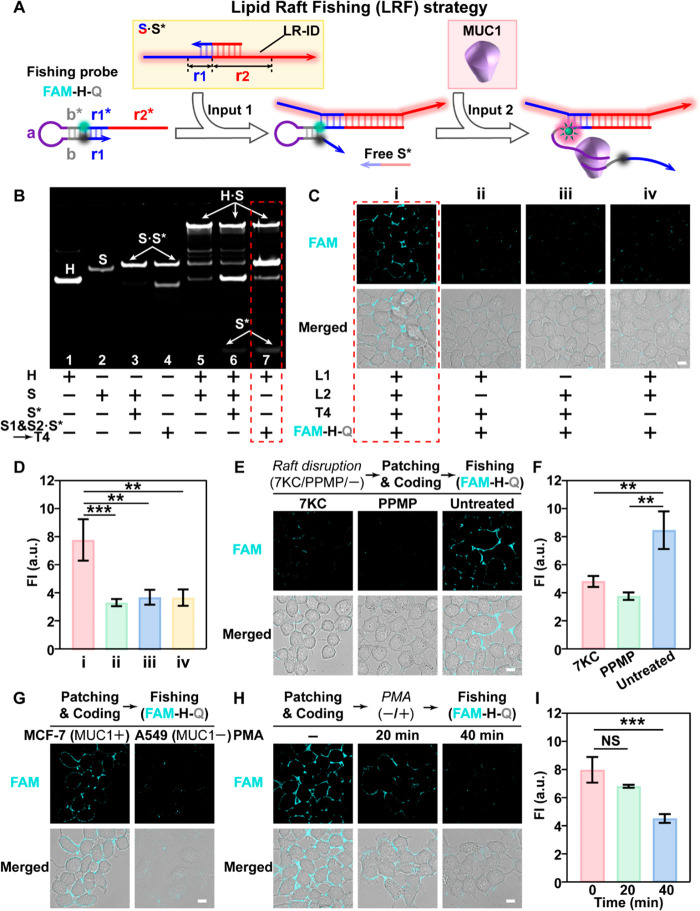
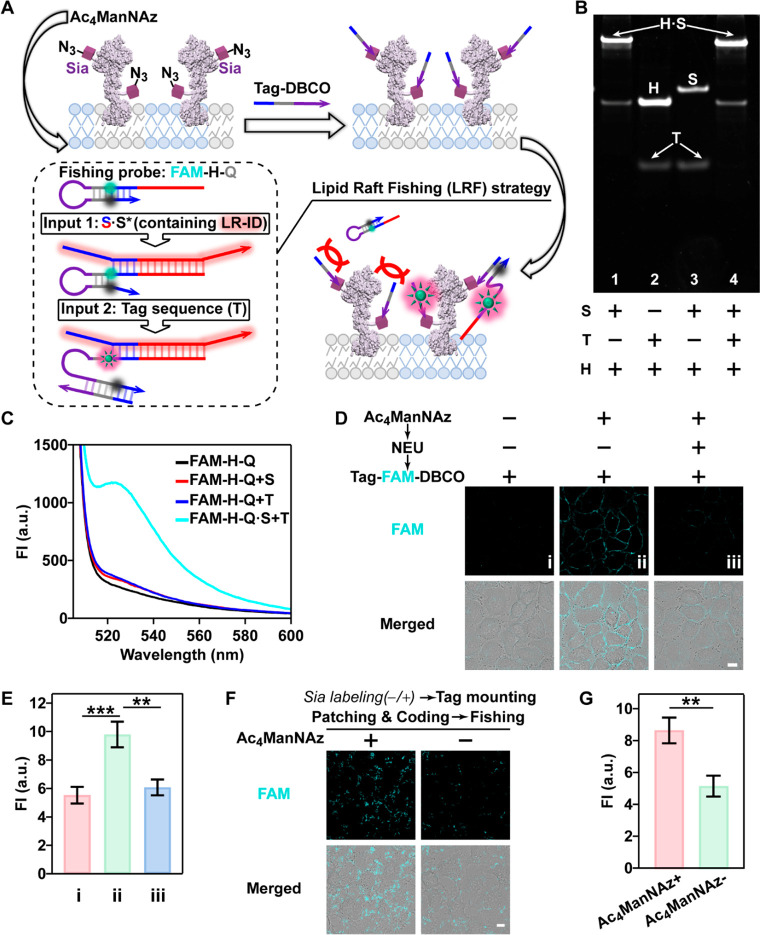
Lipid rafts (LRs) are relatively well-ordered functional microdomains in cell membranes and play an irreplaceable role in physiological processes as a transduction platform for multiple signaling pathways. Due to their small size and high spatiotemporal dynamics, it is difficult to perform lipid raft-localized biomolecule imaging on the surface of living cells. Here, we report a DNA nanotechnology-based platform for reversible manipulation and localized analysis of lipid rafts, which consists of two modules: "patching and coding probe pair" and "fishing probe". The probe pair is generated by modifying two different sets of connectable DNA structures on a lipid raft-specific protein. After recognizing lipid rafts, the two probes in close proximity are linked by a DNA ligase reaction to form a lipid raft identity (LR-ID) code. The LR-ID strand patches and stabilizes the lipid raft structure. Interestingly, the raft patches formed can be depatched by restriction endonucleases, providing the first reversible manipulation of the lipid raft structure in living cells. We also designed a "fishing probe" with a DNA hairpin structure using an aptamer that can specifically bind to the target. The probe can cascade the reaction to two input signals "LR-ID" and "target protein" to generate an "off-on" fluorescence switch, allowing imaging and dynamic monitoring of target proteins localized in lipid rafts. By encoding arbitrary targets (in the case of glycans) in lipid rafts, we have created a universal lipid raft-localized imaging platform. This work provides an integrated analytical and manipulative platform to reveal lipid rafts and associated signaling pathways at the molecular level.


Conflict of interest statement

The authors declare no competing financial interest.

Figures

Scheme 1
Scheme 1. Schematics of the Patching and Coding Platform for Lipid Raft-Localized Imaging
(A) Schematic illustrating the specific binding of the lipid raft (LR) probe pair (L1 and L2) to cell surface lipid rafts and subsequent patching of the rafts using T4 DNA ligase. L1 and L2 are CTxB-DNA hybrids with different DNA sequences that, when linked by T4, can not only stabilize and assemble raft patches but also provide an identification (LR-ID) code to indicate lipid raft regions. (B) Scheme showing the principle of using the fishing probe to perform lipid raft-specific biomolecule imaging. Only when the fishing probe binds the LR-ID, can it recognize the target, resulting in the restoration of fluorescence.
Figure 1
Figure 1
Design and fabrication of lipid raft probes. (A) Scheme of the DNA strand ligation reaction assisted by T4 DNA ligase (T4). (B) Native PAGE analysis: mixture of S1 and S2 (lane 1), S* (lane 2), mixture of S2 and S* after incubation at 37 °C for 1 h (lane 3), mixture of S2·S* and S1 (lane 4), mixture of S and S* after incubation at 37 °C for 1 h (lane 5), and mixture of S2·S*, S1, and T4 after incubation at 25 °C for 30 min (lane 6). (C) Fluorescence analysis of S1-Cy3, Cy5-S2·S*, and the mixture of both with or without T4. Excitation wavelength: 543 nm. (D) UV–vis spectra of CTxB, CTxB-S1, and S2-CTxB (2 μM in equivalent CTxB concentration). (E) SDS-PAGE characterization of CTxB (lane 1), CTxB-SMCC (lane 2), L1 (lane 3), S2-CTxB (lane 4), L2 (lane 5), the mixture of L1 and L2 without (lane 6) and with (lane 7) T4 DNA ligase added, and T4 DNA ligase alone (lane 8). (F) MCF-7 cells were pretreated with 7KC or PPMP to disrupt lipid rafts, followed by incubation with the mixture of L1S1-Cy3 and L2S2-Cy5 and confocal laser scanning microscope (CLSM) imaging. Scale bar: 10 μm. Data are representative of three individual experiments.
Figure 2
Figure 2
Reversible manipulation of lipid rafts on living cells. (A) Schematic of the lipid raft patching by formation of the CTxB-DNA cross-linked hybrids. (B–D) Demonstration of the T4-catalyzed ligation between paired lipid raft probes. CLSM images for Cy3, FRET, and Cy5 signals of MCF-7 cells after 1:1 mounting of the paired lipid raft probes and treatment with and without T4 are shown. Different probe pairs, including L1S1-Cy3 and L2S2-Cy5 (B), L1C-Cy3 and L2C-Cy5 (C), and CTxBCy3 and CTxBCy5 (D), were, respectively, used for testing. (E) Scheme showing the depatching of lipid rafts with endonuclease AciI. (F) Fluorescence blotting of S2-CTxBCy5 (lane 1), L2C-Cy5 (lane 2), L1 and L2C-Cy5 (lane 3), L1 and L2C-Cy5 → T4 (lane 4), and L1 and L2C-Cy5 → T4 → AciI (lane 5). (G) CLSM images of the CTxB-DNA cross-linked hybrids (using L1S1-Cy3 and L2S2-Cy5 probe pair) on MCF-7 cells with and without AciI treatment. Scale bars: 10 μm. Images and blots are representative of three individual experiments.
Figure 3
Figure 3
Demonstration of the patching and depatching of lipid rafts. (A) Stimulated emission depletion (STED) images of the immunofluorescence signal of flotillin-1 on MCF-7 cells before and after LR patching and those after depatching treatment. The cells incubated only with anti-flotillin-1 antibody were used as controls. Scale bars: 10 (top) and 5 μm (bottom). (B–D) Fluorescence recovery after photobleaching (FRAP) data of MCF-7 cells before and after LR patching and those after depatching treatment. (B) CLSM images of the L1C-Cy3 on MCF-7 cells at different recovery time points. Scale bar: 5 μm. (C) Magnified CLSM images of cells 8 min after photobleaching. Scale bar: 1 μm. (D) Plots of fluorescence recovery percentage in the region of interest shown in B versus time. Images are representative of three individual experiments.
Figure 4
Figure 4
Lipid raft-specific imaging and dynamic tracking of MUC1 on live cells. (A) Schematic illustration of the fishing probe (FAM-H-Q) design and the lipid raft fishing (LRF) strategy for imaging of raft-specific MUC1. (B) In vitro demonstration of the hybridization of the fishing probe H with the LR-ID (strand S) sequence using native PAGE. (C and D) CLSM imaging of raft-specific MUC1. (C) CLSM images of MCF-7 cells after different treatment combinations. (D) FI from C. (E and F) Demonstration of the raft specificity. (E) CLSM images of the fishing signal on MCF-7 cells with and without 7KC or PPMP pretreatment. (F) FI from E. (G) Demonstration of the target specificity. After patching and coding lipid rafts of MCF-7 or A549 cells with L1 and L2 and then T4, FAM-H-Q was added to the cells, followed by CLSM imaging. (H and I) Dynamic tracking of raft-specific MUC1 upon PMA treatment. (H) CLSM images of raft-specific MUC1 after PMA treatment for different periods of time. (I) FI from H. Images and blots are representative of three individual experiments. Scale bars: 10 μm. FI was quantified by averaging pixel readout over 30 cell contours, in triplicate. Data are presented as mean ± SD. p values were obtained with one-way analysis of variance (ANOVA) followed by Tukey’s multiple comparisons test. ** p < 0.01, *** p < 0.001, NS not significant.
Figure 5
Figure 5
Lipid raft-localized universal imaging platform. (A) Schematic illustration of the lipid raft universal fishing strategy using raft-specific Sia as the model target. (B and C) In vitro demonstration of the hybridization between the fishing probe H and Tag sequence (T) in the presence of LR-ID (strand S) using (B) native PAGE and (C) fluorescence analysis (FAM-H-Q was used instead). Excitation wavelength: 488 nm. (D and E) Demonstration of specific Tag installation on cell surface Sia. (D) CLSM images of A549 cells after incubation with Ac4ManNAz, treatment with or without with NEU, and subsequent Tag-FAM-DBCO labeling. Cells incubated with Ac4ManNAz only were used as control. (E) FI from D. (F and G) CLSM imaging of lipid raft-specific Sia. (F) A549 cells, with and without Sia metabolic labeling, were reacted with Tag-DBCO and subjected to lipid raft probe pair-based patching operation and FAM-H-Q-based fishing operation. (G) FI from F. Scale bars: 10 μm. Data are representative of three individual experiments. FI was quantified by averaging pixel readout over 30 cell contours in triplicate. Data are presented as mean ± SD. Differences between two groups were evaluated by unpaired t-test. Multiple group comparisons were performed by using one-way ANOVA followed by Tukey’s test. *** p < 0.001 and ** p < 0.01 were considered statistically significant.

Similar articles

Cited by

References

    1. Belardi B.; Son S.; Felce J. H.; Dustin M. L.; Fletcher D. A. Cell-cell interfaces as specialized compartments directing cell function. Nat. Rev. Mol. Cell Biol. 2020, 21 (12), 750–764. 10.1038/s41580-020-00298-7. - DOI - PubMed
    1. Bretscher M. S. Membrane structure - some general principles. Science 1973, 181 (4100), 622–629. 10.1126/science.181.4100.622. - DOI - PubMed
    1. Simons K.; Ikonen E. Functional rafts in cell membranes. Nature 1997, 387 (6633), 569–572. 10.1038/42408. - DOI - PubMed
    1. Sezgin E.; Levental I.; Mayor S.; Eggeling C. The mystery of membrane organization: composition, regulation and roles of lipid rafts. Nat. Rev. Mol. Cell Biol. 2017, 18 (6), 361–374. 10.1038/nrm.2017.16. - DOI - PMC - PubMed
    1. Staubach S.; Razawi H.; Hanisch F. G. Proteomics of MUC1-containing lipid rafts from plasma membranes and exosomes of human breast carcinoma cells MCF-7. Proteomics 2009, 9 (10), 2820–2835. 10.1002/pmic.200800793. - DOI - PubMed

LinkOut - more resources