. 2025 Jan;599(1):41-52.
doi: 10.1002/1873-3468.15047. Epub 2024 Oct 30.

Cryo-EM structures of the zinc transporters ZnT3 and ZnT4 provide insights into their transport mechanisms

Affiliations

Cryo-EM structures of the zinc transporters ZnT3 and ZnT4 provide insights into their transport mechanisms

Hanako Ishida et al. FEBS Lett. 2025 Jan.

Abstract

Zinc transporters (ZnTs) act as H+/Zn2+ antiporters, crucial for zinc homeostasis. Brain-specific ZnT3 expressed in synaptic vesicles transports Zn2+ from the cytosol into vesicles and is essential for neurotransmission, with ZnT3 dysfunction associated with neurological disorders. Ubiquitously expressed ZnT4 localized to lysosomes facilitates the Zn2+ efflux from the cytosol to lysosomes, mitigating the cell injury risk. Despite their importance, the structures and Zn2+ transport mechanisms remain unclear. We characterized the three-dimensional structures of human ZnT3 (inward-facing) and ZnT4 (outward-facing) using cryo-electron microscopy. By combining these structures, we assessed the conformational changes that could occur within the transmembrane domain during Zn2+ transport. Our results provide a structural basis for a more comprehensive understanding of the H+/Zn2+ exchange mechanisms exhibited by ZnTs.

Keywords: ZnT; cryo‐electron microscopy; membrane protein; three‐dimensional structure; zinc transporter.


Figures

Fig. 1
Fig. 1
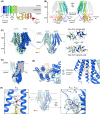
Structure of human ZnT3 under neutral pH conditions. (A) Topology diagram of ZnT3 colored from blue to red (N to C terminus). The membrane bilayer is indicated by the gray line. (B) Protomer structure of ZnT3neutral. The ZnT3neutral dimer is shown with one protomer colored from blue to red (N to C terminus) and the other in a transparent gray. (C) Overall structure of the ZnT3neutral dimer. The cryo‐EM map (left), cartoon model (middle), and cartoon models viewed from the luminal (top right) and cytosolic sides (bottom right) are shown. The two protomers (ZnT3 and ZnT3*) are shown in blue and light blue, respectively, and the second ZnT3 within the dimer and its residues indicated by asterisks. The bound Zn2+ is shown as red spheres. In the right panel, the scaffold (TM3 and TM6) and transport (TM1, TM2, TM4, and TM5) domains are indicated by blue and orange dotted boxes, respectively. The twofold symmetry axes are indicated by black ovals. (D) Inward‐facing cavity in the transmembrane domain. The ZnT3 dimer is shown with one protomer as the surface and the other as a ribbon. (E) Close‐up view of the LMNG molecule bound to the inward‐facing cavity. The LMNG molecule is shown as a yellow stick model along with the cryo‐EM densities as a semitransparent surface representation. (F) Zn2+ binding of ZnT3neutral. The STM (left), SCD1 and SCD2 sites (right), and overall structure (middle). Residues coordinating Zn2+ are shown as stick models.
Fig. 2
Fig. 2
Dimerization interfaces of ZnT3. (A) Dimerization interfaces around the membrane proximal and CTD regions (left), as well as the TMD region (right). The overall dimeric structure is shown in the middle. Each ZnT3 protomer is shown in blue and light blue. LMNG molecules are shown as yellow stick models, and bound Zn2+ shown as red spheres. (B) Interactions between the TM2‐TM3 loop and CTD. Overall structure (left) and magnified views (middle and right).
Fig. 3
Fig. 3
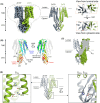
Structure of human ZnT3 under acidic pH conditions. (A) Overall structure of the human ZnT3acidic dimer. Cryo‐EM map (left), cartoon model (middle), and cartoon models viewed from the luminal (top right) and cytosolic sides (bottom right) are shown. The two protomers (ZnT3 and ZnT3*) are shown in yellow‐green and dark gray, respectively. (B) Protomer structure of ZnT3acidic. The ZnT3acidic dimer is shown, with one protomer colored from blue to red (N to C terminus) and the other in a transparent gray. (C) Inward‐facing cavity in the transmembrane domain. The ZnT3acidic dimer is shown with one protomer as the surface and the other as a ribbon. (D) Zn2+‐binding sites, STM (left), as well as SCD1 and SCD2 (right), of ZnT3acidic. The overall structure of the dimer is shown in the middle.
Fig. 4
Fig. 4
Structural comparisons of ZnT3neutral ZnT3acidic and ZnT3neutral ZnT4DM . (A, B) Superimposition of the TMD structure of ZnT3neutral (inward‐facing, Zn2+‐bound) and ZnT3acidic (inward‐facing, Zn2+‐unbound) aligned in TM3 and TM6, viewed from the lumen (A, left), cytosol (A, right), and side (B). ZnT3neutral is colored gray, and ZnT3acidic colored from blue to yellow (N to C terminus). (C, D) Superimposition of the TMD structure of ZnT3neutral (inward‐facing, Zn2+‐bound) and ZnT4DM (outward‐facing, Zn2+‐unbound) aligned in TM3 and TM6, viewed from the lumen (C, left), cytosol (C, right), and side (D). ZnT3neutral is colored gray, and ZnT4DM colored from blue to yellow (N to C terminus).
Fig. 5
Fig. 5
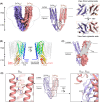
Structure of human ZnT4. (A) Overall structure of the human ZnT4DM dimer. Cryo‐EM map (left), cartoon model (middle), and cartoon models viewed from the luminal (top right) and cytosolic sides (bottom right) are shown. The two protomers (ZnT4DM and ZnT4DM*) are shown in pink and purple, respectively. (B) Protomer structure of ZnT4DM. The ZnT4DM dimer is shown with one protomer colored from blue to red (N to C terminus) and the other in a transparent gray. (C) Outward‐facing cavity in the transmembrane domain. The ZnT4DM dimer is shown with one protomer as the surface and the other as a ribbon. (D) Zn2+‐binding sites, STM (left), as well as SCD1 and SCD2 (right), of ZnT4DM. The overall structure of the dimer is shown in the middle.
Fig. 6
Fig. 6
Model of the H+/Zn2+ antiport mechanism of ZnT3 and ZnT4. Schematic representation of the ZnT3 and ZnT4 transport cycle based on the structures of ZnT3neutral (inward‐facing), ZnT3acidic (inward‐facing), and ZnT4DM (outward‐facing). Helices TM1 and TM2 are shown in blue, and TM4 and TM5 shown in green. Zn2+ and H+ are represented by the red and cyan spheres, respectively. In the inward‐facing state of ZnT3 or ZnT4, the TM4 and TM5 helices open toward the cytosolic side, and the key His residues of STM are exposed to the neutral pH environment of the cytosol, allowing the STM to coordinate Zn2+ (left). Cooperative structural rearrangements, with TM4 and TM5 sealing the intracellular side and TM1 and TM2 opening the luminal side, enable a structural transition from inward‐facing to outward‐facing states (middle). In the outward‐facing state, the His residues of the STM become protonated upon exposure to the acidic pH environment of the lumen, thereby releasing Zn2+. Following the transition back to the inward‐facing conformation, the His residues release protons upon exposure to a neutral pH environment, thereby completing the transport cycle (right).

Similar articles

Cited by

References

    1. Vallee BL and Falchuk KH (1993) The biochemical basis of zinc physiology. Physiol Rev 73, 79–118. - PubMed
    1. Maret W and Li Y (2009) Coordination dynamics of zinc in proteins. Chem Rev 109, 4682–4707. - PubMed
    1. Fukada T and Kambe T (2011) Molecular and genetic features of zinc transporters in physiology and pathogenesis. Metallomics 3, 662–674. - PubMed
    1. Kukic I, Kelleher SL and Kiselyov K (2014) Zn2+ efflux through lysosomal exocytosis prevents Zn2+−induced toxicity. J Cell Sci 127, 3094–3103. - PMC - PubMed
    1. Hara T, Takeda TA, Takagishi T, Fukue K, Kambe T and Fukada T (2017) Physiological roles of zinc transporters: molecular and genetic importance in zinc homeostasis. J Physiol Sci 67, 283–301. - PMC - PubMed

MeSH terms

LinkOut - more resources