. 2024 Nov 12;69(22):225015.
doi: 10.1088/1361-6560/ad8c93.

Noise & mottle suppression methods for cumulative Cherenkov images of radiation therapy delivery

Affiliations

Noise & mottle suppression methods for cumulative Cherenkov images of radiation therapy delivery

Jeremy E Hallett et al. Phys Med Biol. .

Abstract

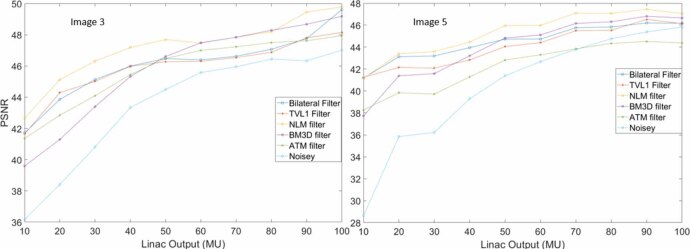
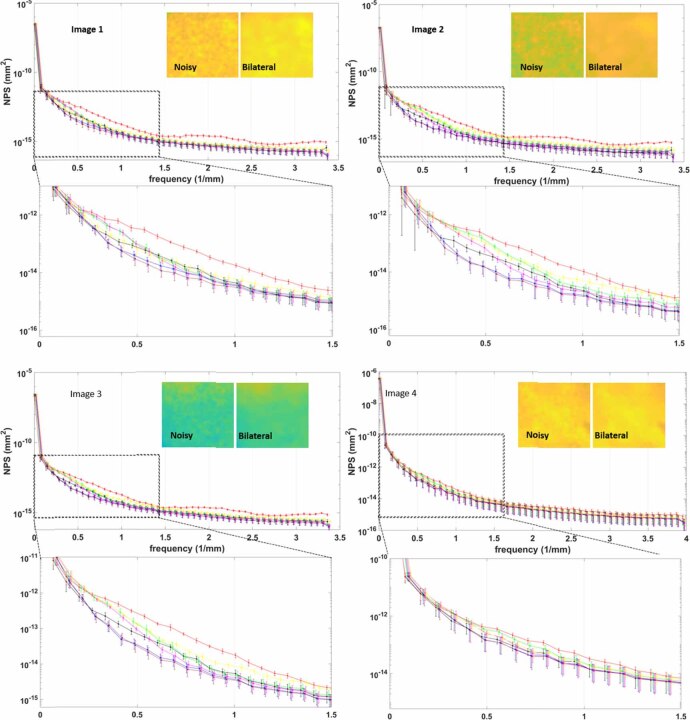
Purpose.Cherenkov imaging during radiotherapy provides a real time visualization of beam delivery on patient tissue, which can be used dynamically for incident detection or to review a summary of the delivered surface signal for treatment verification. Very few photons form the images, and one limitation is that the noise level per frame can be quite high, and mottle in the cumulative processed images can cause mild overall noise. This work focused on removing or suppressing noise via image postprocessing.Approach.Images were analyzed for peak-signal-to-noise and spatial frequencies present, and several established noise/mottle reduction algorithms were chosen based upon these observations. These included total variation minimization (TV-L1), non-local means filter (NLM), block-matching 3D (BM3D), alpha (adaptive) trimmed mean (ATM), and bilateral filtering. Each were applied to images acquired using a BeamSite camera (DoseOptics) imaged signal from 6x photons from a TrueBeam linac delivering dose at 600 MU min-1incident on an anthropomorphic phantom and tissue slab phantom in various configurations and beam angles. The standard denoised images were tested for PSNR, noise power spectrum (NPS) and image sharpness.Results.The average peak-signal-to-noise ratio (PSNR) increase was 17.4% for TV-L1. NLM denoising increased the average PSNR by 19.1%, BM3D processing increased it by12.1% and the bilateral filter increased the average PSNR by 19.0%. Lastly, the ATM filter resulted in the lowest average PSNR increase of 10.9%. Of all of these, the NLM and bilateral filters produced improved edge sharpness with, generally, the lowest NPS curve.Conclusion.For cumulative image Cherenkov data, NLM and the bilateral filter yielded optimal denoising with the TV-L1 algorithm giving comparable results. Single video frame Cherenkov images exhibit much higher noise levels compared to cumulative images. Noise suppression algorithms for these frame rates will likely be a different processing pipeline involving these filters incorporated with machine learning.

Keywords: Cherenkov; adaptive-trimmed mean; bilateral; block matching; denoising; non-local means; total variation.


Conflict of interest statement

Authors B Pogue, M Jermyn & P Bruza acknowledge financial involvement through ownership and employment with DoseOptics LLC.

Figures

Figure 1.
Figure 1.
(a) The BeamSite camera is mounted to the ceiling and directed towards the isocenter of the linac. (b) Example of a cumulative Cherenkov image, from a 15 × 15 cm2, 6 MV linac beam, incident upon the right breast of a body phantom, delivering 200 MU in a single beam.
Figure 2.
Figure 2.
Processes of the BM3D algorithm. The solid, gray block in the top search window represents the reference block and the dotted squares are the matched blocks. Ψ is the power spectral density (PSD) of the noise in the original image. Details are in Makinen et al (2020).
Figure 3.
Figure 3.
(a) Cherenkov image of a tissue phantom. The red box specifies the regions of the image used to assess image sharpness. (b) The right slanted edge of the unattenuated light in the Cherenkov image used for analysis of the image sharpness.
Figure 4.
Figure 4.
(a) Process of producing a radially average power spectrum by taking several radial profiles of the Fourier transform image. (b) Radially averaged power spectrum of the noisy Cherenkov image data. The percent difference plot is produced by comparing the filtered spectra to this spectrum.
Figure 5.
Figure 5.
The PSNR was maximized for each denoised image by applying each algorithm several times with varying parameter values with the parameters producing the greatest PSNR being chosen. For the TV-L1, NLM, BM3D, and ATM algorithms, only λ or σ were varied, but for the bilateral filter, the optimization included both σs and σr requiring the most computations out of the five algorithms each time it was applied. These plots show an example of these optimizations for image 5 of the 25MU images.
Figure 6.
Figure 6.
Five ground truth images were compared to noisy (25MU) and denoised images and the PSNR was calculated. NLM, TV-L1, and the bilateral filter all performed well with the NLM algorithm producing images with the largest PSNR on average. Both BM3D and ATM produced images with the lowest PSNR. Several images were considered to demonstrate the consistency of the results across images with different geometric, noise, and intensity features. Image 5 is given a larger display to demonstrate the effect of each filter compared to the noisy, unfiltered image.
Figure 7.
Figure 7.
The percent PSNR increase for high noise (25MU) and moderate noise (50MU) images was calculated. Each set contained five images. This box plot shows the median (solid dark blue line) as well as the upper and lower quartile (upper and lower box boundaries) for the PSNR increase calculated for each algorithm. Additionally, the mean PSNR increase values are plotted.
Figure 8.
Figure 8.
As the Cherenkov noise levels are increased (linac output decreased) each algorithm sees a different rate of degradation in their denoising effectiveness. The BM3D algorithm, for example, shows a large relative decrease in denoising ability as the noise is increased.
Figure 9.
Figure 9.
MTF plots for all images with the filters applied.
Figure 10.
Figure 10.
ESF plots for the noisy and filtered images. Zoomed images for the edges for the most blurred (ATM) and sharpest (bilateral) edge are included on the plot for visualization.
Figure 11.
Figure 11.
Edge sharpness metrics for each filtered image. (a) and (b) Shows larger MTF values for the bilateral and NLM filters over the noisy image implying that they enhance the edge sharpness. BM3D and TV show minimal edge blurring while the ATM filter produces blurrier edges. These results are corroborated by (c) where the rise distance decreases for the bilateral and NLM filter, remains roughly constant for the BM3D and TV filters, and increases for the ATM filter. (d) Shows the result of a multiple comparison test using the NLM and bilateral filters as the control groups. The star (*) highlights differences that are statistically significant according to a 95% confidence criteria.
Figure 12.
Figure 12.
NPS plots of the unfiltered, TV-L1, NLM, ATM, bilateral, BM3D and ground truth images. Error is calculated as the standard deviation of the NPS data points from the set of ROIs. The NLM and bilateral curves show a greater reduction in noise intensity in the low frequency range on average. Zoomed visualizations of the noisy and bilateral images are included to show the improvement in image homogeneity. Note that the data points of different filters are offset to allow for easier visualization.

Similar articles

References

    1. Aldosary G, Belec J, Foottit C, Vandervoort E. Dosimetric considerations for moldable silicone composites used in radiotherapy applications. J. Appl. Clin. Med. Phys. 2022;23:e13605. doi: 10.1002/acm2.13605. - DOI - PMC - PubMed
    1. Alexander D A, et al. One year of clinic-wide cherenkov imaging for discovery of quality improvement opportunities in radiation therapy. Pract. Radiat. Oncol. 2023;13:71–81. doi: 10.1016/j.prro.2022.06.009. - DOI - PMC - PubMed
    1. Alexander D A, Bruza P, Farwell J C M, Krishnaswamy V, Zhang R, Gladstone D J, Pogue B W. Detective quantum efficiency of intensified CMOS cameras for Cherenkov imaging in radiotherapy. Phys. Med. Biol. 2020;65:225013. doi: 10.1088/1361-6560/abb0c5. - DOI - PMC - PubMed
    1. Buades A, Coll B, Morel J M. A review of image denoising algorithms, with a new one. Multiscale Model. Simul. 2005;4:490–530. doi: 10.1137/040616024. - DOI
    1. Carles M, et al. Slanted Edge MTF. 2011 (available at: https://imagej.net/ij/plugins/se-mtf/index.html)

LinkOut - more resources