. 2025 Jan;45(1):45-59.
doi: 10.1177/0272989X241285866. Epub 2024 Oct 30.

Using QALYs as an Outcome for Assessing Global Prediction Accuracy in Diabetes Simulation Models

Affiliations

Using QALYs as an Outcome for Assessing Global Prediction Accuracy in Diabetes Simulation Models

Helen A Dakin et al. Med Decis Making. 2025 Jan.

Abstract

Objectives: (1) To demonstrate the use of quality-adjusted life-years (QALYs) as an outcome measure for comparing performance between simulation models and identifying the most accurate model for economic evaluation and health technology assessment. QALYs relate directly to decision making and combine mortality and diverse clinical events into a single measure using evidence-based weights that reflect population preferences. (2) To explore the usefulness of Q2, the proportional reduction in error, as a model performance metric and compare it with other metrics: mean squared error (MSE), mean absolute error, bias (mean residual), and R2.

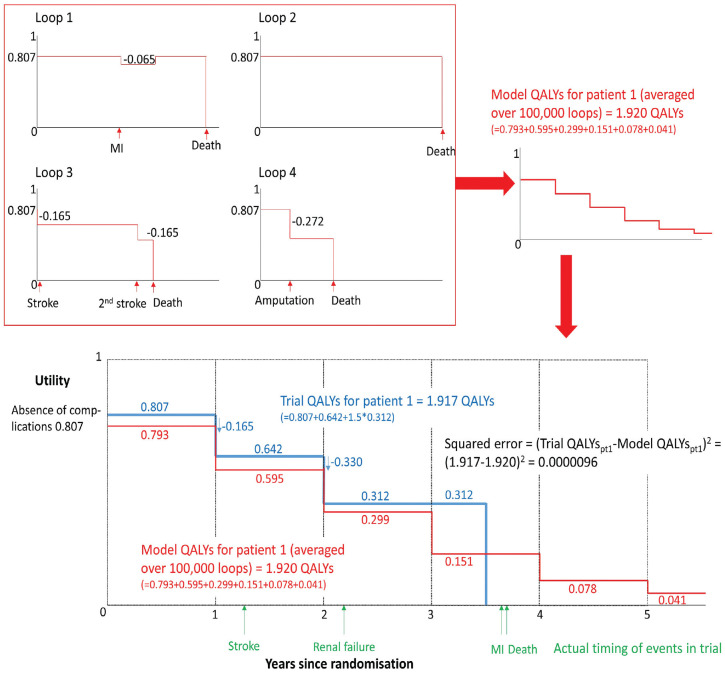
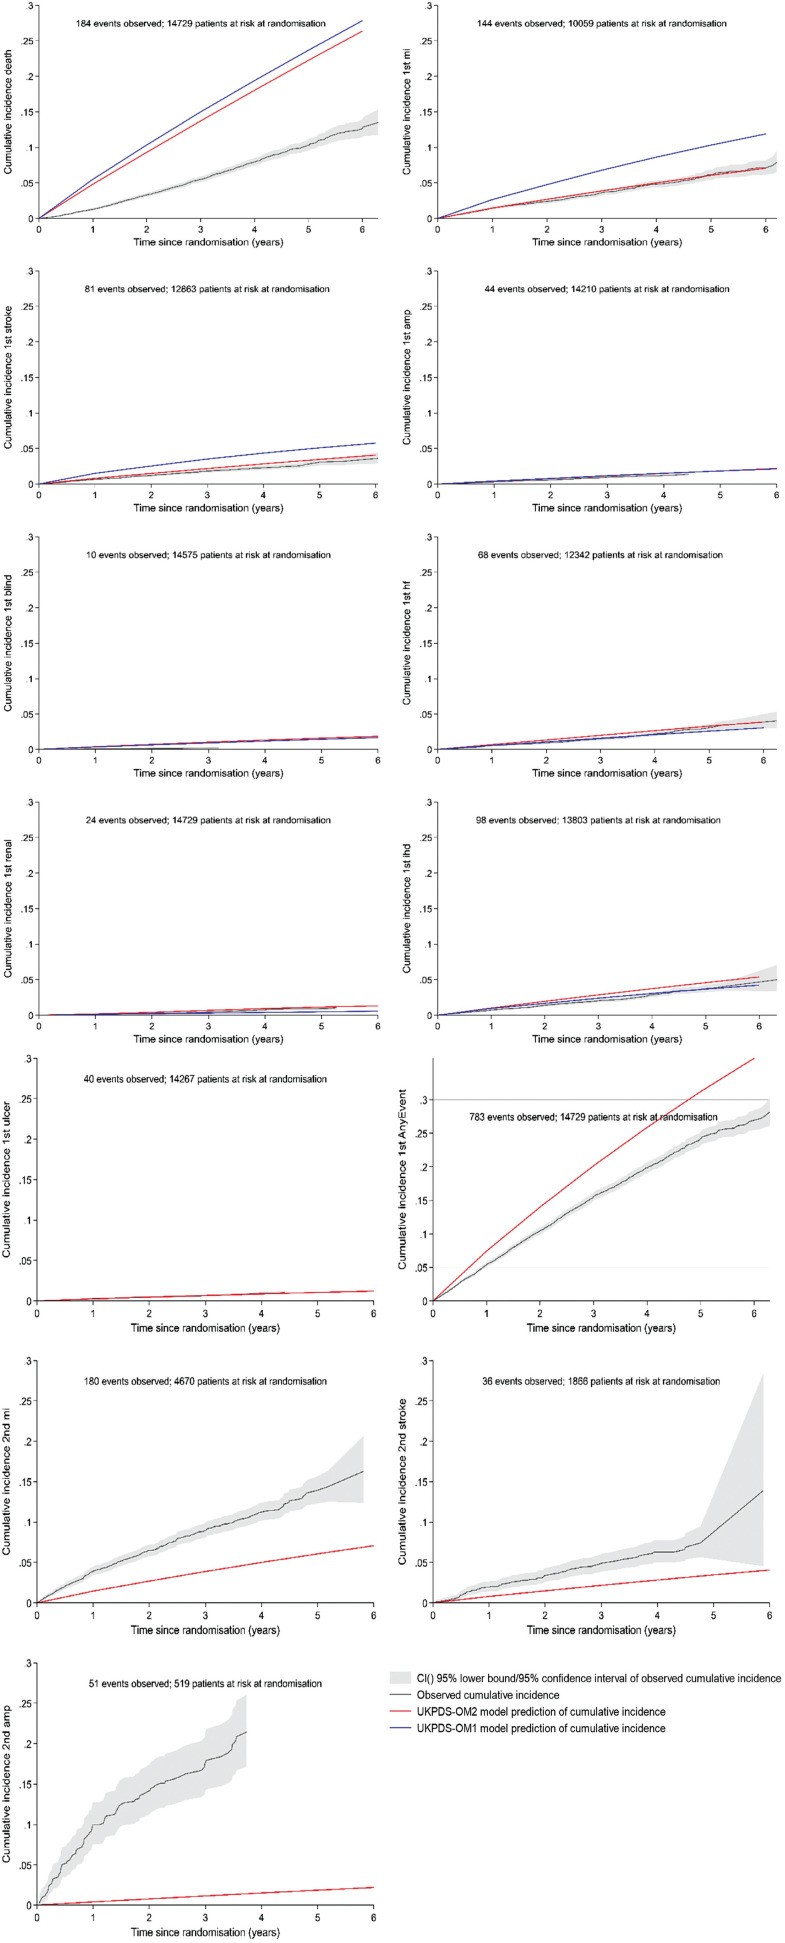
Methods: We simulated all EXSCEL trial participants (N = 14,729) using the UK Prospective Diabetes Study Outcomes Model software versions 1 (UKPDS-OM1) and 2 (UKPDS-OM2). The EXSCEL trial compared once-weekly exenatide with placebo (median 3.2-y follow-up). Default UKPDS-OM2 utilities were used to estimate undiscounted QALYs over the trial period based on the observed events and survival. These were compared with the QALYs predicted by UKPDS-OM1/2 for the same period.

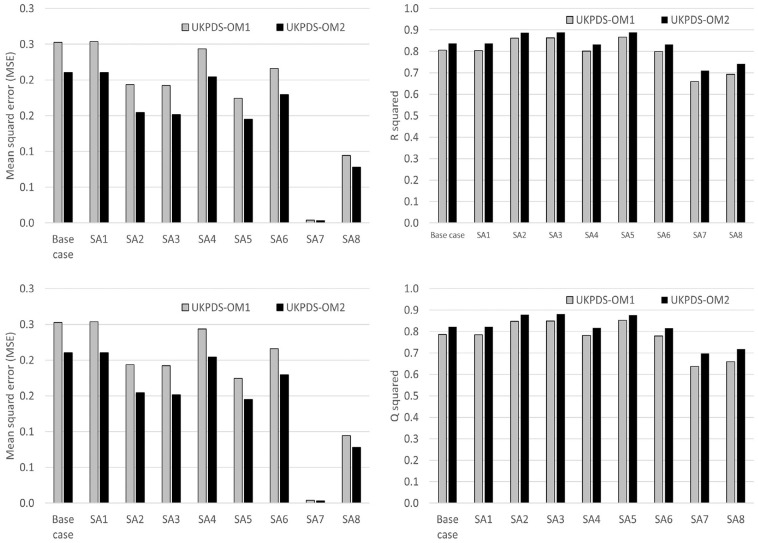
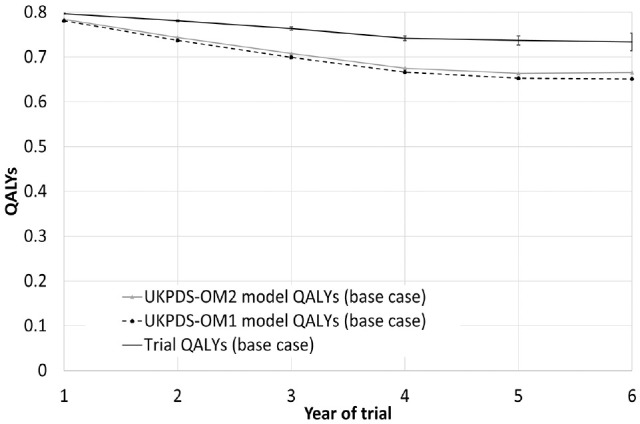
Results: UKPDS-OM2 predicted patients' QALYs more accurately than UKPDS-OM1 did (MSE: 0.210 v. 0.253; Q2: 0.822 v. 0.786). UKPDS-OM2 underestimated QALYs by an average of 0.127 versus 0.150 for UKPDS-OM1. UKPDS-OM2 predictions were more accurate for mortality, myocardial infarction, and stroke, whereas UKPDS-OM1 better predicted blindness and heart disease. Q2 facilitated comparisons between subgroups and (unlike R2) was lower for biased predictors.

Conclusions: Q2 for QALYs was useful for comparing global prediction accuracy (across all clinical events) of diabetes models. It could be used for model registries, choosing between simulation models for economic evaluation and evaluating the impact of recalibration. Similar methods could be used in other disease areas.

Highlights: Diabetes simulation models are currently validated by examining their ability to predict the incidence of individual events (e.g., myocardial infarction, stroke, amputation) or composite events (e.g., first major adverse cardiovascular event).We introduce Q2, the proportional reduction in error, as a measure that may be useful for evaluating and comparing the prediction accuracy of econometric or simulation models.We propose using the Q2 or mean squared error for QALYs as global measures of model prediction accuracy when comparing diabetes models' performance for health technology assessment; these can be used to select the most accurate simulation model for economic evaluation and to evaluate the impact of model recalibration in diabetes or other conditions.

Keywords: microsimulation; model performance; patient-level simulation; quality-adjusted life-years; risk modeling; type 2 diabetes mellitus.


Conflict of interest statement

The authors declared the following potential conflicts of interest with respect to the research, authorship, and/or publication of this article: All authors have completed the ICMJE uniform disclosure form.

Figures

Figure 1
Figure 1
Methods and assumptions for estimating model quality-adjusted life-years (QALYs) and trial QALYs for a hypothetical trial participant. When estimating trial QALYs and estimating model QALYs for each loop of the model, all participants begin with a utility of 0.807, which may be decreased following events, based on the assumptions within UKPDS-OM2 that are described in Appendix 3. For example, in loop 1 for this hypothetical patient, myocardial infarction reduces utility by 0.065 for 1 y, while in loop 3, successive strokes permanently reduce utility by 0.165 following each event and the patient dies before the end of trial follow-up. Model QALYs for this patient are averaged over at least 100,000 loops (giving equal weight to each loop). In a proportion of loops (e.g., loop 3), the model predicts that this patient will have events or die during year 1, so the model QALYs in year 1 are 0.793 (cf. the initial utility of 0.807). Conversely, in some loops, the model predicts that the patient will survive for >4 y, so the model QALYs extend beyond the date of the patient’s death. During the trial, this hypothetical participant actually experienced a stroke in year 2, which (based on the utilities within the model) reduced utility by 0.165. Subsequently, the patient had renal failure, which reduced utility by a further 0.330, and the participant died during year 4. When estimating QALYs (whether for the trial or the model), we assumed that events occurred at the start of each year and death occurred halfway through the year. Appendix 3 describes the assumptions and utilities used.
Figure 2
Figure 2
MSE, MAE, Q2, and R2 for QALYs. IHD, ischemic heart disease; MAE, mean absolute error; MI, myocardial infarction; MSE, mean squared error; Q2 = 1 − MSE/standard deviation; QALY, quality-adjusted life-year; SA, sensitivity analysis; UKPDS-OM1, United Kingdom Prospective Diabetes Study Outcomes Model version 1; UKPDS-OM2, United Kingdom Prospective Diabetes Study Outcomes Model version 2. SA1: Trial QALYs include second MI, stroke, amputation, blindness, and ulcer since randomization regardless of patient history. SA2: Excluding disutility from second MI, stroke, or amputation in UKPDS-OM2: 8,269 patients with no prior MI, stroke, or amputation. SA3: Excluding ulcer and second events from UKPDS-OM2 (which are not captured in UKPDS-OM1): 8,269 patients with no prior MI, stroke, or amputation. SA4: Alternative utility values for both UKPDS-OM1 and UKPDS-OM2: initial utility, 0.785; IHD, −0.09; MI, −0.055; stroke, −0.164; heart failure, −0.108; blindness, −0.074; ulcer, −0.170; amputation, −0.280; renal failure, −0.204; disutility for subsequent years same as year of event. SA5: Excluding QALYs in the year when patients were censored for both trial and model QALYs. SA6: Discounting QALYs at 3.5% per annum. SA7: 1-y time horizon. SA8: 3-y time horizon.
Figure 3
Figure 3
Trial and model QALYs in each year of the study for the base-case analysis. Person-years in which participants were censored or had been censored previously are excluded, although person-years after death are included. Error bars show 95% confidence intervals around trial QALYs. QALYs, quality-adjusted life-years; UKPDS-OM1, United Kingdom Prospective Diabetes Study Outcomes Model version 1; UKPDS-OM2, United Kingdom Prospective Diabetes Study Outcomes Model version 2.
Figure 4
Figure 4
Breakdown of model QALYs for UKPDS-OM2 by event: quality-adjusted life-years (QALYs) lost through the baseline disutility associated with diabetes, QALYs lost through the disutilities attached to each event, and years of life lost through mortality before year 7. The impact of each individual event includes only the disutilities directly applied to that event: it excludes any mortality from fatal events of that type (which are counted in the years of life lost) and the impact of one event on the risk of another event. For example, the impact of stroke captures only the quality-of-life reduction from nonfatal stroke (0.165): the QALYs lost from fatal stroke and the QALYs lost from stroke survivors having higher mortality are counted in years of life lost, while the QALYs lost from MI and amputation (which occur at a higher rate following a stroke) are counted under MI and amputation. IHD, ischemic heart disease; MI, myocardial infarction; QALYs, quality-adjusted life-years; SA, sensitivity analysis; UKPDS-OM2, United Kingdom Prospective Diabetes Study Outcomes Model version 2.
Figure 5
Figure 5
Observed (95% CI) cumulative incidence and predicted cumulative incidence from UKPDS-OM1 (blue line) and UKPDS-OM2 (red line) for individual events in the base-case analysis. amp, amputation; AnyEvent, first event of any type; CI, confidence interval; IHD, ischemic heart disease; MI, myocardial infarction; HF, heart failure; MSE, mean squared error; QALY, quality-adjusted life-year. Ulcer, second events, and the composite endpoint any event cannot be estimated by UKPDS-OM1 and so are shown only for UKPDS-OM2. The observed cumulative incidence of amputation, blindness, renal failure, and ulcer is plotted up to the last occurrence of that event in the trial. Deaths and any event are based on all patients. All other graphs plotting the incidence of the first event of each type are plotted only for the subset of patients who had no history of that event at randomization; graphs for second events are plotted only for patients who had a history of that event at randomization.

References

    1. Mount Hood Diabetes Challenge Network. Economics, simulation modelling & diabetes. Available from: https://www.mthooddiabeteschallenge.com/ [Accessed 15 November, 2021].
    1. Li J, Bao Y, Chen X, Tian L. Decision models in type 2 diabetes mellitus: a systematic review. Acta Diabetol. 2021;58:1451–69. DOI: 10.1007/s00592-021-01742-6 - DOI - PMC - PubMed
    1. Clarke PM, Gray AM, Briggs A, et al.. A model to estimate the lifetime health outcomes of patients with type 2 diabetes: the United Kingdom Prospective Diabetes Study (UKPDS) Outcomes Model (UKPDS no. 68). Diabetologia. 2004;47:1747–59. DOI: 10.1007/s00125-004-1527-z - DOI - PubMed
    1. Hayes AJ, Leal J, Gray AM, Holman RR, Clarke PM. UKPDS Outcomes Model 2: a new version of a model to simulate lifetime health outcomes of patients with type 2 diabetes mellitus using data from the 30 year United Kingdom Prospective Diabetes Study: UKPDS 82. Diabetologia. 2013;56:1925–33. DOI: 10.1007/s00125-013-2940-y - DOI - PubMed
    1. Mount Hood 4 Modeling Group. Computer modeling of diabetes and its complications: a report on the Fourth Mount Hood Challenge Meeting. Diabetes Care. 2007;30:1638–1646. DOI: 10.2337/dc07-9919 - DOI - PubMed

Substances

LinkOut - more resources