. 2024 Dec;11(47):e2405543.
doi: 10.1002/advs.202405543. Epub 2024 Oct 30.

Single-Cell RNA Sequencing Uncovers Pathological Processes and Crucial Targets for Vascular Endothelial Injury in Diabetic Hearts

Affiliations

Single-Cell RNA Sequencing Uncovers Pathological Processes and Crucial Targets for Vascular Endothelial Injury in Diabetic Hearts

Yan Zhang et al. Adv Sci (Weinh). 2024 Dec.

Abstract

Cardiovascular disease remains the leading cause of high mortality in individuals with diabetes mellitus. Endothelial injury is a major contributing factor for vascular dysfunction in diabetes. However, the precise mechanisms underlying endothelial cell injury and their heterogeneity in diabetes remains elusive. In this study, single-cell sequencing is performed in heart tissues from leptin receptor knock-out (db/db) diabetic mice at various pathological stages. Through cell cluster identification, differential gene analysis, intercellular communication analysis, pseudo time analysis, and transcription factor analysis, a novel mechanism of cardiac vascular endothelial damage in diabetes is identified. Specifically, a single-cell transcription map of cardiac vascular endothelial cells is presented in db/db mice. Diverse cellular clusters are found to play vital roles under diabetes-induced damage, highlighting crucial transcription factors involved in their regulation. In addition, the essential transcription factor Ets1 is found to protect against vascular endothelial injury in db/db mice. In summary, the work provides a comprehensive understanding of the development of diabetic cardiac vascular endothelial damage and the heterogeneity of the cells involved. These findings offer valuable insights into potential treatments and assessments of diabetic cardiovascular endothelial damage.

Keywords: cardiovascular; diabetic injury; endothelial cells; single‐cell analysis.


Conflict of interest statement

The authors declare no conflict of interest.

Figures
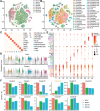
Figure 1
Figure 1
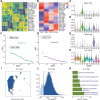
Characterization of cardiac vascular endothelial cells heterogeneity. A) t‐distributed Stochastic Neighbor Embedding (t‐SNE) depicting 63825 single cells isolated from different stages of diabetic heart. Each point represents a single cell, the point color was determined according to the group design. B) t‐SNE projection exhibiting the single cells according to identified cell types. C) Correlation between cell type marker genes and identified cell types. D) Expression of the endothelial cell markers Cdh5 and Pecam1 in different clusters. E) Heat map summarizing the top 3 differentially expressed genes in each cluster of endothelial cells. F) The proportion of various clusters across different pathological stages.
Figure 2
Figure 2
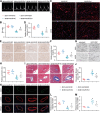
The state transition of cardiac vascular endothelial cells throughout the progression of diabetes‐induced injury. A) Monocle analyses showing the ordering of endothelial cells along pseudo time trajectories. The minute dots in the illustration signify cells, with diverse colors denoting distinct clusters or states. B) The heatmap displaying different blocks of differentially expressed genes along the pseudo time trajectories of the first branch. In terms of cell type, Gray denotes the pre‐brance state, which is state1, Red signifies state2, and Blue indicates state3. The diverse color GO function annotations on the right correspond to the gene set of the corresponding color. C) The heatmap presenting distinct clusters of genes that are differentially expressed in the second branch of the pseudotime trajectory. In terms of cell type, Gray denotes the pre‐brance state, which is state3, Red signifies state4, and Blue indicates state5. The diverse color GO function annotations on the right correspond to the gene set of the corresponding color. D) Changes in Igfbp5 gene expression throughout the pseudo time course, from initiation to termination.
Figure 3
Figure 3
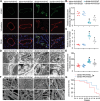
Ets1 is a significant transcription factor that is closely related to angiogenesis. A) SCENIC analysis was employed to reconstruct gene regulatory networks and identify transcription factors. B) Heat map of identified transcription factors by group. C) Expression of the transcription factor Meis2 in different clusters. D) Expression of the transcription factor Foxp1 in different clusters. E) Expression of the transcription factor Cebpb in different clusters. F) Regulatory intensity of cluster 12 transcription factors. G) Regulatory intensity of cluster 26 transcription factors. H–I) Expression of the transcription factor Ets1 in different clusters. J) AUC values of the Regulon, binary expression data representing active status, and expression levels of Ets1 were plotted on t‐SNE coordinates. K) GO analysis of 154 genes regulated by Ets1.
Figure 4
Figure 4
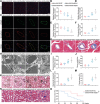
Endothelial Ets1 rescue restores cardiac vascular density in db/db mice. A,B) Representative Doppler echocardiography images and quantification of the ratio between the early and late mitral diastolic waves (E/A ratio) (n = 5). C,D) Representative and quantified immunofluorescence staining of CD31 (n = 5). The scale bars depict a length of 50 µm. E,F) Representative and quantified immunohistochemical staining of CD31 (n = 5). The scale bars depict a length of 250 µm. G) Representative vascular image detection using ink staining. The scale bars depict a length of 100 µm. H) Quantification of ink perfusion area (n = 5). I–J) Representative and quantified Masson's trichrome staining of perivascular tissue (n = 5). The scale bars depict a length of 300 µm. K–M) Representative and quantified immunofluorescence staining of CD31 and α‐SMA (n = 5). The scale bars depict a length of 30 µm. * P < 0.05 versus db/m+AAV‐NC; P < 0.05 versus db/db+AAV‐NC.
Figure 5
Figure 5
Endothelial Ets1 rescue attenuates cardiac vascular endothelial injury in db/db mice. A) Co‐immunofluorescence staining of VE‐cadherin and VCAM1 was conducted to assess endothelial damage (n = 5). Scale bars = 20 µm. B,C) Quantification of the expression level of VE‐cadherin and VCAM1. D) Transmission electron microscope was performed to observe changes in the endothelial cells. Scale bars = 2 µm. E) Quantification of the basement membrane thickness (n = 10). * P < 0.05 versus db/m+AAV‐NC; P < 0.05 versus db/db+AAV‐NC. F) Representative scanning electron micrographs of cardiac vascular corrosion in different groups. Scale bars = 10 µm. G) Survival curves of the animals (n = 10). *P < 0.05 versus db/db+AAV‐NC.
Figure 6
Figure 6
Ets1 overexpression in endothelial cells alleviates renal injury in db/db mice. A) Representative kidney images from different groups. B) Quantification of kidney/body weight (n = 5). Scale bars = 400 mm. C,D) Representative and quantified immunohistochemical staining of CD31 (n = 5). Scale bars = 100 µm. E) Serum creatinine in different groups (n = 5). F,G) Representative and quantified Masson's trichrome staining of kidneys (n = 5). Scale bars = 100 µm. H) Representative periodic acid‐silver methenamine staining of kidneys (n = 8). Scale bars = 100 µm. I) Quantification of glomerular basement membrane thickness. J–K) Representative and quantified F4/80 staining of kidneys (n = 6). Scale bars = 100 µm. L–O) The relative mRNA level of TNF‐α, IL‐1β, IL‐6, and ICAM‐1 in kidneys (n = 5). * P < 0.05 versus db/m+AAV‐NC; P < 0.05 versus db/db+AAV‐NC.
Figure 7
Figure 7
Ets1 knockdown in endothelial cells exacerbates cardiac and renal injury in db/db mice. A,B) Representative and quantified immunofluorescence staining of CD31 in the heart (n = 5). The scale bars depict a length of 100 µm. C) Co‐immunofluorescence staining of VE‐cadherin and VCAM1 in the heart was conducted to assess endothelial damage (n = 5). Scale bars = 20 µm. D,E) Quantification of the expression level of VE‐cadherin and VCAM1. F,G) Representative and quantified Masson's trichrome staining of perivascular tissue in the heart (n = 5). The scale bars depict a length of 50 µm. H) Transmission electron microscope was performed to observe changes in cardiac endothelial cells. Scale bars = 2 µm. I) Quantification of the basement membrane thickness (n = 10). J) Serum creatinine in different groups (n = 5). K) Representative periodic acid‐silver methenamine staining of kidneys (n = 8). Scale bars = 60 µm. L) Quantification of glomerular basement membrane thickness. M,N) Representative and quantified Masson's trichrome staining of kidneys (n = 5). Scale bars = 60 µm. *P < 0.05 versus db/m+AAV‐NC; P < 0.05 versus db/db+AAV‐NC. O) Survival curves of the animals (n = 10). * P < 0.05 versus db/db+AAV‐NC.

References

    1. Sun H., Saeedi P., Karuranga S., Pinkepank M., Ogurtsova K., Duncan B. B., Stein C., Basit A., Chan J. C. N., Mbanya J. C., Pavkov M. E., Ramachandaran A., Wild S. H., James S., Herman W. H., Zhang P., Bommer C., Kuo S., Boyko E. J., Magliano D. J., Diabetes Res Clin Pract 2022, 183, 109119. - PMC - PubMed
    1. Lancet 2016, 387, 1513. - PMC - PubMed
    1. Jankauskas S. S., Kansakar U., Varzideh F., Wilson S., Mone P., Lombardi A., Gambardella J., Santulli G., Metabolism 2021, 125, 154910. - PMC - PubMed
    1. Syed F. Z., Ann. Intern. Med. 2022, 175, ITC33. - PubMed
    1. Ali M. K., Pearson‐Stuttard J., Selvin E., Gregg E. W., Diabetologia 2022, 65, 3. - PMC - PubMed

LinkOut - more resources