. 2024 Oct 30;97(1):149-162.
doi: 10.1002/ana.27099. Online ahead of print.

Directional Subthalamic Deep Brain Stimulation Better Improves Gait and Balance Disorders in Parkinson's Disease Patients: A Randomized Controlled Study

Affiliations

Directional Subthalamic Deep Brain Stimulation Better Improves Gait and Balance Disorders in Parkinson's Disease Patients: A Randomized Controlled Study

Saoussen Cherif et al. Ann Neurol. .

Abstract

Objective: To investigate the effects of directional subthalamic deep brain stimulation (STN-dDBS) on gait and balance disorders, including freezing of gait (FOG), in patients with advanced Parkinson's disease (PD).

Methods: We included 10 participants who underwent STN-DBS and presented severe preoperative FOG, in a randomized, double-blind, crossover study. We used segmented DBS electrodes to investigate whether directing the predicted volume of tissue activated (VTA) to overlap the central STN preferentially improved gait and balance disorders compared to directional DBS applied in the more posterior STN (sensorimotor). We also assessed non-directional (ring-mode) STN-DBS. Our primary outcome was gait and balance control measured using instrumented gait recordings. Each patient had a pre-operative structural and diffusion-weighted imaging to model individual VTAs and to examine cortico-subthalamic connectivity. We used linear mixed-effects models to contrast the effects of central STN-dDBS, posterior STN-dDBS, and ring-mode STN-DBS.

Results: Central STN-dDBS produced significantly better improvement in gait and balance control compared to posterior STN-dDBS (p = 0.027), with fewer FOG episodes (p < 0.001). Conversely, ring-mode STN-DBS resulted in worsened postural control compared to central STN-dDBS (p = 0.009). The cortico-subthalamic connectivity with the STN VTAs involved mostly primary sensorimotor, premotor, and medial frontal cortices, with a higher overall cortico-STN connectivity with ring-mode STN-DBS.

Interpretation: Central STN-dDBS represents the best option to improve gait and balance disorders in PD patients, including FOG. Our findings raise the possibility of reprogramming STN-DBS toward the central area in selected patients with disabling FOG and/or postural instability after surgery. ANN NEUROL 2024.


Conflict of interest statement

S.C., N.T., M.Y., G.T., J.P., D.Z., M.R., S.D., D.M., S.F.V., E.B., B.L., and M.L.W. have nothing to report. E.H. and C.K. report honoraria and consultation fees from Boston Scientific who manufactures the medical devices used in the study.

Figures

FIGURE 1
FIGURE 1
Study design. DBS, deep brain stimulation; Dopa, dopamine medication; M, month; PREOP, preoperative assessment; STN, subthalamic nucleus. [Color figure can be viewed at www.annalsofneurology.org]
FIGURE 2
FIGURE 2
Leads locations and volume of tissue activated (VTAs) for ring‐mode, directional central and posterior subthalamic deep brain stimulation (STN‐DBS). (A–C) Coronal, axial, sagittal, and 3 dimensional (3D) posterior views of the VTAs of the 10 Parkinson's disease (PD) patients with central (C, green) and posterior (D, purple) STN‐directional DBS (dDBS), and ring‐mode STN‐DBS (E, orange), for the right and left electrodes. (D) The graph reports the VTAs included in (IN) and outside (OUT) the STN, and the total volumes (SUM), for the central (green) and posterior (purple) STN‐dDBS, and ring‐mode STN‐DBS (orange), for the right (R) and left (L) sides. (E) Individual electrode positions illustrated in a posterior 3D view (Montreal Neurological Institute [MNI] space). The central STN target is shown in color for the STN of each hemisphere. The different subregions of the STN are represented in light green (posterior‐motor), pink (central‐associative), and yellow (anterior‐limbic). (F) Posterior 3D view of the location of the barycenter of each VTA with central (green) and posterior (purple) STN‐dDBS, and ring‐mode STN‐DBS (orange), within the 3D atlas of the basal ganglia in MNI space. Each sphere represents 1 barycenter of 1 individual patient and for 1 side. (G) The graphs report the anteroposterior (Y_axis) and depth (Z_Axis) coordinates of the barycenter of each individual VTAs for ring‐mode (RING) STN‐DBS, and central (CENT), and posterior (POST) STN‐dDBS. *p < 0.05. [Color figure can be viewed at www.annalsofneurology.org]
FIGURE 3
FIGURE 3
Cortico‐subthalamic streamlines included in the volume of tissue activated (VTAs) for ring‐mode, central and posterior subthalamic deep brain stimulation (STN‐DBS). (A) Visualization of the cortico‐subthalamic streamlines included in the central (green) and posterior (purple) STN‐dDBS, and ring‐mode STN‐DBS (orange) for the right VTAs in 1 Parkinson's disease (PD) patient. (B) Three dimensional (3D) representation of the cortico‐subthalamic streamlines included in the central (green) and posterior (purple) STN‐directional DBS (dDBS), and ring‐mode STN ‐DBS (orange), in the 2 STN in 1 PD patient. 3D view of the cortico‐STN connectivity with all VTAs for the ring‐mode (left) and directional central (middle) and posterior (right) STN‐DBS conditions (high connectivity = yellow, low connectivity = purple). (C) The graph reports the mean and standard error (SE) of the fiber bundle counts (FBC) for the sensorimotor (SM) and prefrontal (Pf) networks fiber tracts included in the VTAs for central (green dots) and posterior (purple dots) STN‐dDBS and ring‐mode STN‐DBS (orange squares). (D) The graph reports the mean FBC between each of the 48 Brodmann areas included in the VTAs for central (green) and posterior (purple) STN‐dDBS, and ring‐mode STN‐DBS (orange), for the right and left sides. [Color figure can be viewed at www.annalsofneurology.org]
FIGURE 4
FIGURE 4
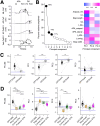
Gait initiation parameters, principal component analysis, effects of l‐dopa and subthalamic deep brain stimulation (STN‐DBS) on gait initiation performance. (A) Gait initiation parameters extracted from the mediolateral (ML) and anteroposterior (AP) displacements of the center of foot pressure (CoP); and AP and vertical (V) velocities of the center of mass (CoM). Included are the width (W), length (L), maximal velocity (Vm) of the first step, the minimal vertical velocity (V1) during the anticipatory postural adjustments (APA) phase (V1) and at the time of foot‐contact (FC, V2). The duration of the APA phase was the delay between the first biomechanical event (t0) and the foot‐off of the limb (FO1). The double‐stance duration (DS) is the delay between the FC and the second foot‐off (FO2). (B) Results of the principal component analysis performed on gait parameters, and correlation values for the parameters included in the first 3 principal components. Blue colors reflect negative correlations whereas purple colors reflect positive correlations. (C) The effects of l‐dopa treatment before surgery on gait initiation. Left most panel represents the Euclidean distance summarizing the 3 significant PC scores compared to PC scores measured in 10 healthy age‐matched controls (blue horizontal line). The 3 remaining panels illustrate the scores for each individual principal component. Small unfilled circles represent the mean distance or PC scores for each patient. The rectangles represent the estimated marginal mean for each condition with 95% confidence intervals (vertical line). The blue lines represent the distance or PC scores obtained in healthy controls (mean of individual control means). *p < 0.05, **p < 0.01, ***p < 0.001. (D) The effects of STN‐DBS on gait initiation during the randomized period (month 7). Formatting as for C. [Color figure can be viewed at www.annalsofneurology.org]
FIGURE 5
FIGURE 5
Effects of ring‐mode, directional central and posterior subthalamic (STN) deep brain stimulation (DBS) on freezing of gait (FOG) episodes during forward walking, and clinical gait and balance disorders and motor disability. Small unfilled circles represent the mean for each patient of the measure indicated by the ordinate label. The rectangles represent the estimated marginal mean for each condition with 95% confidence intervals (vertical line). *p < 0.05, **p < 0.01, ***p < 0.001. GABS, Gait and Balance Scale; MDS‐UPDRS, Movement Disorders Society‐Unified Parkinson's Disease Rating Scale. [Color figure can be viewed at www.annalsofneurology.org]
FIGURE 6
FIGURE 6
Effects of chronic central subthalamic (STN) directional deep brain stimulation (dDBS) on kinetic gait parameters, and clinical gait and balance disorders and motor disability. Left 3 panels indicate mean scores for the 3 principal components of gait initiation with central STN‐dDBS at M7 (green dark), M8 (green light), and M13 (green). Small unfilled circles represent the mean for each patient of the measure indicated by the ordinate label. The rectangles represent the estimated marginal mean for each condition with 95% confidence intervals (vertical line). *p < 0.05. Right 3 panels illustrate the parkinsonian disability (MDS‐UPDRS part III), axial, and GABS scores obtained in the same STN‐DBS conditions. Symbol formatting as for left panels. GABS, Gait and Balance Scale; MDS‐UPDRS, Movement Disorders Society‐Unified Parkinson's Disease Rating Scale. [Color figure can be viewed at www.annalsofneurology.org]

References

    1. Nutt JG, Bloem BR, Giladi N, et al. Freezing of gait: moving forward on a mysterious clinical phenomenon. Lancet Neurol 2011;10:734–744. - PMC - PubMed
    1. Perez‐Lloret S, Negre‐Pages L, Damier P, et al. Prevalence, determinants, and effect on quality of life of freezing of gait in Parkinson disease. JAMA Neurol 2014;71:884–890. - PubMed
    1. Kempster PA, Williams DR, Selikhova M, et al. Patterns of levodopa response in Parkinson's disease: a clinico‐pathological study. Brain 2007;130:2123–2128. - PubMed
    1. Bharti K, Suppa A, Tommasin S, et al. Neuroimaging advances in Parkinson's disease with freezing of gait: a systematic review. Neuroimaging advances in Parkinson's disease with freezing of gait: a systematic review. Vol 24. NeuroImage: Clinical, 2019:102059. - PMC - PubMed
    1. Canu E, Agosta F, Sarasso E, et al. Brain structural and functional connectivity in Parkinson's disease with freezing of gait. Hum Brain Mapp 2015;36:5064–5078. - PMC - PubMed

LinkOut - more resources