. 2024 Nov 20;90(11):e0174024.
doi: 10.1128/aem.01740-24. Epub 2024 Oct 30.

Pangenome analysis of Paenibacillus polymyxa strains reveals the existence of multiple and functionally distinct Paenibacillus species

Affiliations

Pangenome analysis of Paenibacillus polymyxa strains reveals the existence of multiple and functionally distinct Paenibacillus species

Federica Maggi et al. Appl Environ Microbiol. .

Abstract

Paenibacillus polymyxa, a Gram-positive bacterium commonly found in soil and plant roots, plays an important role in the environment due to its nitrogen-fixing ability and is renowned for producing antibiotics like polymyxin. In this study, we present a robust framework for investigating the evolutionary and taxonomic connections of strains belonging to P. polymyxa available at the National Center for Biotechnology Information, as well as five new additional strains isolated at the University of Camerino (Italy), through pangenome analysis. These strains can produce secondary metabolites active against Staphylococcus aureus and Klebsiella pneumoniae. Employing techniques such as digital DNA-DNA hybridization (dDDH), average nucleotide identity (ANI) estimation, OrthoFinder, and ribosomal multilocus sequence typing, we consistently divided these P. polymyxa strains into four clusters, which differ significantly in terms of ANI and dDDH percentages, both considered as reference indices for separating bacterial species. Moreover, the strains of Cluster 2 were re-classified as belonging to the Paenibacillus ottowii species. By comparing the pangenomes, we identified the core genes of each cluster and analyzed them to recognize distinctive features in terms of biosynthetic/metabolic potential. The comparison of pangenomes also allowed us to pinpoint differences between clusters in terms of genetic variability and the percentage of the genome dedicated to core and accessory genes. In conclusion, the data obtained from our analyses of strains belonging to the P. polymyxa species converge toward a necessary reclassification, which will require a fundamental contribution from microbiologists in the near future.

Importance: The development of sequencing technologies has led to an exponential increase in microbial sequencing data. Accurately identifying bacterial species remains a challenge because of extensive intra-species variability, the need for multiple identification methods, and the rapid rate of taxonomic changes. A substantial contribution to elucidating the relationships among related bacterial strains comes from comparing their genomic sequences. This comparison also allows for the identification of the "pangenome," which is the set of genes shared by all individuals of a species, as well as the set of genes that are unique to subpopulations. Here, we applied this approach to Paenibacillus polymyxa, a species studied for its potential as a biofertilizer and biocontrol agent and known as an antibiotic producer. Our work highlights the need for a more efficient classification of this bacterial species and provides a better delineation of strains with different properties.

Keywords: Paenibacillus polymyxa; evolutionary analysis; genomics; pangenome.


Conflict of interest statement

The authors declare no conflict of interest.

Figures
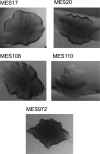
Fig 1
Fig 1
Morphological features of the MES strain colonies. Microscopic images of the colonies of the indicated MES strains grown for 4 days at 15°C on LB plates.
Fig 2
Fig 2
Growth inhibition induced by secondary metabolites released by MES strains on solid medium. Inhibition of E. coli ATCC 25922 (A), B. subtilis ATCC 6633 (B), S. aureus ATCC 25923 (C), and K. pneumoniae ATCC13883 (D) growth produced by the indicated MES strains grown as a spot of 20 mm at the center of each LB plate. After 24 hours of incubation at 30°C, the zone of growth inhibition was measured in terms of millimeters from the outer edge of the circular area containing the MES strain under examination. The inhibition halo is the average distance between the outer edge of the MES spot and the boundary line of growth of each tester strain. Error bars indicate the standard deviation calculated from triplicate measurements.
Fig 3
Fig 3
Phylogenetic tree features of the considered 62 strains obtained with OrthoFinder and FastANI. The circular heatmaps, from inside to outside, show (A) the percentage of BUSCO, genome size, number of genes, and GC content for each strain, (B) the number of plasmids, the isolation source, and the geographical origin of each strain.
Fig 4
Fig 4
Correlation matrix of the average nucleotide identity (A) and the digital DNA-DNA hybridization (B) values of the analyzed genomes. The ANI percentage varies between 88% (yellow) and 100% (red), while dDDh varies between 35% (yellow) and 100% (red).
Fig 5
Fig 5
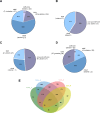
Pangenome of P. polymyxa. Representation of the number of genes belonging to the core, soft core, shell, or cloud of the P. polymyxa strains by pie chart belonging to Cluster 1 (A), Cluster 2 (B), Cluster 3 (C), and Cluster 4 (D). The numbers in parentheses refer to the criteria used to separate the genes into core, soft core, shell, or cloud genomes based on their presence in the strains, as described in Materials and Methods. (E) Graphical representation of the number of core genes shared between the four pangenomes using the Jvenn tool (19).
Fig 6
Fig 6
Phylogenetic tree obtained by rMLST investigation. The four clusters previously identified by FastANI and dDDh studies are indicated with the corresponding numbers and colors used in Fig. 5E for the Venn diagram.
Fig 7
Fig 7
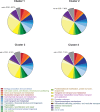
Differences in the number of COG categories identified by EggNOG-mapper annotation in the core genomes of the four clusters. The pie charts depict the distribution of various COG categories indicated in the legend and represented by the corresponding colors. The percentage of each category was calculated based on the number of COG categories assigned to the identified genes (see File S5 and Materials and Methods).
Fig 8
Fig 8
In silico prediction of secondary metabolites using antiSMASH. Only the secondary metabolites produced by BGC with a similarity of >80% with known BGC of the Minimum Information about a Biosynthetic Gene Cluster repository were selected and reported. For each strain, the heatmap shows the presence (from 1 to 4) or absence (= 0) of the corresponding BGCs involved in the synthesis of the indicated compound. Heatmap was created using GraphPad version 9.3.

References

    1. Grady EN, MacDonald J, Liu L, Richman A, Yuan ZC. 2016. Current knowledge and perspectives of Paenibacillus: a review. Microb Cell Fact 15:203. doi:10.1186/s12934-016-0603-7 - DOI - PMC - PubMed
    1. Medini D, Donati C, Tettelin H, Masignani V, Rappuoli R. 2005. The microbial pan-genome. Curr Opin Genet Dev 15:589–594. doi:10.1016/j.gde.2005.09.006 - DOI - PubMed
    1. Vernikos G, Medini D, Riley DR, Tettelin H. 2015. Ten years of pan-genome analyses. Curr Opin Microbiol 23:148–154. doi:10.1016/j.mib.2014.11.016 - DOI - PubMed
    1. Wright B, Farquharson KA, McLennan EA, Belov K, Hogg CJ, Grueber CE. 2019. From reference genomes to population genomics: comparing three reference-aligned reduced-representation sequencing pipelines in two wildlife species. BMC Genomics 20:453. doi:10.1186/s12864-019-5806-y - DOI - PMC - PubMed
    1. Wang B, Cheng H, Qian W, Zhao W, Liang C, Liu C, Cui G, Liu H, Zhang L. 2020. Comparative genome analysis and mining of secondary metabolites of Paenibacillus polymyxa. Genes Genet Syst 95:141–150. doi:10.1266/ggs.19-00053 - DOI - PubMed

MeSH terms

LinkOut - more resources